In this article, we will show you how to create Extract Filters in Tableau with an example. For this, we are going to use the SQL Server Data Source.
In this example, we want to demonstrate the steps involved in creating the extract filters in Tableau. Before we start creating filters, we need some data. To get the data, Go to the Data Source, create a Custom SQL Query, or Drag and Drop the tables to get data from the database.
Create Extract Filters in Tableau
Before getting into these Extract Filters, I suggest you refer to Filters to understand the basic techniques. Also, visit the Connecting to Server article to understand the connection process.
For this extract filters demo, we are writing the Custom SQL Query on the Adventure Works DW database. The custom SQL Query we used in the above Tableau Extract Filters data source is:
SELECT Geo.EnglishCountryRegionName,  Geo.StateProvinceName,  Geo.City,
       Prod.Color,  Cust.Gender, Cust.YearlyIncome, Cust.EnglishOccupation,
       Fact.SalesAmount FROM DimProduct AS Prod
INNER JOIN FactInternetSales AS Fact ON Prod.ProductKey = Fact.ProductKey
INNER JOIN DimCustomer AS Cust ON Fact.CustomerKey = Cust.CustomerKey
INNER JOIN DimGeography AS Geo ON Cust.GeographyKey = Geo.GeographyKey
NOTE: Don’t worry about the code and Joins we used in the above statement. However, If you want to learn SQL Server, Please visit our SQL tutorials page.
To create Tableau Filters, Change the connection from Live to Extract under the Connection section and click on the Edit button.
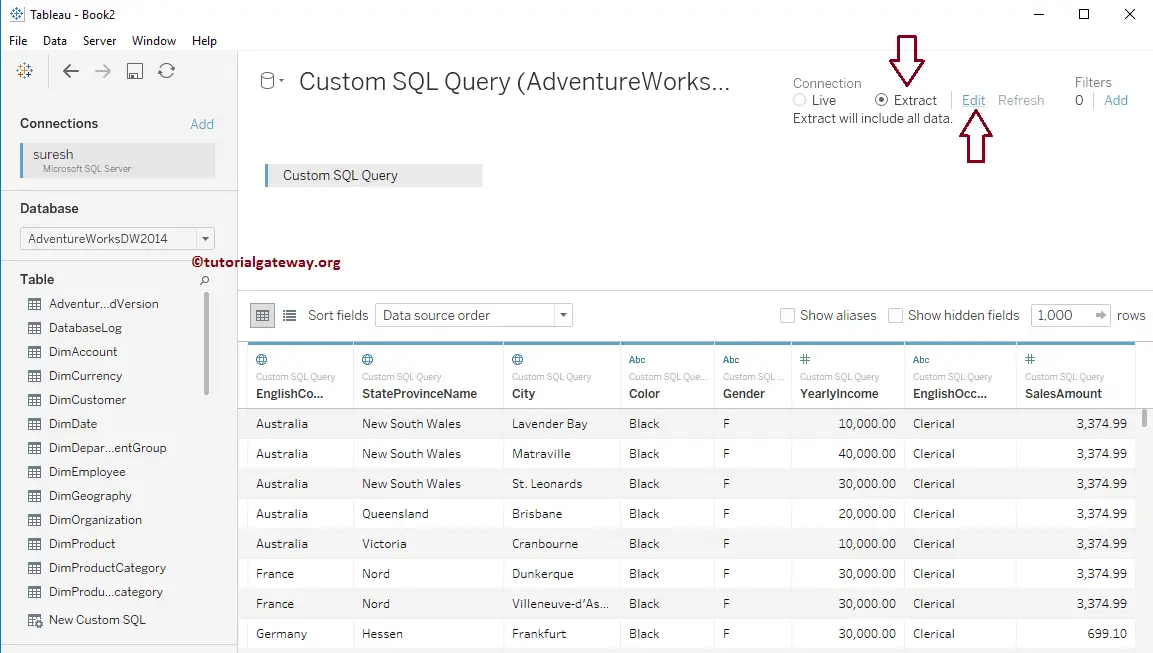
Once you click on the Edit Hyperlink, a new window will open, as shown below. To create our first extract filter, click on the Add.. button.
Tableau Extract Filters on Dimensions
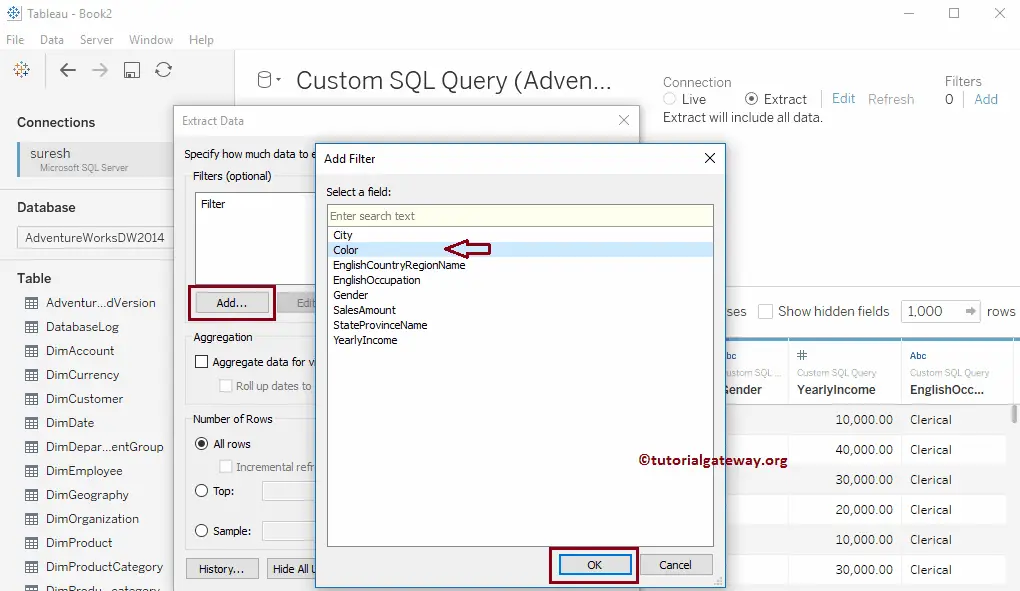
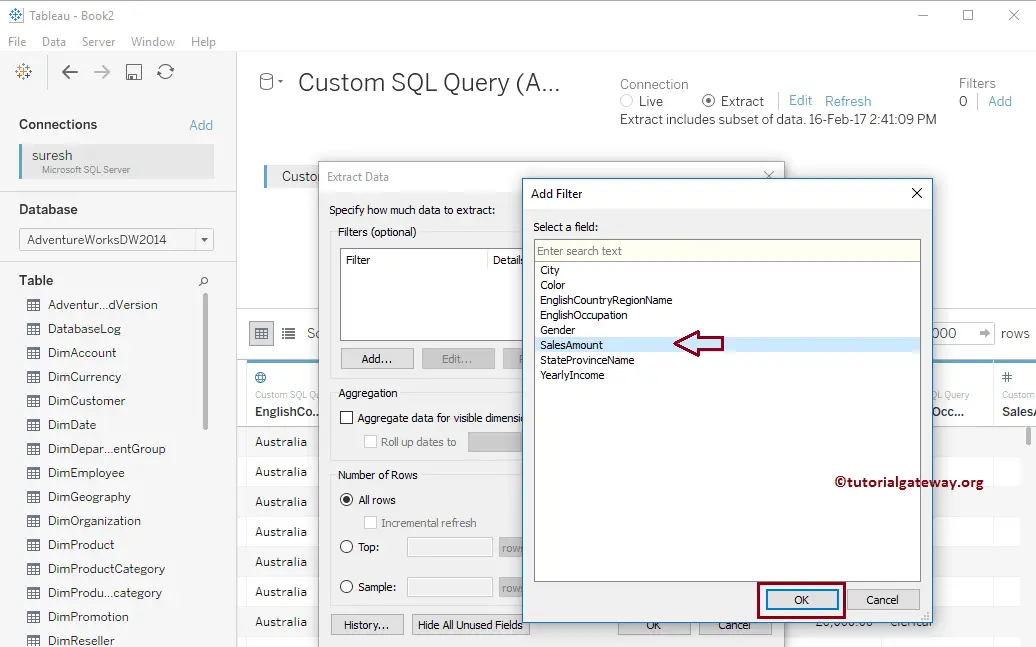
Once you click on the Add.., a new window called Add Filter will be opened. It contains a list of all the columns available in the Tables. Here, you can select the field you want to apply the filter.
Please select the Dimension field from the list of available fields or Columns. From the screenshot below, you can observe that we are choosing the Color Dimension as our filter field.
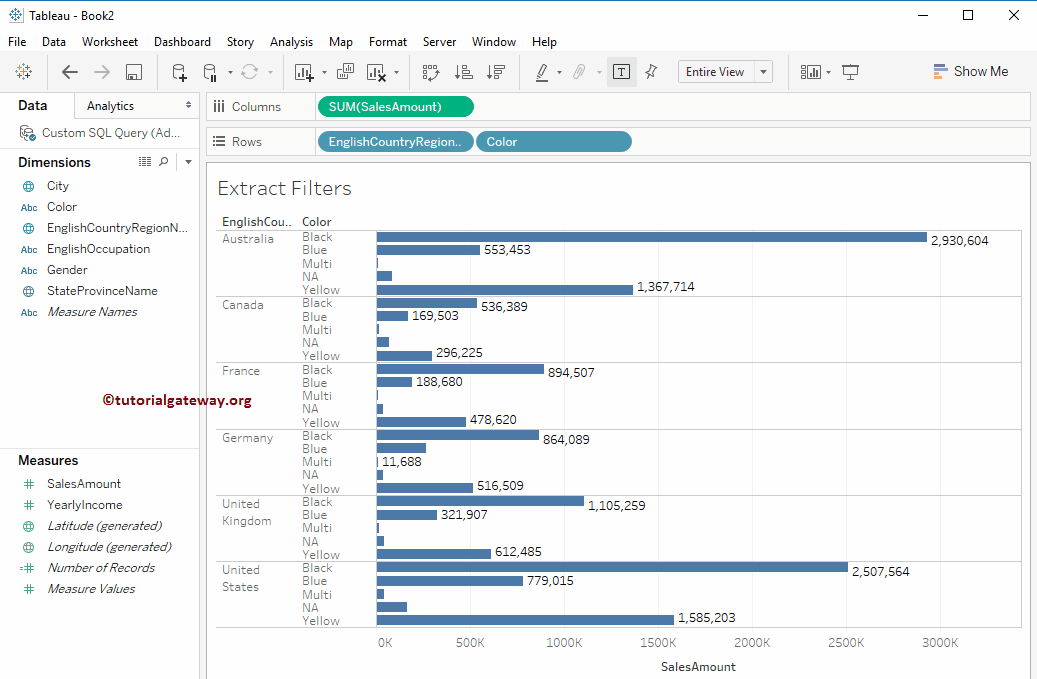
Once you select the Color Dimension field, a new window called Filter will open. Here, we choose Black, Blue, Multi, NA, and Yellow. It means the data source gets the data whose Color is Black, Blue, Multi, NA, or Yellow.
I suggest you refer to the Filters on Dimensions article to understand the properties in the following window.
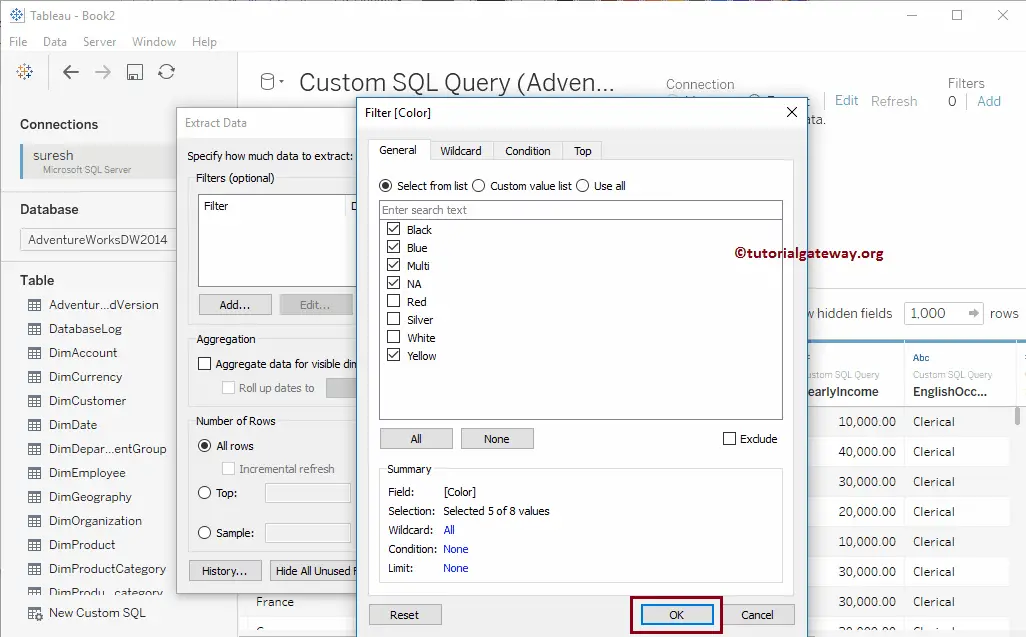
Click OK to close the following window.
Drag and Drop the English Country Region Name, Color present in the Dimension Region to Rows Shelf, and Sales Amount Measures region to Columns Shelf. As you can see, our report displays the records whose color is Black, Blue, Multi, NA, or Yellow.
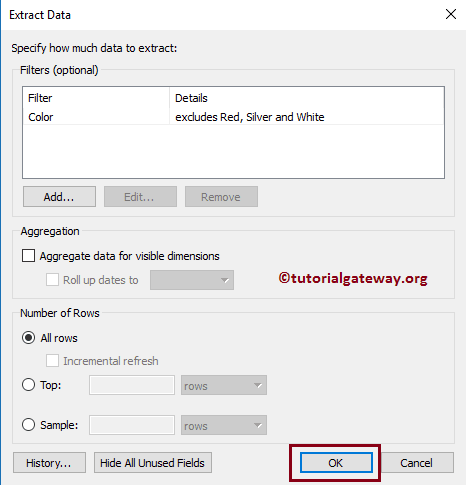
Remove Extract Filters in Tableau
It is easy to remove the extract filters. To do so, go to the Connection section within the Data Source and click the Edit hyperlink beside it. It opens the list of available extract filters on that data source. Please select the required filter and click on the Remove button.
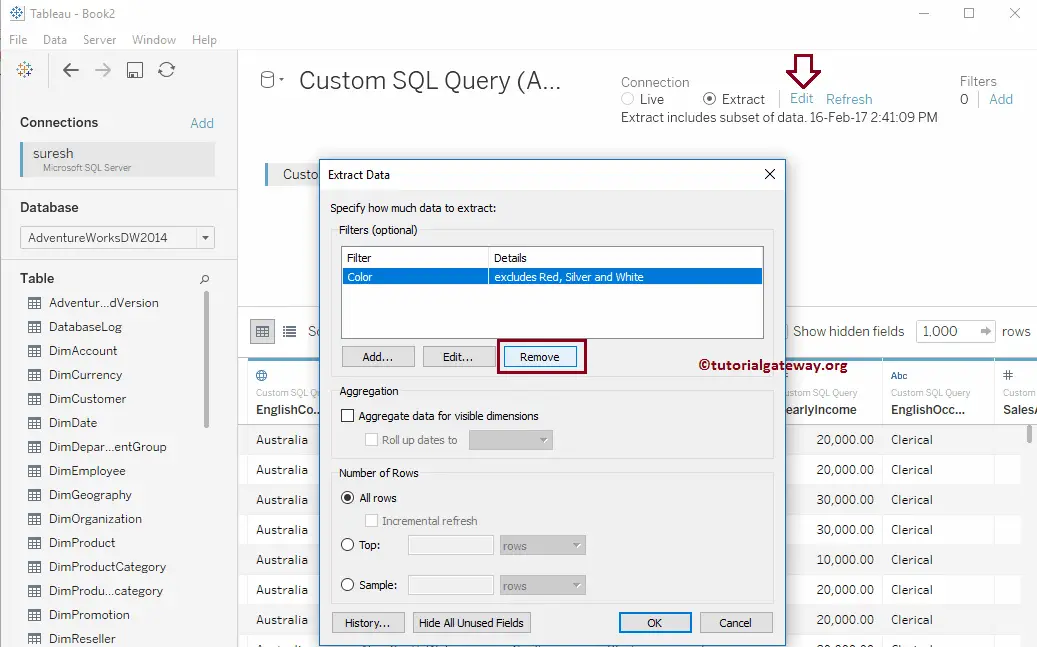
Tableau Extract Filters on Measures
Please select the Measure field from the list of available fields or Columns. From the screenshot below, you can see that we chose the Sales Amount Measure as our filter field.
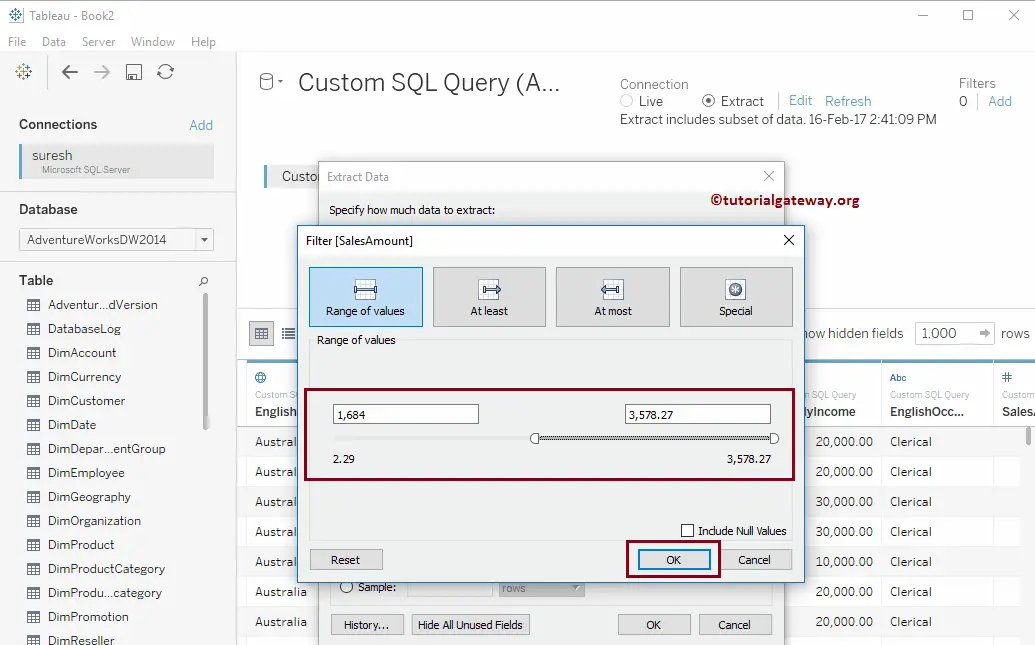
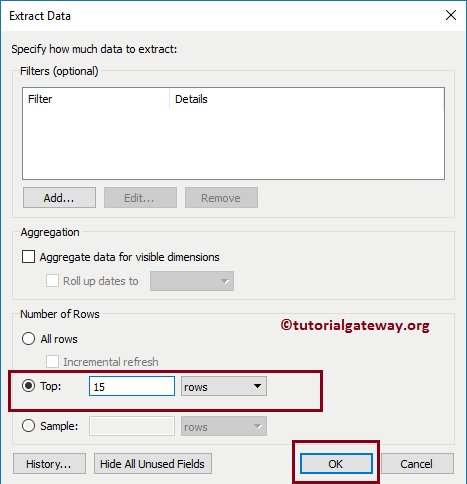
Once you select the Sales Amount Measure field, a new window called Filter will open to create the filter condition. For the purpose of demonstration, we are leaving the maximum value and changing the minimum value to 1,684. Next, Click OK to close the Extract Filters Data window.
I suggest you refer to the Filters on Measures article to understand the properties present in the following window.
Let us create one sample report to show whether our newly created extract filter is working or not. To do so, Drag and Drop the City from the Dimension Region to the Rows Shelf and the Sales Amount from the Measures region to the Columns Shelf.
For better understanding, we sorted the data in Ascending order based on the Sales Amount and added the Data Label to the Bar chart.
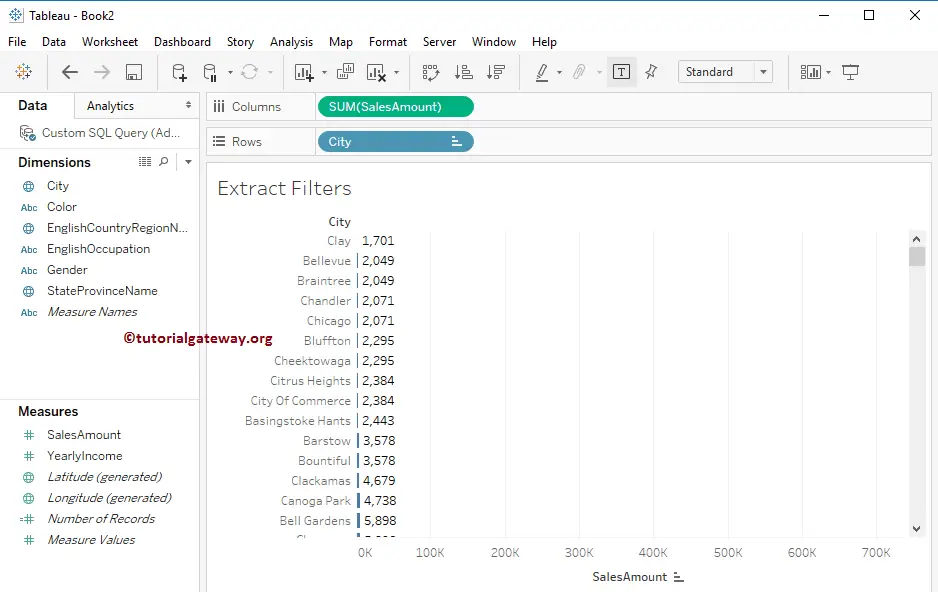
As you can see from the above screenshot, the Sales Amount of all the records is greater than 1,684
Top Filters
From the screenshot below, we are selecting the Top 15 Rows as the Tableau Extract filter condition.
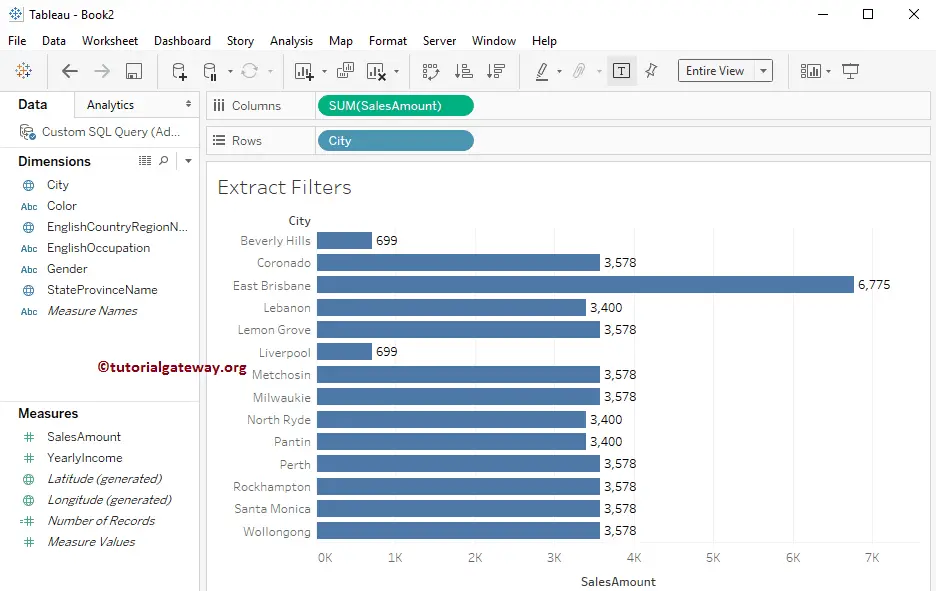
If you observe the data source, it will show 15 rows only because of Extract Filters. Let me create a sample report by dragging the City from the Dimension Region to the Rows Shelf and the Sales Amount from the Measures region to the Columns Shelf. As you see, it is showing 14 records because City East Brisbane is repeated twice in the first 15 rows.
Comments are closed.