Data Source Filters in Tableau are useful for creating Filters at the data Source Level. By this, we can polish the data before we start generating any report on this source. This article will show you how to create Data Source Filters with an example.
In this example, we want to demonstrate the steps involved in creating the data source filters in Tableau. To do this, go to the Data Source, drag and drop the tables, or create a Custom SQL Query to extract data from the database.
Before getting into Data Source Filters, I suggest you refer to Filters to understand the basic filter techniques. For this Tableau demo, we select the Dim Customer and Fact Internet Sales tables present in the Adventure Works DW database.
Create Data Source Filters in Tableau
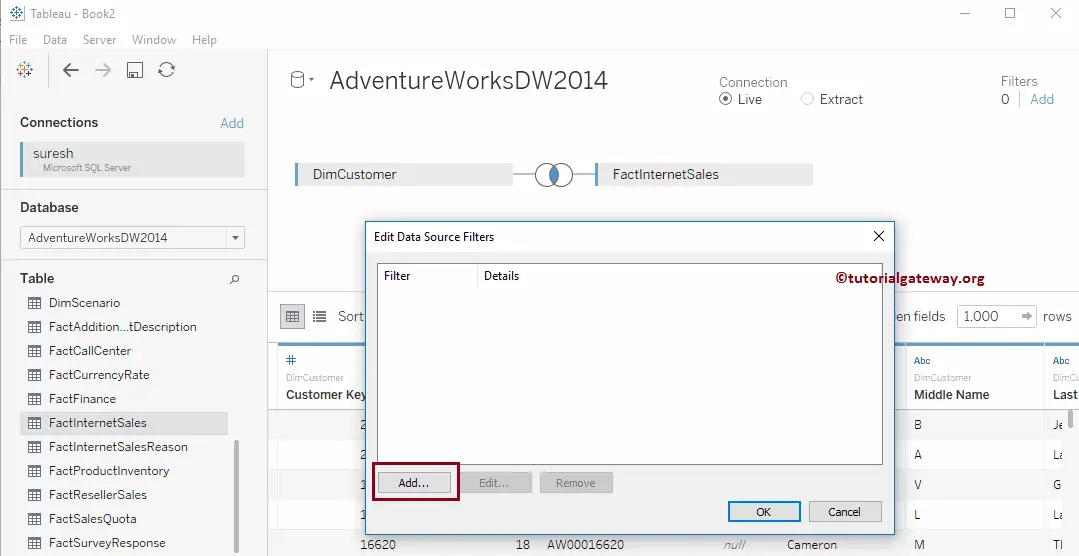
To create Data Source Filters, click on the Hyperlink ADD under the Filter section on the top right side corner. Once you click on ADD, a new window called Edit Data Source Filters will open. To create our first data source filter, click on the Add button.
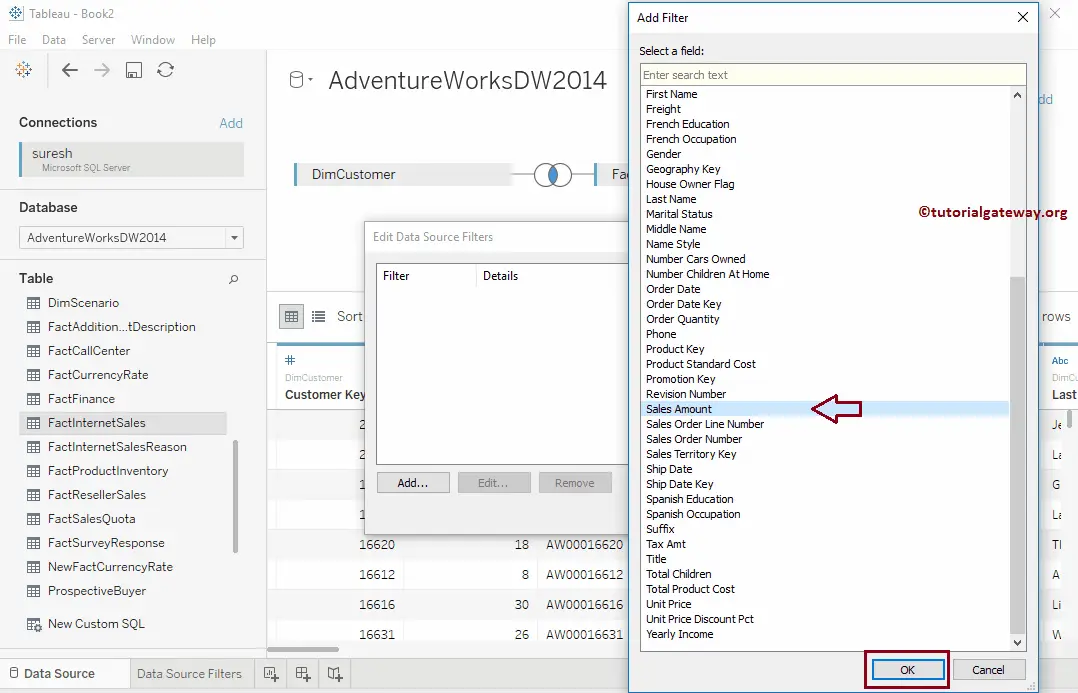
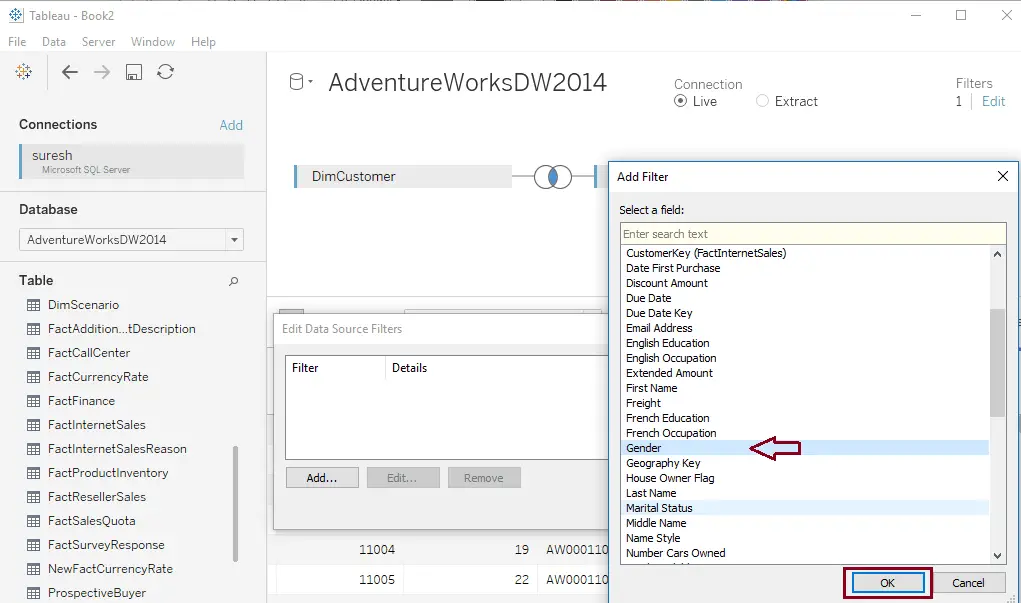
Once you click on the Add.., a new window called Add Filter will be opened, and it contains a list of all the Columns available in the Tables.
Tableau Data Source Filters on Measures
Please select the Measure field from the available fields (or Columns) list. From the screenshot below, you can see that we are choosing the Sales Amount Measure as our field.
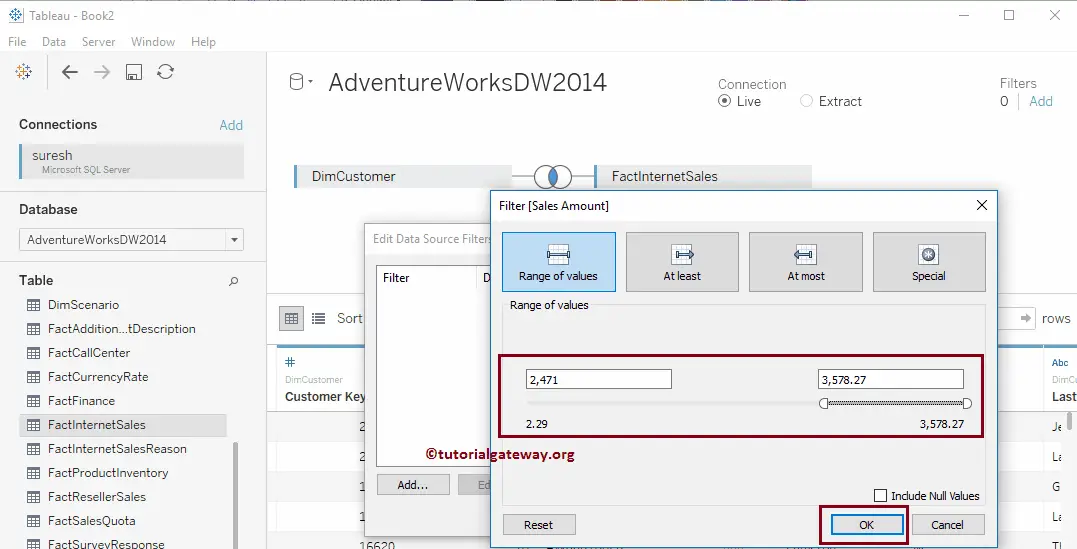
Once you select the Measure field (i.e., Sales Amount), a new window will be opened to create the condition to format.
For demonstration purposes, we are leaving the maximum value and changing the minimum value to 2,471. I suggest you refer to the Filters on Measures article to understand each property present in the following window.
Within the Tableau data source window, you will see the 1 under the Filter Section. Let us create one sample report to show whether our newly created one is working or not.
To do so, drag and drop the First Name present in the Dimension Region to the Rows Shelf and Sales Amount Measures region to the Columns Shelf. By default, the tableau will generate the Bar Chart. For better understanding, we sorted the records in ascending order based on the Sales Amount and added the Label to the Bar chart.
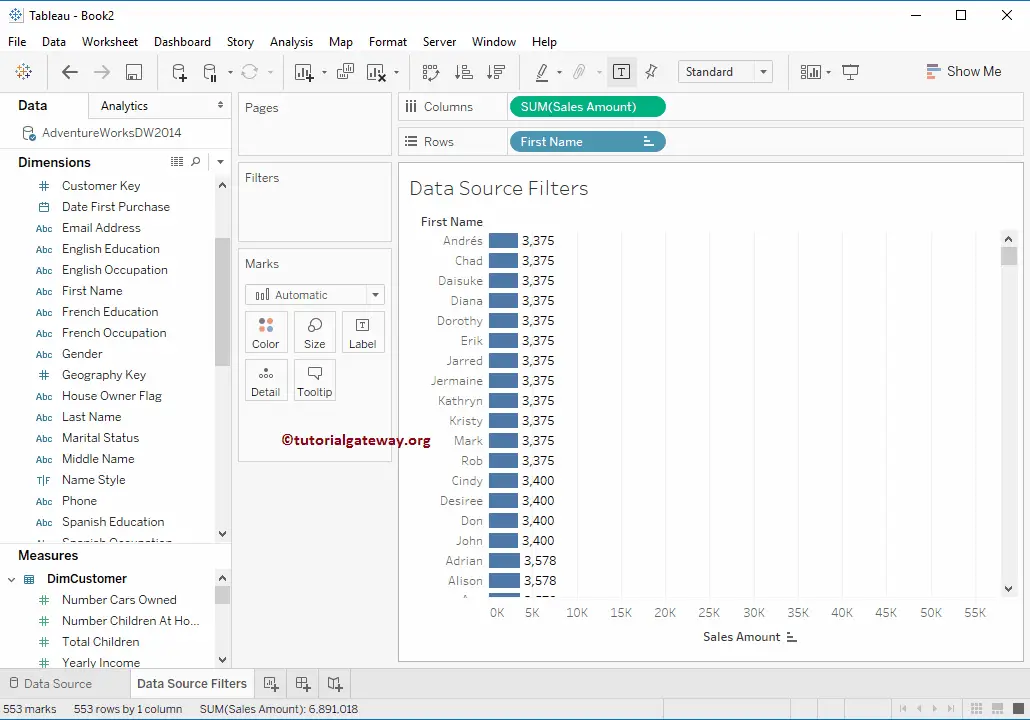
As you can see from the above screenshot, the Sales Amount of all the records is greater than 2,471
Remove Data Source Filters in Tableau
It is easy to remove the data source filters. To do so,
- Go to the Data Source section and click on the Edit Hyperlink.
- It opens the list of available sources.
- Please select the required option and click on the Remove button.
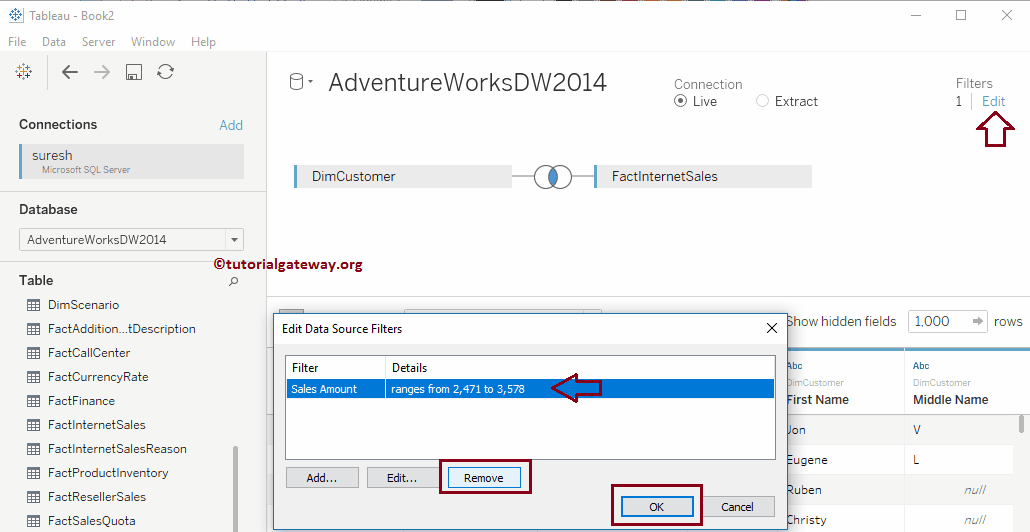
Tableau Data Source Filters on Dimensions
Please select the Dimension field from the list of available fields or Columns. From the screenshot below, you can observe that we are choosing the Gender Dimension as our field.
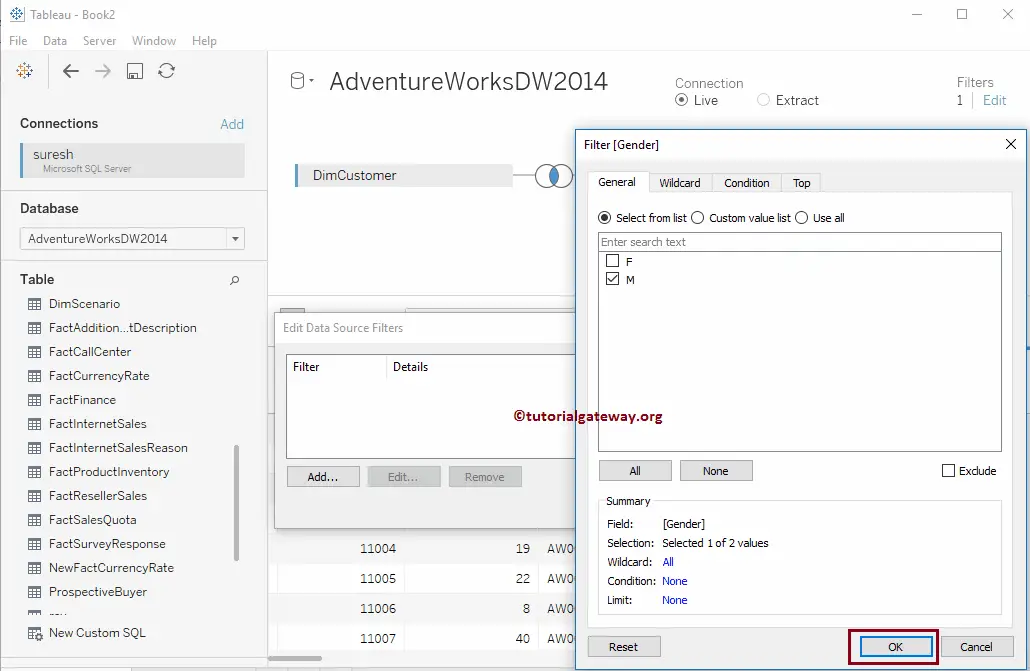
Once you select the Dimension field (i.e., Gender), a new window will be opened, as shown below. Here, we select M, meaning the data source will extract the records whose gender is Male. I suggest you refer to the Filters on Dimensions article to understand the properties in the following window.
Drag and drop the English Occupation, gender present in the Dimension Region to Rows Shelf, and Sales Amount Measures region to Columns Shelf. By default, the tableau will generate the Bar Chart. As you can see, our report displays the Male fields because we applied to the Female Gender.
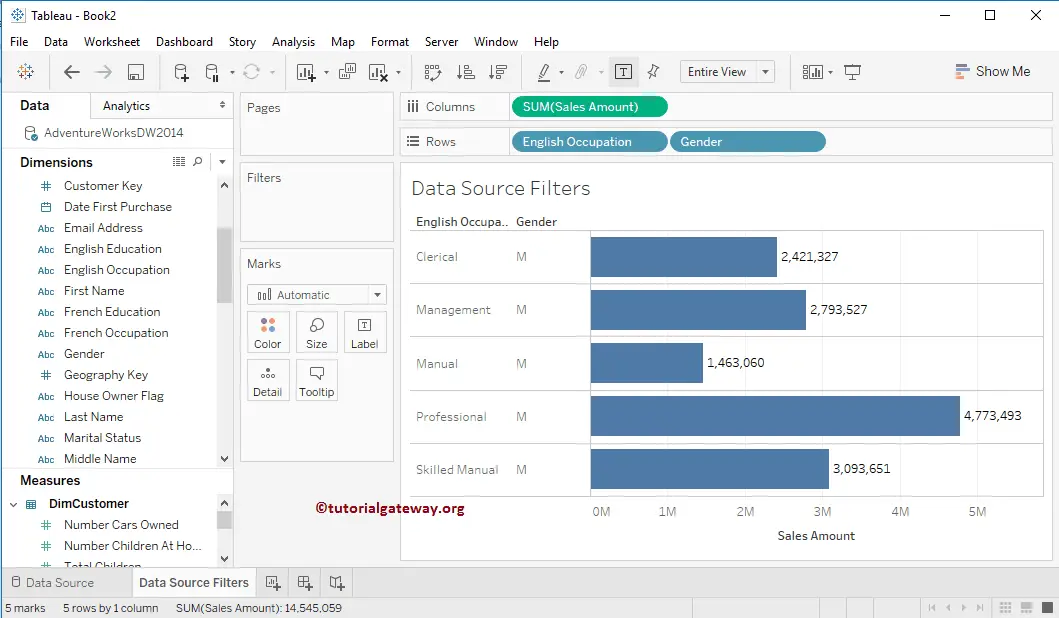
If you remove the Tableau Data Source Filter on Gender, you can see the records that belong to both females and Males. Where each Occupation will be subdivided by Male and Female genders. The following is the list of remaining filters.