In this article, we will show you how to create Tableau filters on Measures with an example.
Before getting into this, I suggest you refer to the Filters to understand the basic filter techniques. For this Tableau Filters on Measures demonstration, we will use the data source we created in our previous article. So, please visit the Data Labels in Reports article to understand the Tableau Data Source.
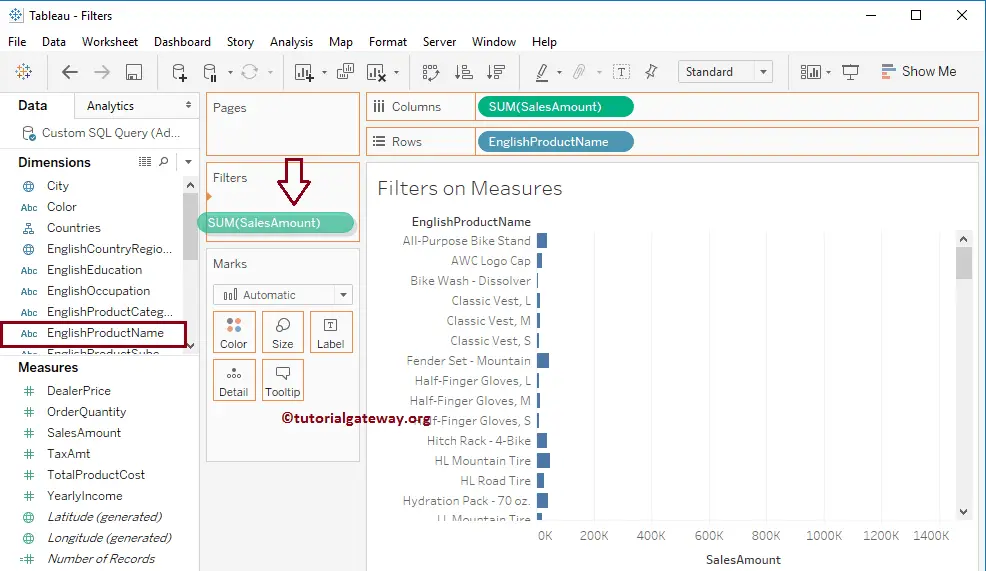
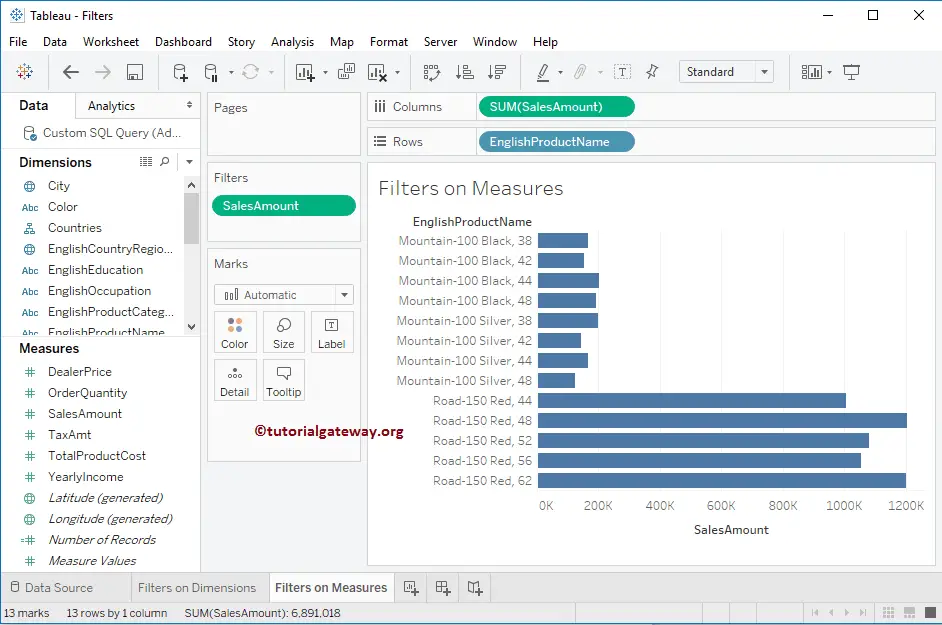
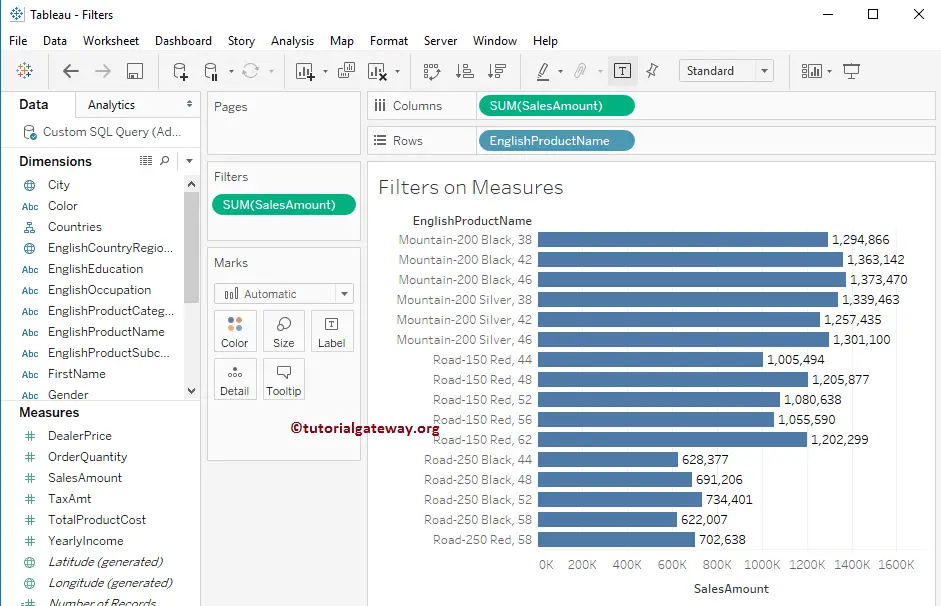
For this Tableau Filters on Measures example, first, drag and drop the English Product Name from the Dimension Region to the Rows Shelf and the Sales Amount Measures region to the Columns Shelf. By default, it will generate the Bar Chart. Remember that we have 130 Marks in our Report. The screenshot below will show you the report preview.
Tableau Filters on Measures
In this Filters on Measures example, we will add a filter condition on the Sales Amount. So, please drag and drop the Sales Amount from the Measures Region to the Filters Shelf.
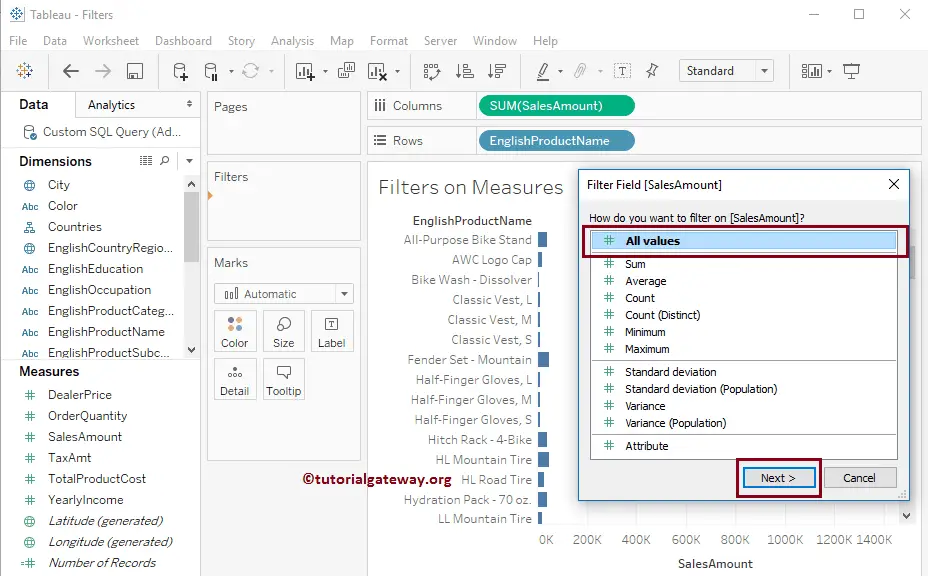
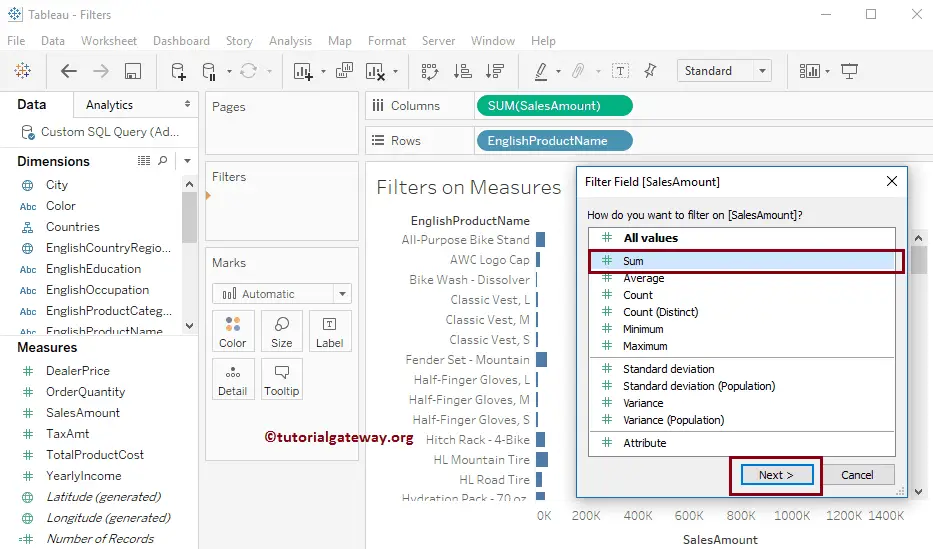
Once you drop the Sales Amount into the Filters Shelf, a new Filter Filed window will open. This window has the All Values option, aggregate functions, standard deviation, and variance.
In this example, we will show you what will happen if we select the All values or Aggregate function. First, we will choose the All Values option and click the Next button.
TIP: Here, All Values mean filter conditions will apply to individual records. If we select the Aggregate function (Sum, Average, etc.), the filter condition will apply to the aggregate value.
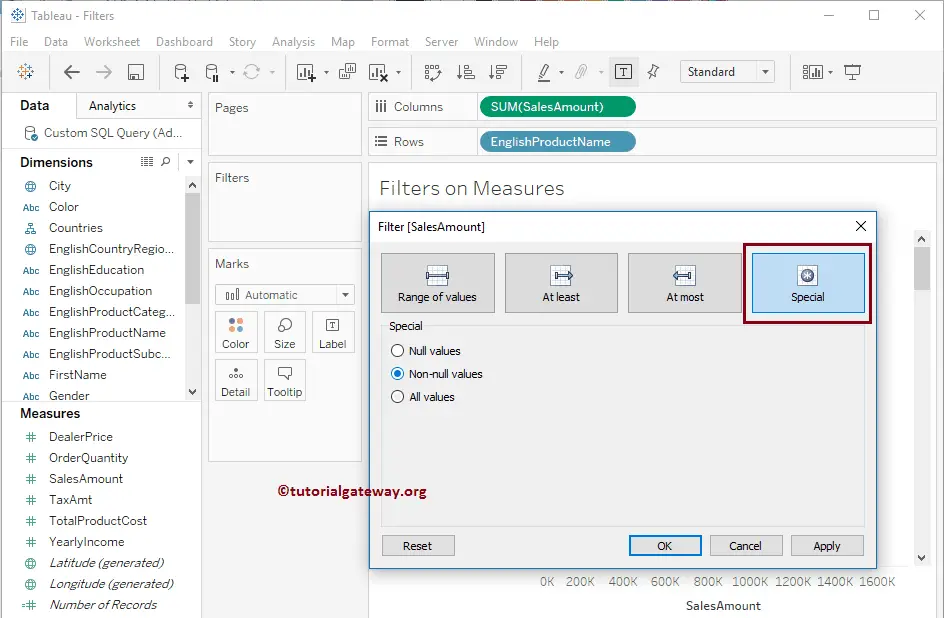
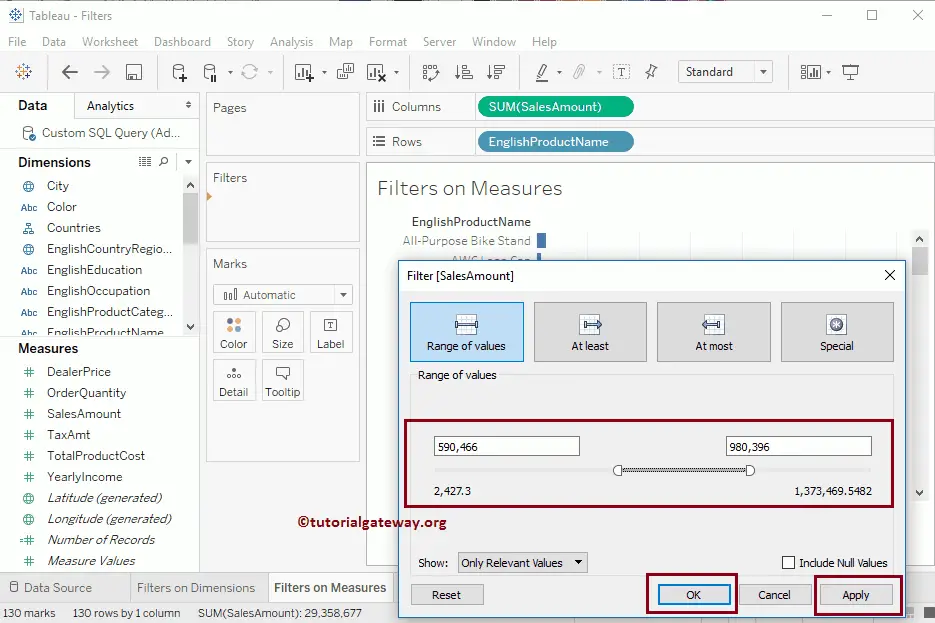
Once you click on the Next button, a new window called Filter will be opened to select the filter condition. From the screenshot below, you can observe that this window has four tabs: Range of Values, At least, At most, and Special. In this example, we will explain the first tabs, and the remaining three will be explained in the following case.
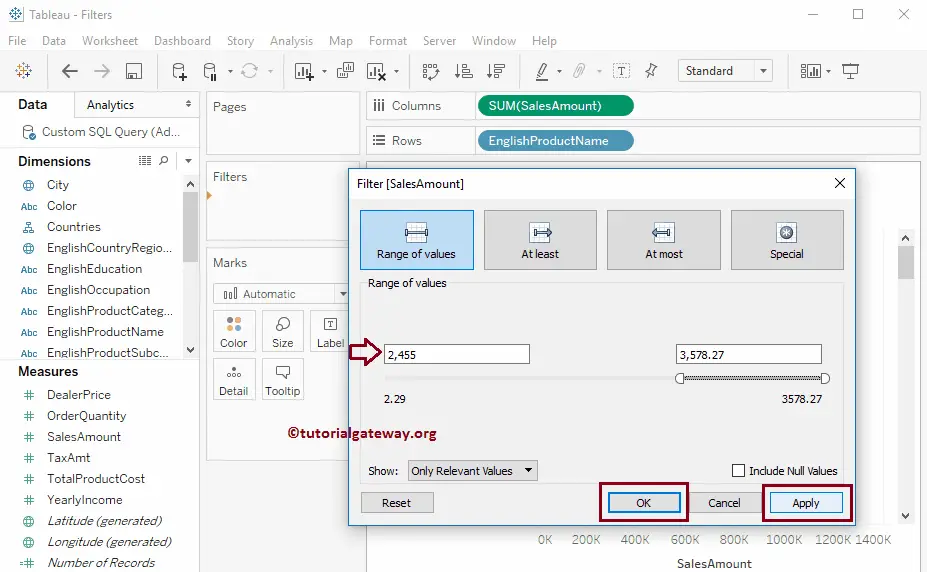
Range of Values
This tab of Filters on Measures contains two text boxes. The first one is to select the minimum value, and the second is to write the maximum value. So, you write the value as per your requirement using those text boxes. Or use the range bar and drag it to an appropriate point.
For this Tableau Filters on Measures demo, we are leaving the maximum value as it is and changing the minimum value to 2,455
From the below screenshot, you can see the Filtered bar chart.
Let me change the Filter Filed from All values to Sum
Now you can see that the filter window shows the aggregated values as the range values. For this demo, we changed the minimum value to 590, 466, and the maximum value to 980,396
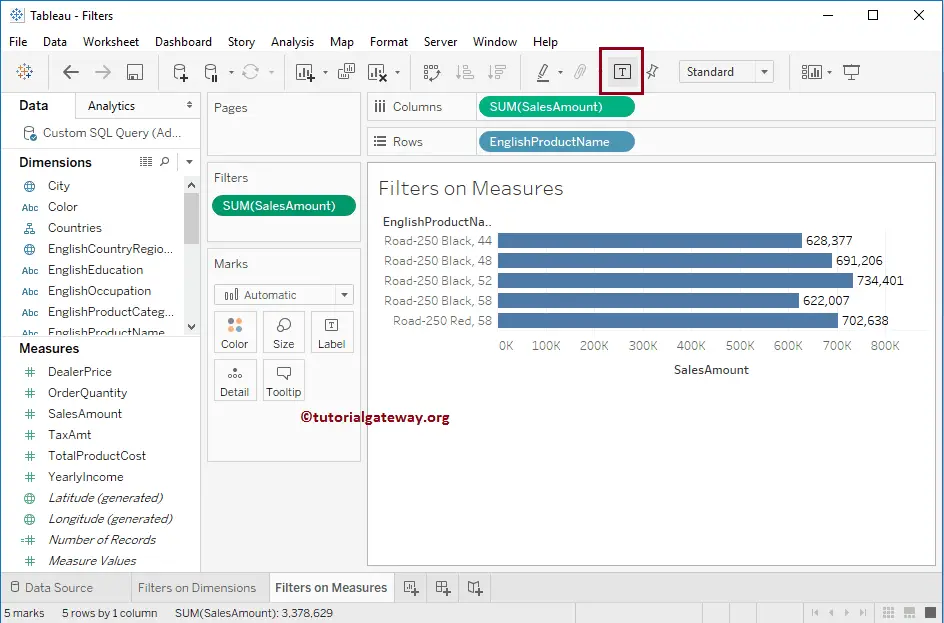
Now you can see that the report displays the products whose sum of sales amount is between 590,466 and 980,396. For better understanding, we added the Data Label to the Bar chart.
Second Approach to Creating Tableau Filters on Measures
In this Filters on Measures example, we will add a filter condition from the Column Shelf. First, please click on the down arrow beside the Sales Amount present in the Column Shelf, which will open the menu. Here, you have to select the Filter.. option.
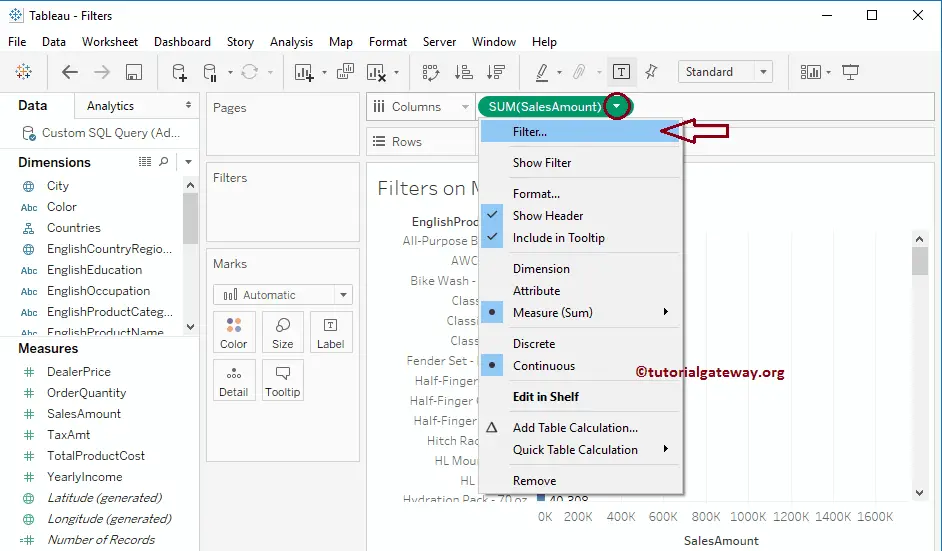
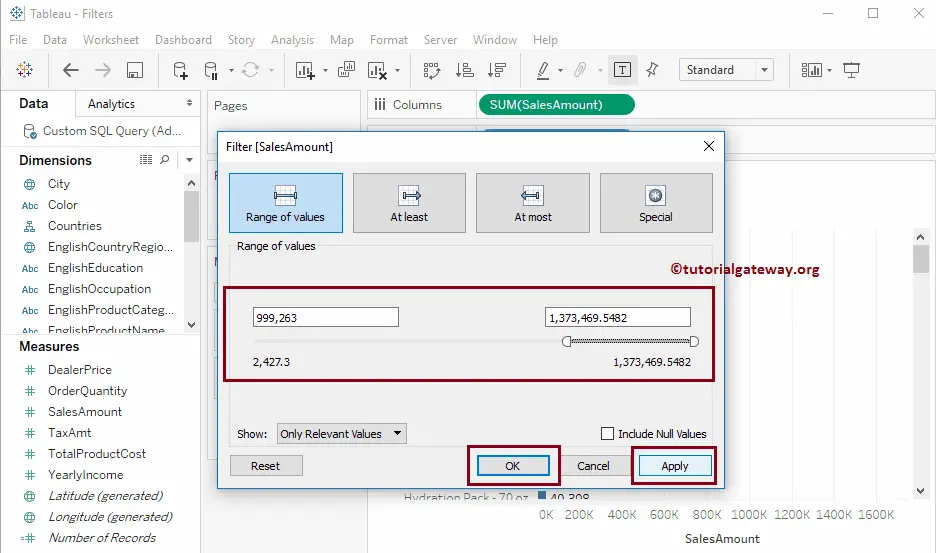
Once you select the Filter.. option, a new window is opened to create a filter. We already explained the functionality in our previous example. So, let me change the minimum value to 999, 263. Next, click OK to apply the changes and to close the window.
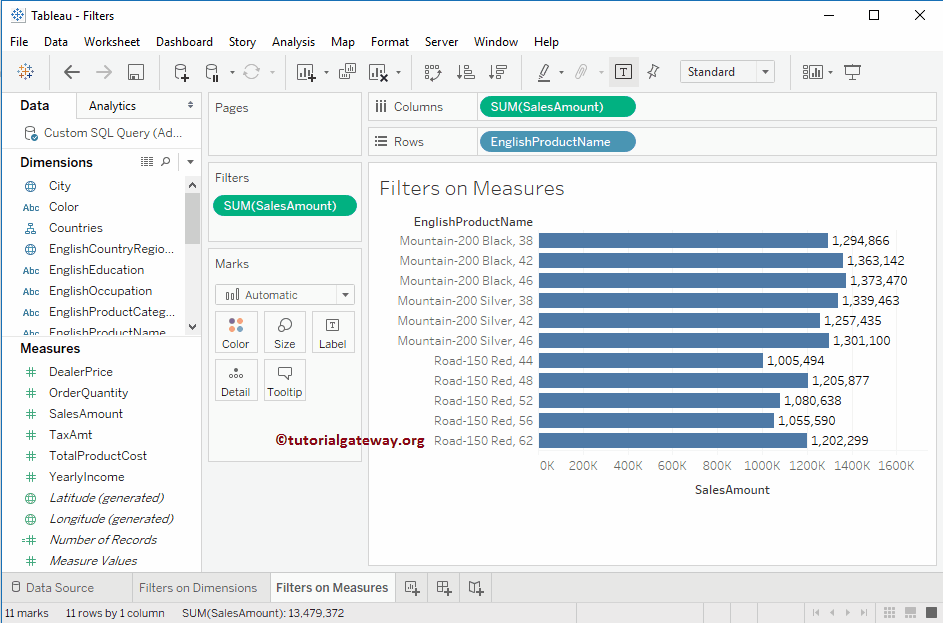
Now you can see the filters applied bar chart. The best part is that the Sales Amount Measure appeared on the filter shelf.
At Least
This tab allows you to choose the minimum value only. For the Tableau Filters on Measures demo purpose, we are changing the value to 499,273
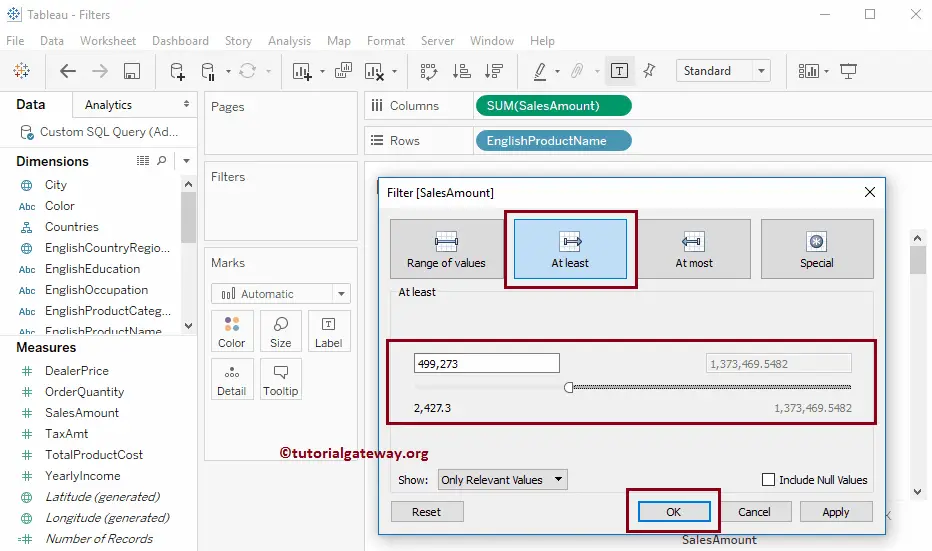
Now you can see that the report is displaying the products whose sum of the sales amount is at least 499,273.
At Most
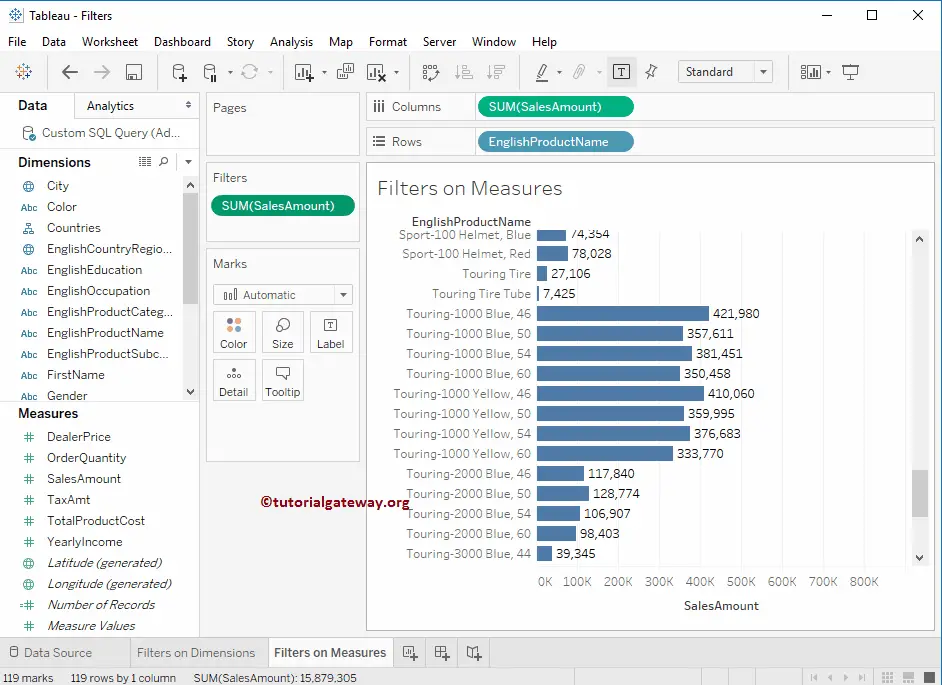
This Tableau Filters on Measures tab allows you to choose the maximum value only. For demo purposes, we are changing the value to 1,000,469
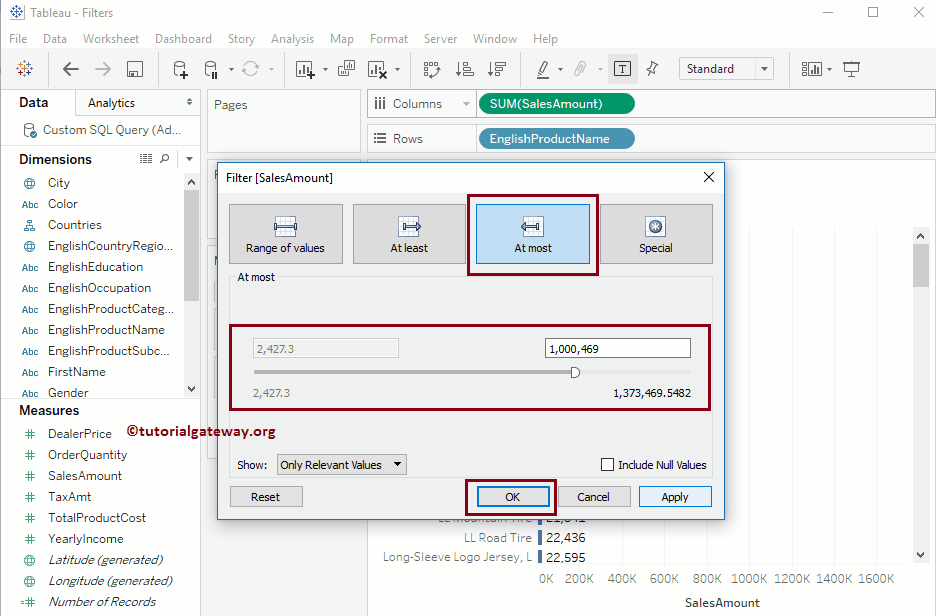
Now you can see that the report is displaying the products whose sum of the sales amount is at most 1,000,469
Special
This Tableau Filters on Measures tab has three options: Null, Non-null, and All Values. Select as per your requirements.