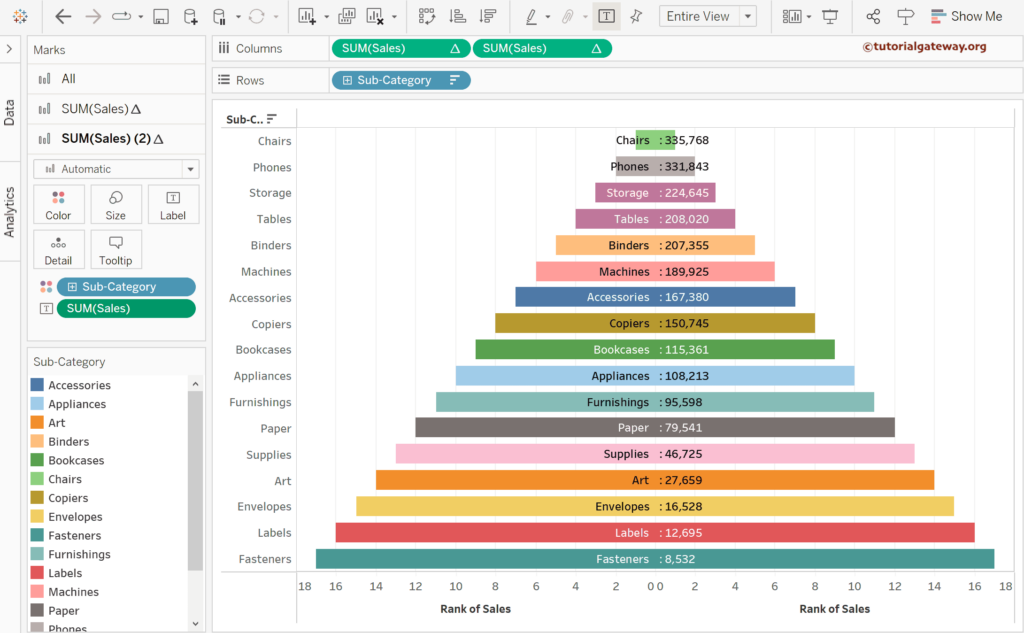
The Tableau Pyramid Chart is a triangle divided into different layers or sections (steps). Each section is a dimension, and its size depends on the measured value. For instance, a Product subcategory can be a layer, and its sales decide the size of that section.
This article shows how to create a Tableau Pyramid Chart using the Running Total and Rank Table calculations with Dual axis options with a simple example.
We used the Sample Superstore Excel source to demonstrate the Tableau Pyramid Chart. Please visit the Excel Source article to understand the Data Source.
How do you create a pyramid chart in Tableau?
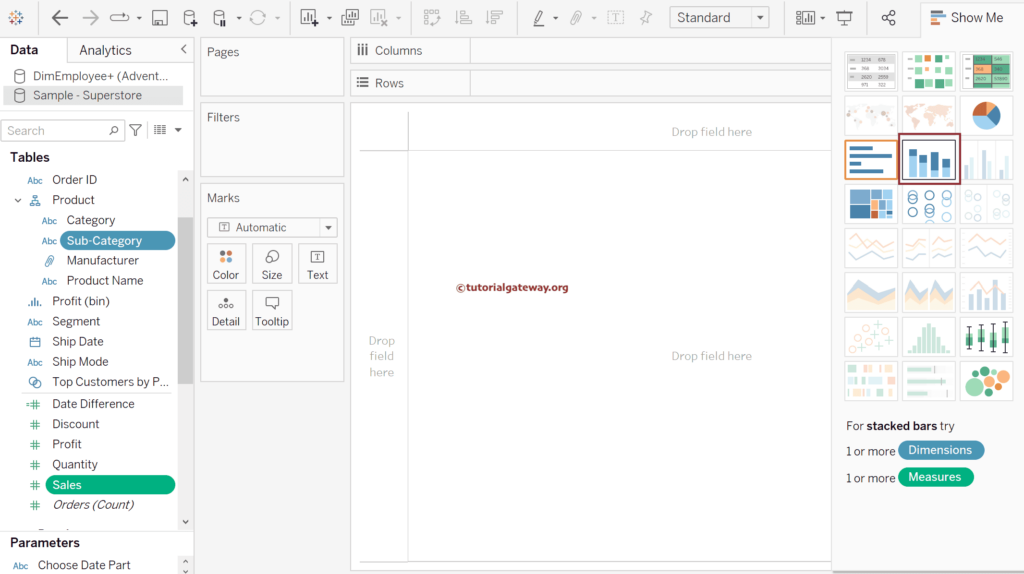
There are multiple ways of creating a Pyramid Chart; we only need one Measure and one dimension. The first approach is to select Sub-Category and Sales and choose the Stacked Bar Chart from the Show Me window.
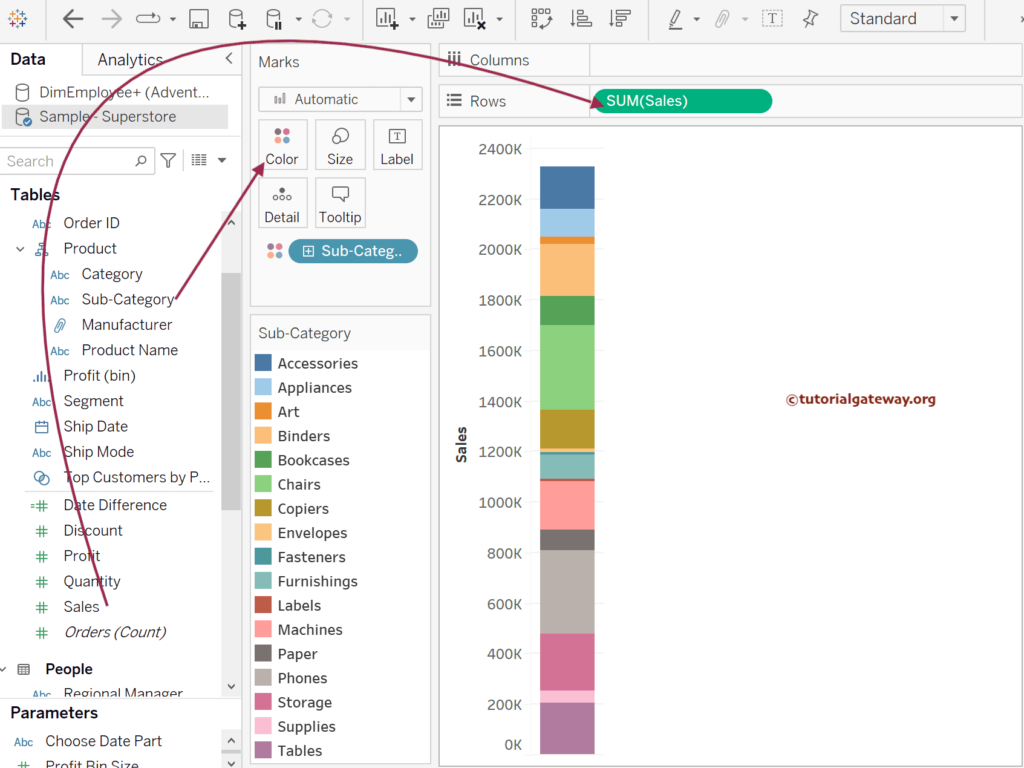
The second approach is to drag and drop the Sales Measure to the Rows shelf and the Sub-Category dimension to the Color Shelf. By default, the desktop automatically creates a Stacked Bar Chart. For the remaining charts in Tableau, please click here.
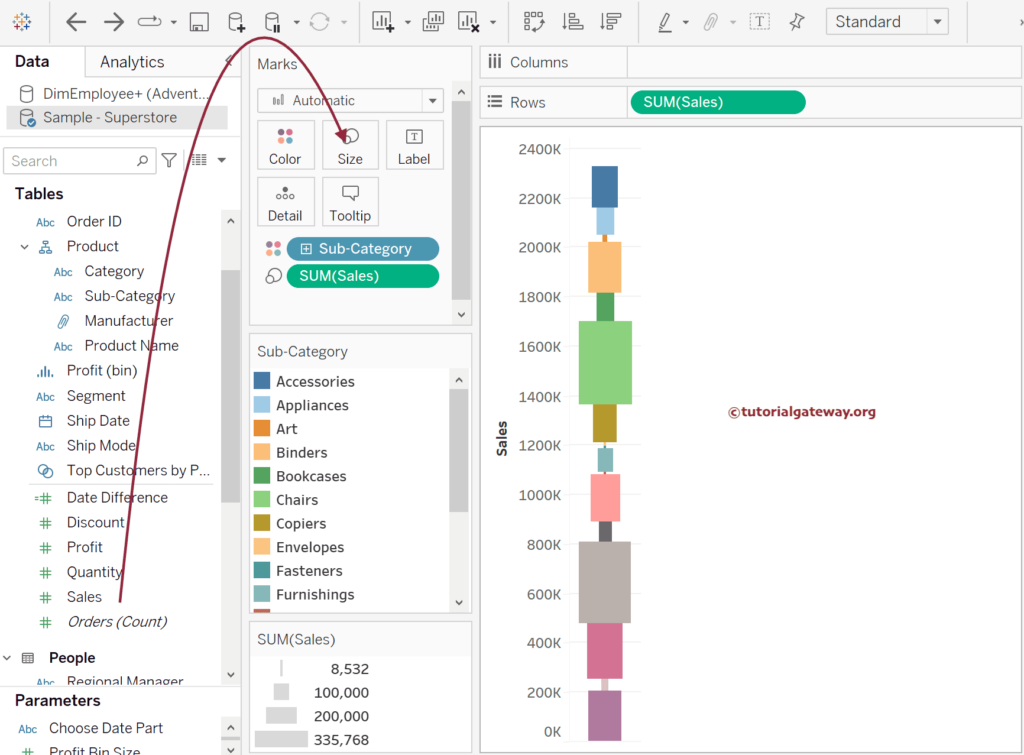
To convert the Stacked Bar Chart to the Tableau Pyramid Chart, drag and drop the Sales to the Size shelf.
Next, sort them using the Sub-category based on the sum of sales.
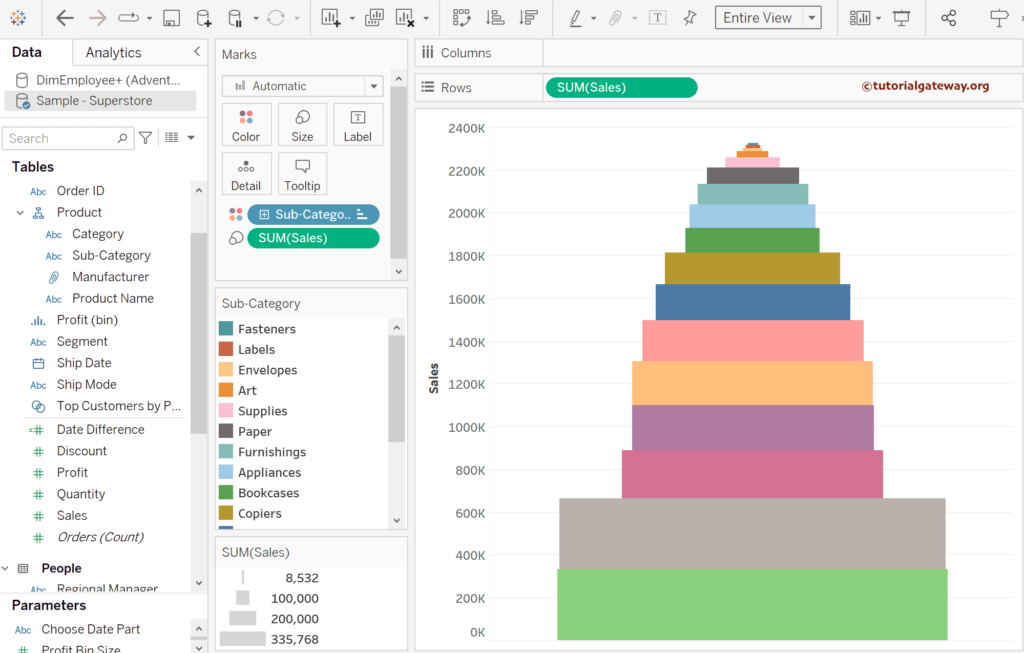
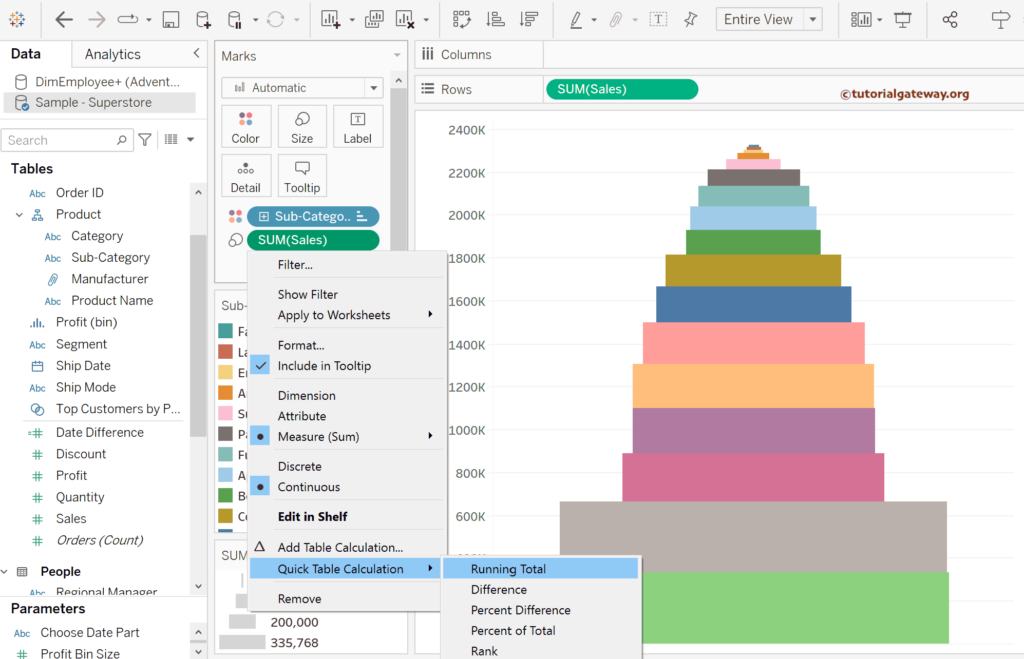
Although it looks like a Tableau pyramid chart, the finishing differs from what we expected. So, within the Marks shelf, click the down arrow beside the SUM(Sales) and select the Quick Table Calculation option from the context menu. Next, choose the Running Total.
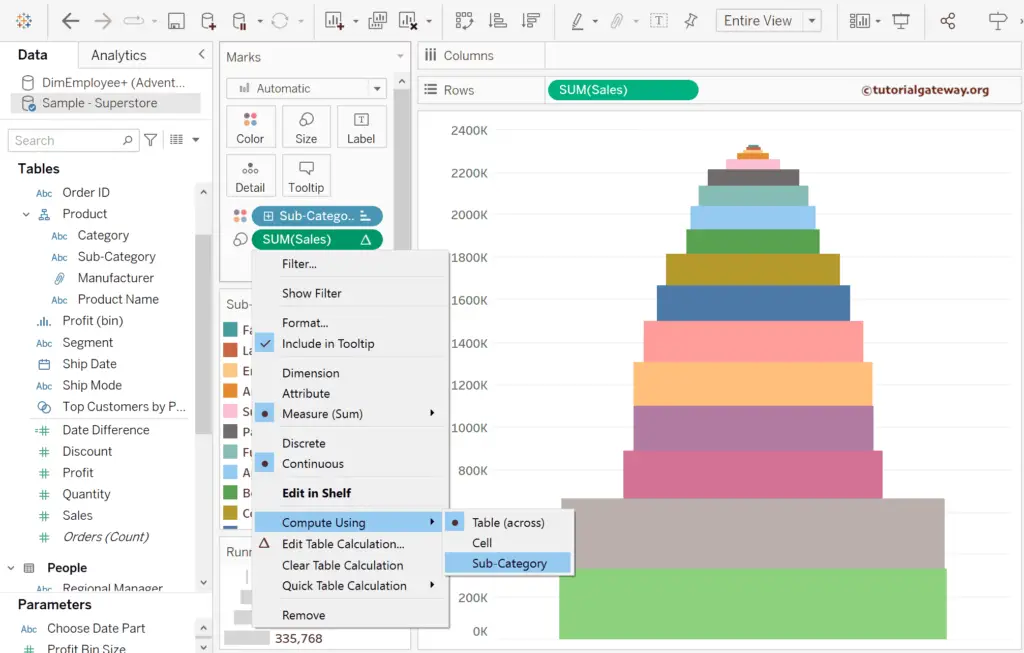
Again, click the down arrow beside the SUM(Sales) table calculation and change the Compute using from default Table(across) to the Sub-Category.
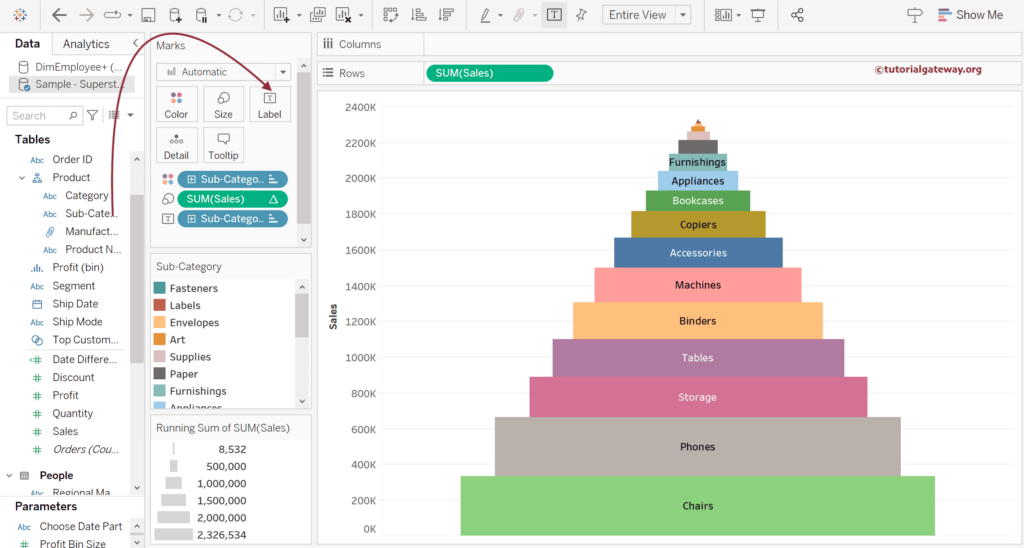
Please add the Sub-Category to the Label shelf to see the Pyramid chart. Use the Format menu option to Set the Column Divider Level to 0.
The second approach to create a Tableau Pyramid chart
Drag and drop the Sub-Category dimension to the Rows Shelf and the Sales Measure to the Columns shelf. Next, use the toolbar to sort the bar chart in descending order.
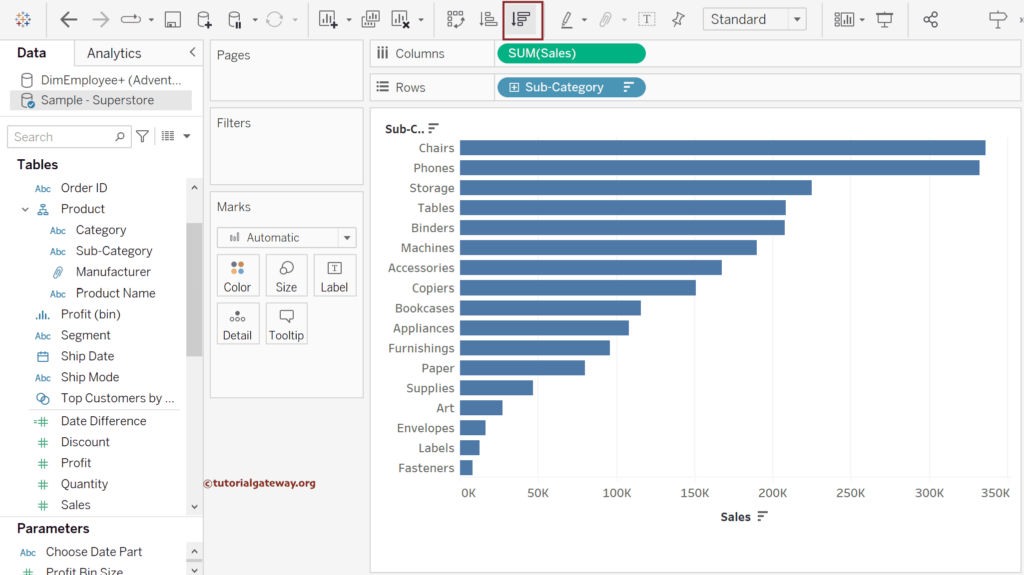
Click the down arrow beside the SUM(Sales) in the Columns shelf, select the Quick Table Calculation, and choose the Rank option.
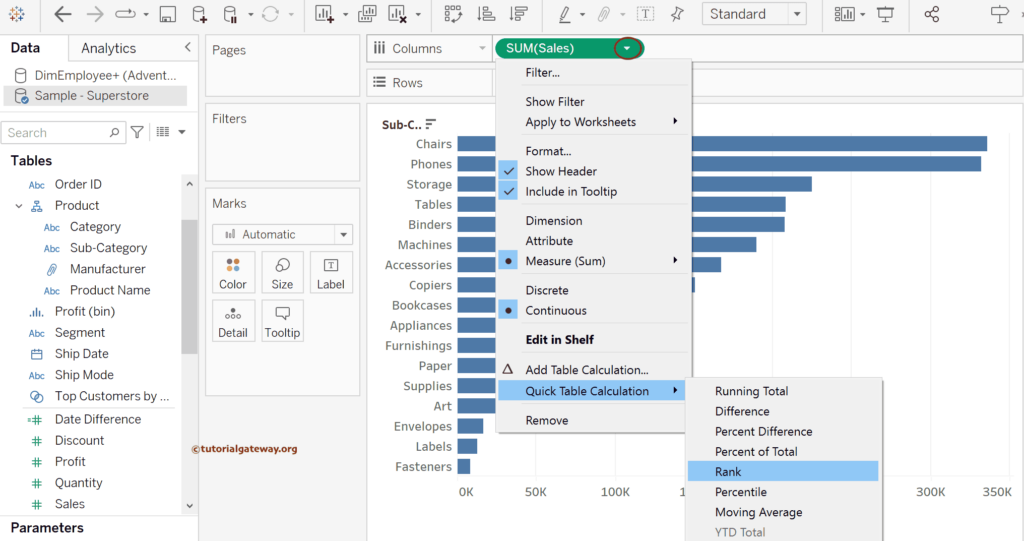
As you can see from the screenshot below, the table calculation provided ranks based on the sales of the sub-categories. To create a Tableau pyramid chart, right-click the Rank of Sales (X-Axis) and choose the Edit Axis option.
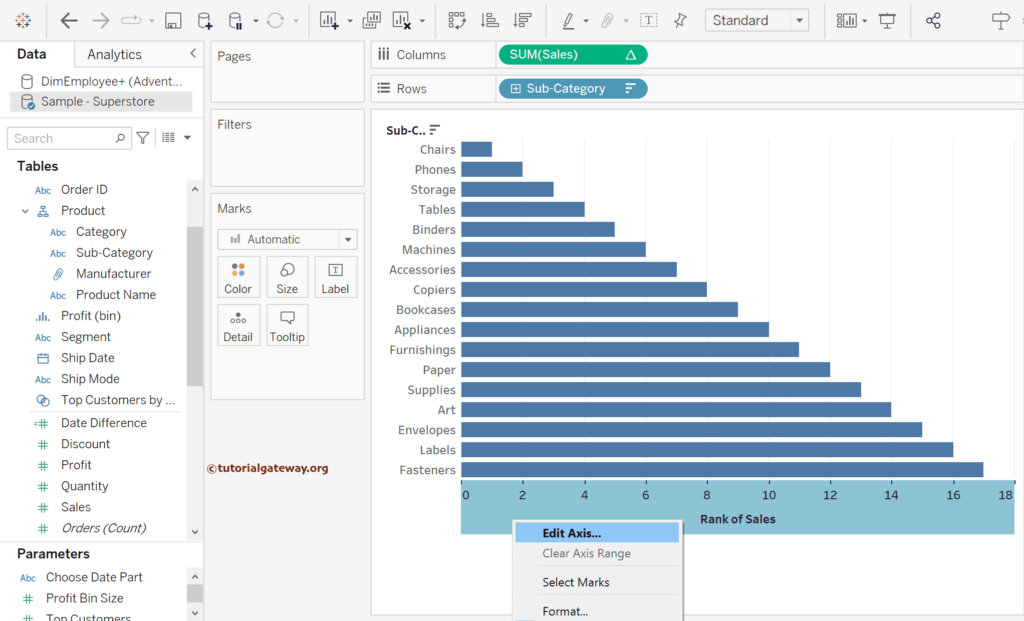
Please change the Scale to Reversed.
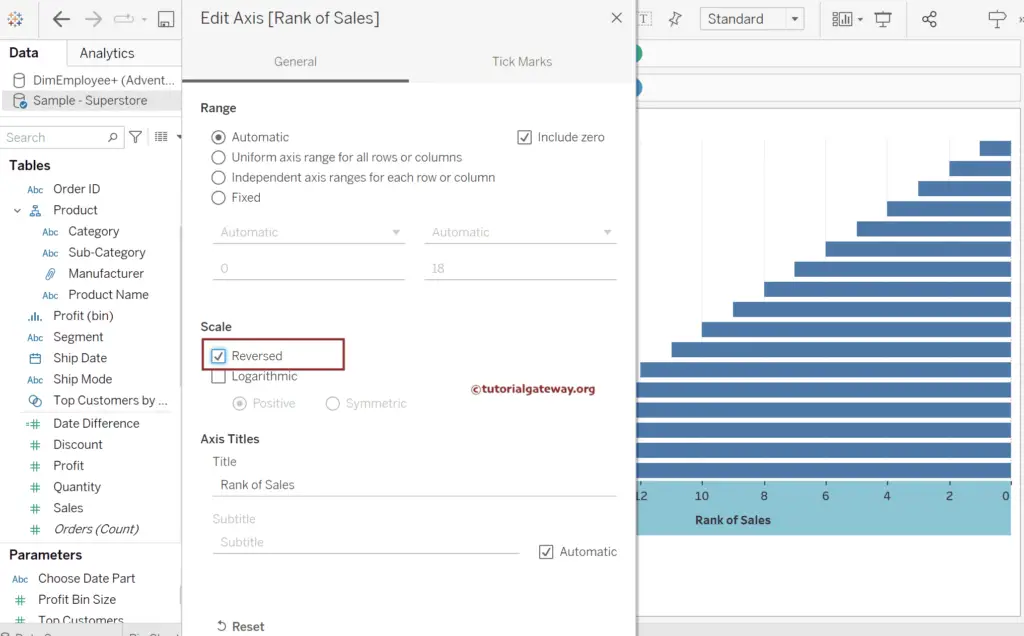
Next, again, use the control or command button to add the SUM(Sales) table calculation to the columns shelf.
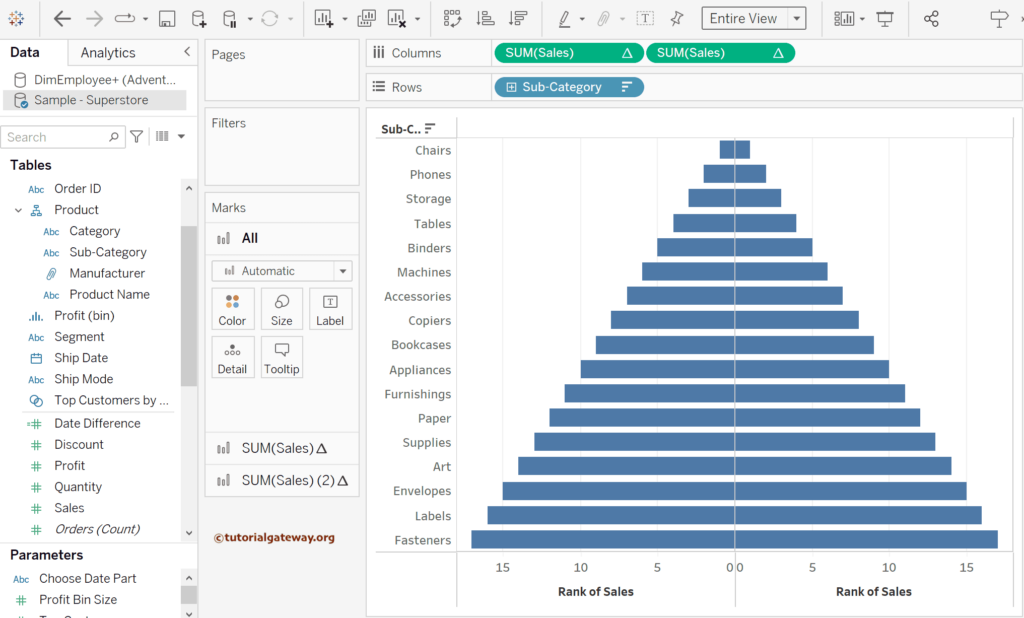
Please add the Sub-Category dimension to the Label shelf of the first SUM(Sales) marks and Sales measure the Label Shelf of SUM(Sales)(2)mark. Next, adjust the alignments of the text.
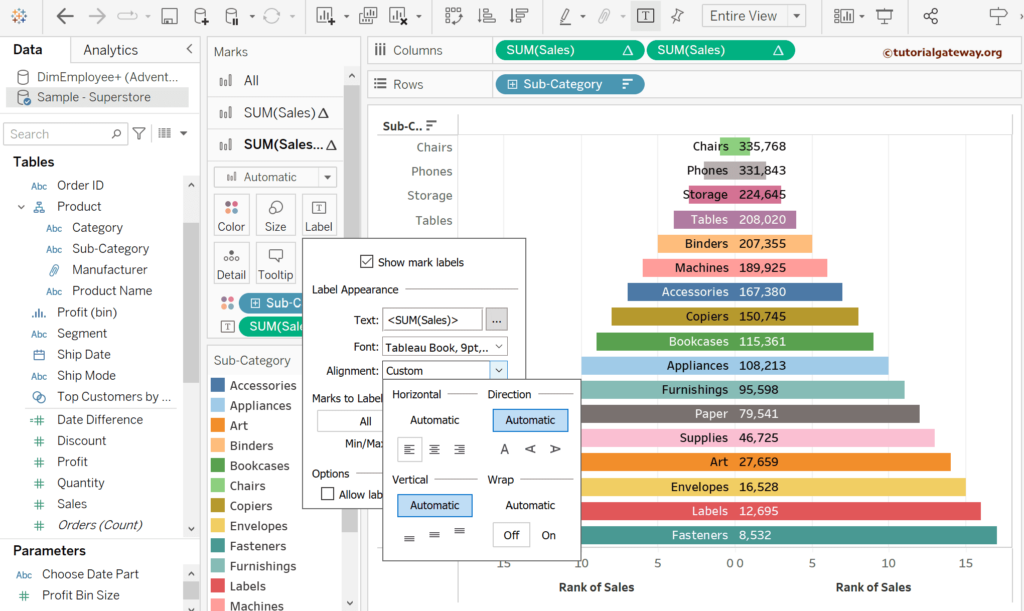
The below screenshot shows the final result of the Tableau Pyramid Chart.
