In our previous article, we showed you the basic approach to calculating rank in Tableau. This article will show you how to calculate Tableau Rank using the table calculation with an example.
For this Tableau rank calculation, we are going to use the Employee table present in the SQL Server. I suggest you refer to Connecting to SQL Server and rank articles to understand the configurations. The following screenshot will show you the data inside the Tableau Table, and as you can see, it has 14 records:
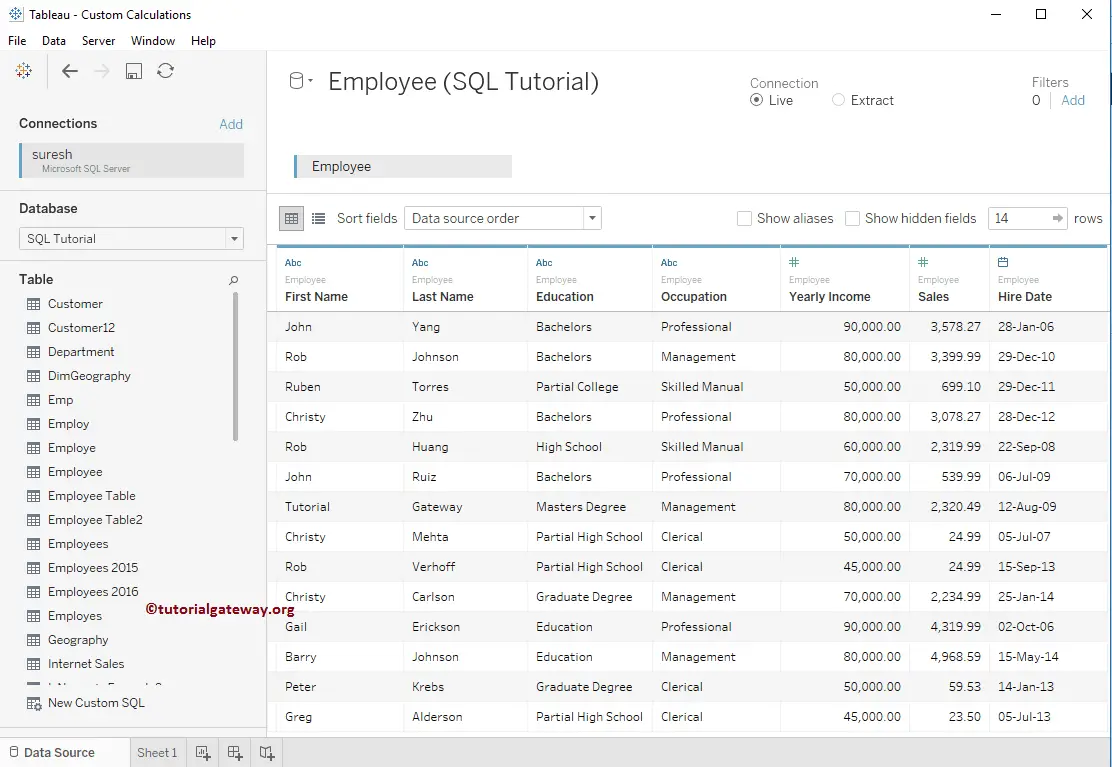
Tableau Rank Calculation Advanced
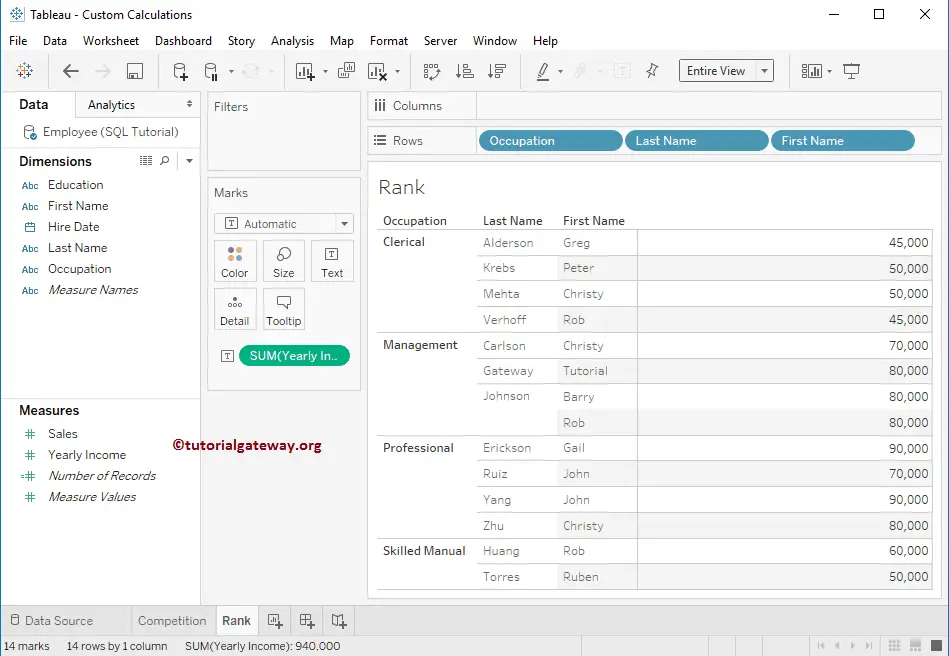
In this example, we will show you the advanced approach to calculating the tableau rank. For this Tableau Rank calculation, we will drag and Drop the Occupation, Last Name, and First Name from the Dimensions Region to the Rows Shelf. Next, drag the Yearly Income from the Measures region to the Text field present in the Marks Shelf.
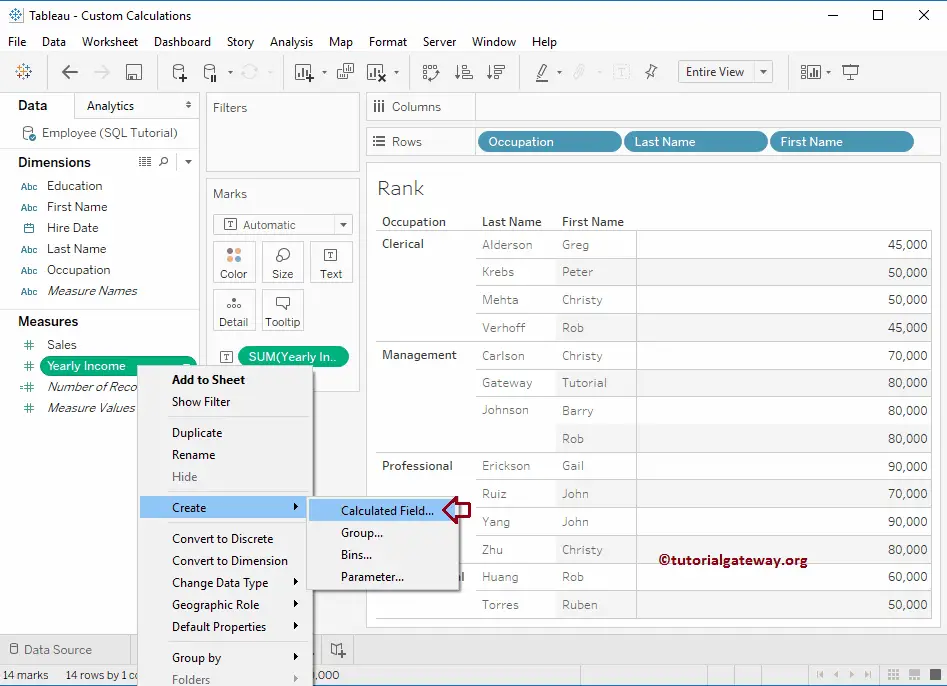
To assign the Tableau Ranks, we have to add the table calculation. To do so, click on the Down arrow beside the Yearly Income measure (change as needed). Right-click on it will open the context menu. Please select the Create option and then the Calculated Field… option from the list of available options.
Once you click on the Calculated Field… option, a new window will be opened to write the calculation.
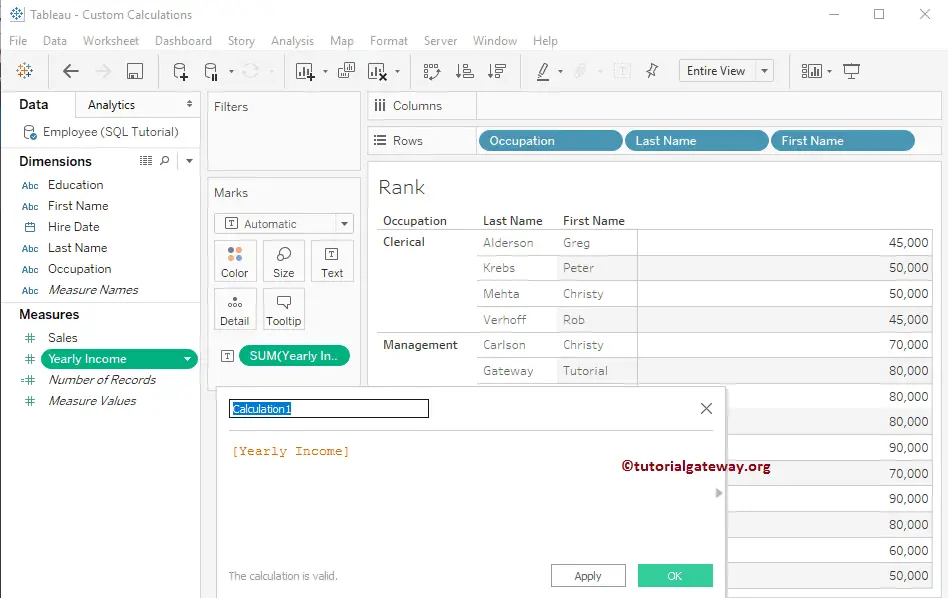
Tableau RANK Function
In this example, we will calculate the rank using the Tableau RANK function. The Rank function in Tableau accepts two arguments: aggregated measure (or an expression) and ranking order (ascending or descending). Here, the second argument is optional, and by default, it is assigned as DESC (descending).
The Tableau Rank Function will assign the same rank to an identical value. For example, if we have 100, 200, 200, and 400, the function will return the ranks as 1, 2, 2, 4 in ascending order.
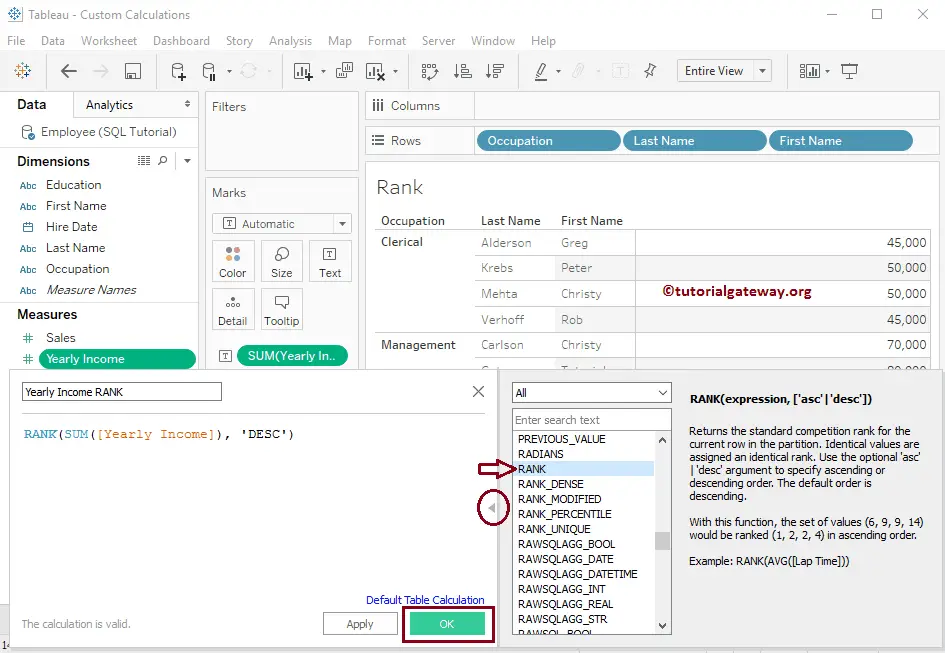
TIP: Click on the arrow that we rounded to show or hide the existing function. You can search for the required function and then check its syntax by selecting one.
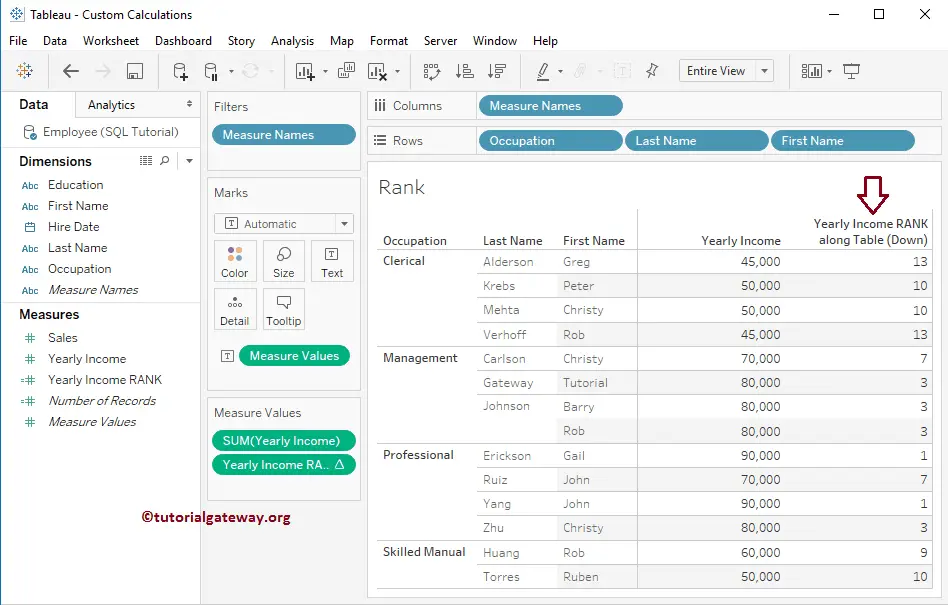
Once you click on the OK button, it will assign the ranks for each record based on the Yearly Income values.
Edit Tableau Rank Function
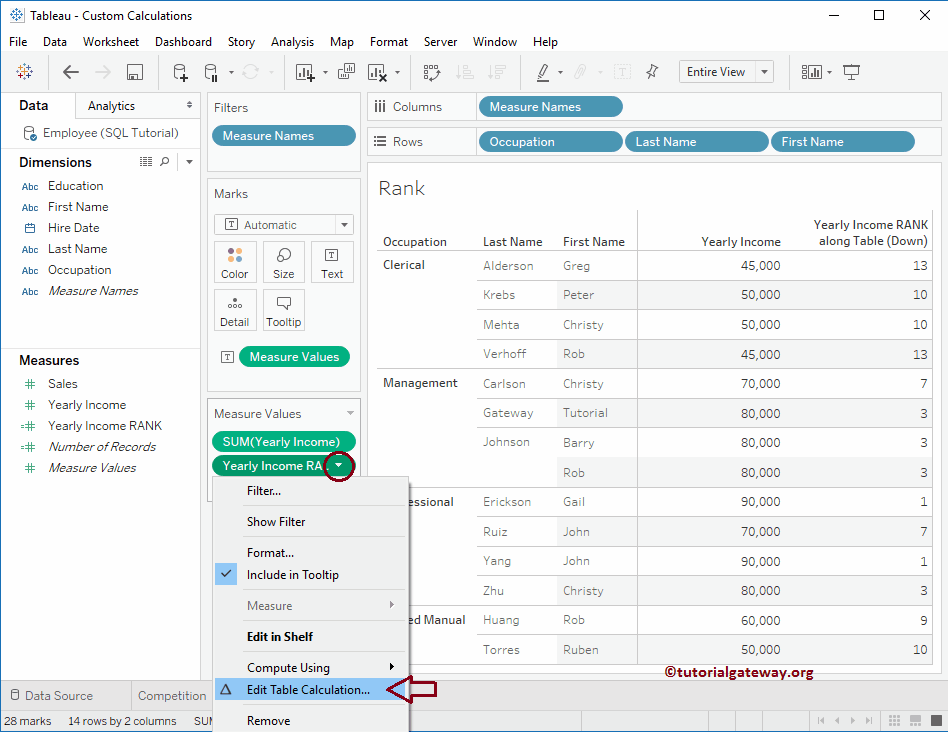
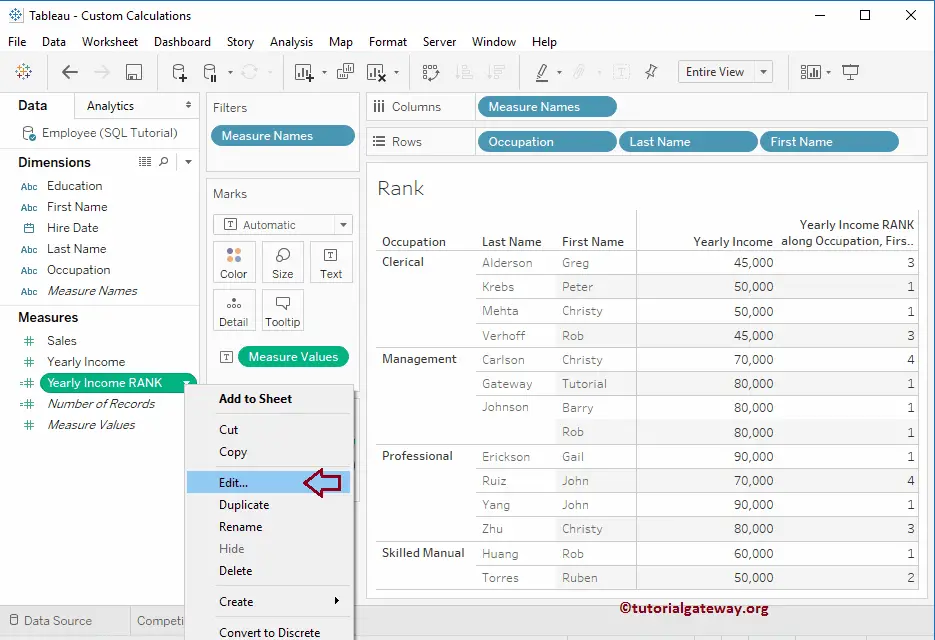
To edit the existing table calculation, please click on the down arrow beside the table calculation, which will open the context menu. Here, you have to select the Edit Table Calculation option.
Once you click on the Edit Table Calculation option, a new window called Table Calculation will open. As you can see, it has default selected the Compute using option as Table (down).
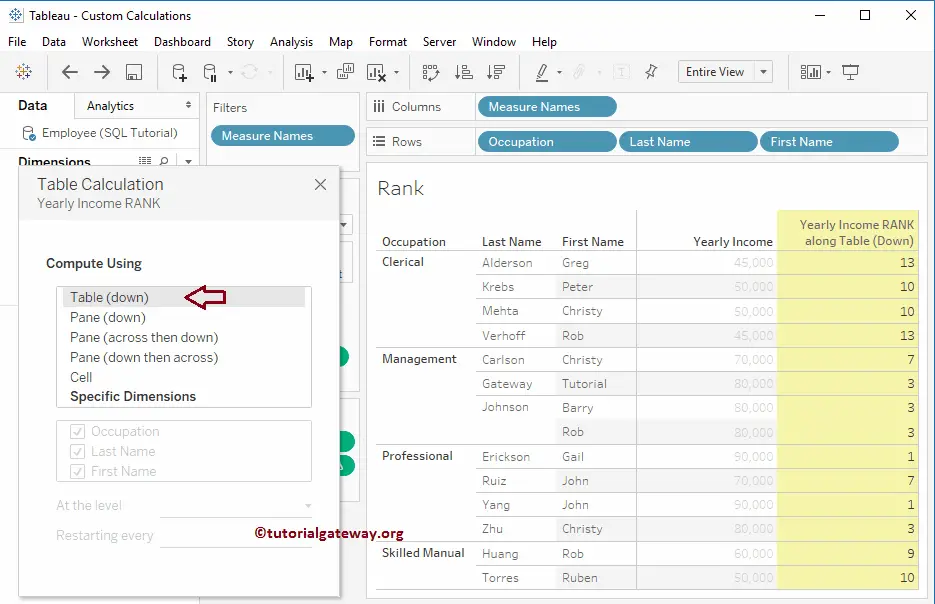
Let us change the Compute using the option from Table (down) to Specified Dimensions (Occupation, Last name, and First Name). Note we are selecting the Occupation dimension for Restarting every option. It will allow assigning the ranking for each Occupation. Or we can say, Rank yearly income partitioned by Occupation.
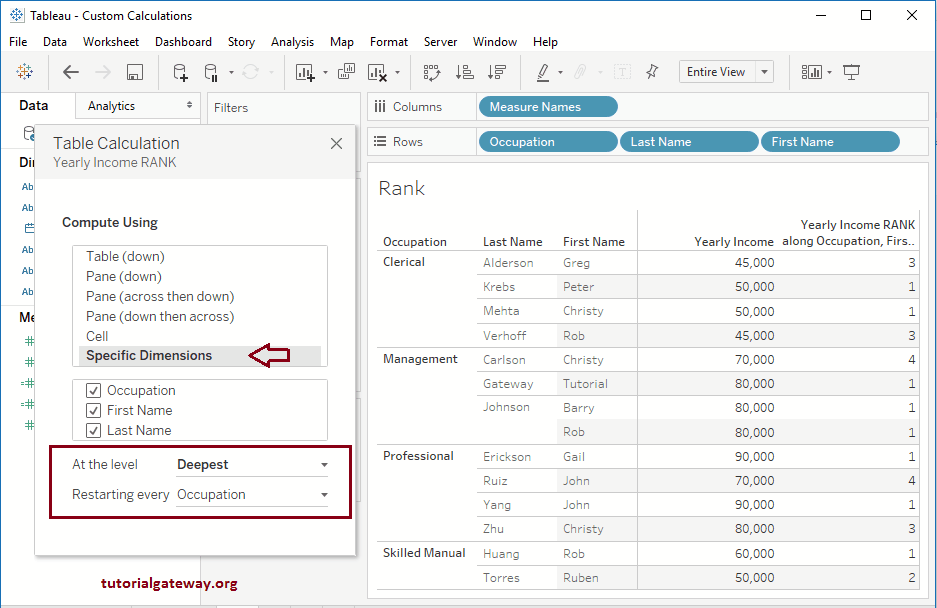
Now, you can see the result of this Tableau rank function. It calculates the Rank for each Partition (here, it is Occupation)
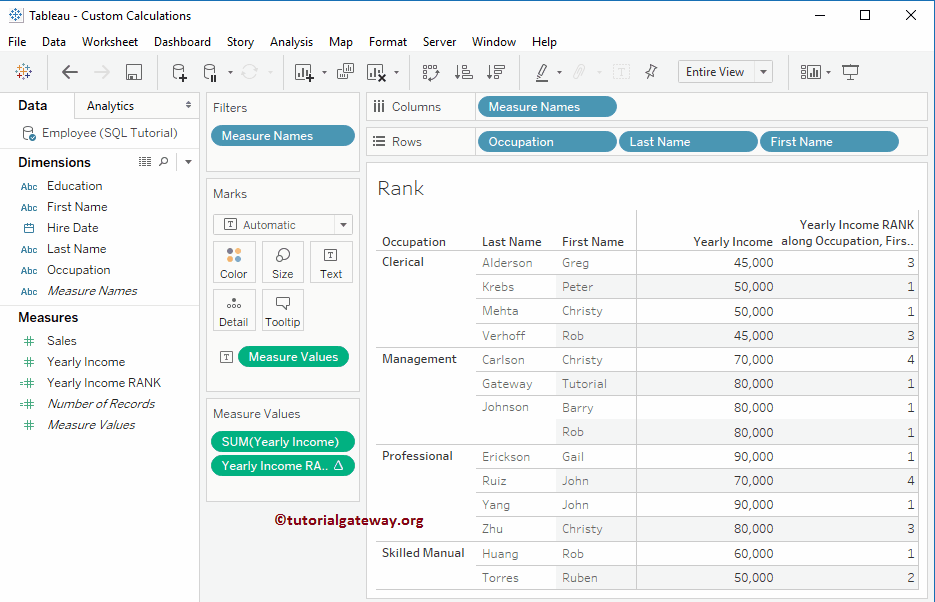
Tableau RANK_DENSE Function
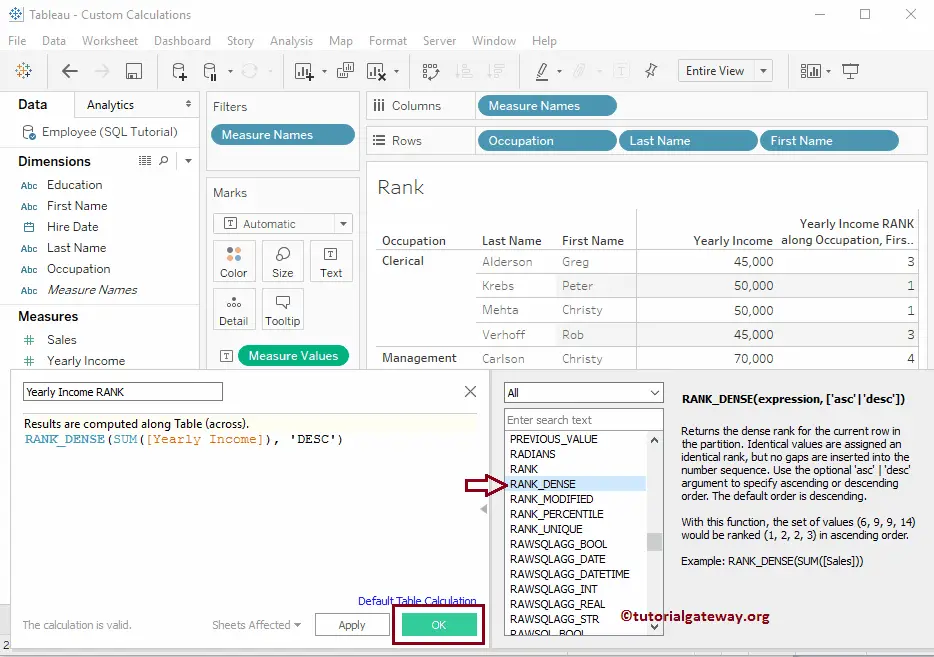
In this example, we are using the Tableau RANK_DENSE function. This Tableau rank function accepts two arguments: aggregated measure (or an expression) and ranking order (asc or desc). Here, the second argument is optional; by default, it will assign DESC (descending).
The Tableau Rank_dense Function will assign the same rank to an identical value but will not skip the next rank. For example, if we have 100, 200, 200, and 400, the function will return the ranks as 1, 2, 2, 3 in ascending order.
To change the existing table calculation, click on the down arrow beside the table calculation and select the Edit.. option.
Let us change the function name from RANK to RANK_DENSE, or write down your custom function and click OK.
As you can see the result, It is calculating the Dense Rank for each Partition (here, it is Occupation)
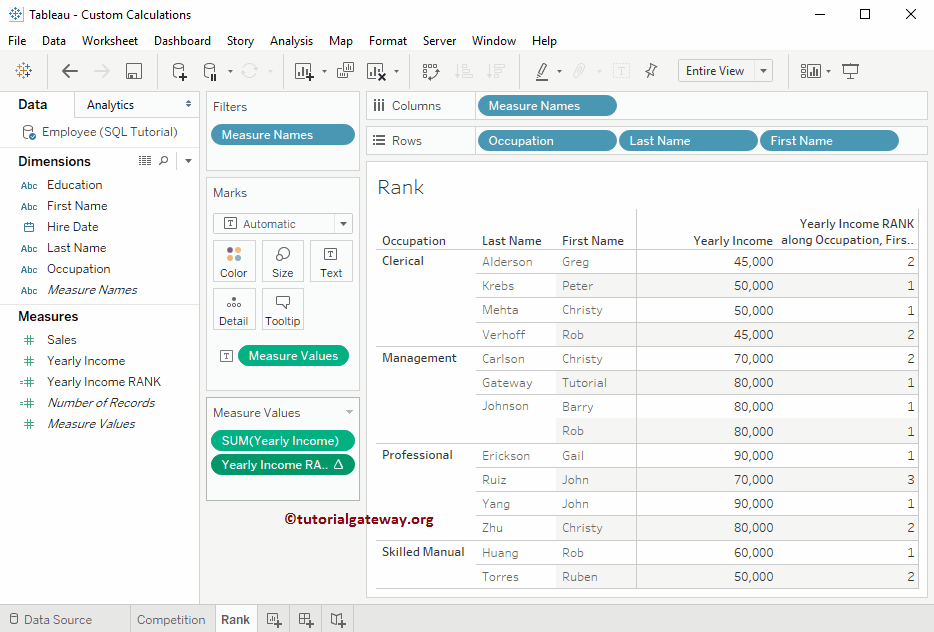
Tableau RANK_MODIFIED Function
In this example, we are using the Tableau RANK_MODIFIED rank function. This function accepts two arguments: first, aggregated measure (or an expression) and second, ranking order. Here, the second argument is optional; by default, it will assign DESC (descending).
The Tableau Rank_Modified Function will assign the same rank to an identical value. The Highest value will rank as 1, and the following two equal amounts will rank as 3. For example, if we have 100, 200, 200, and 400, then the function will return the ranks as 1, 3, 3, 4 in ascending order
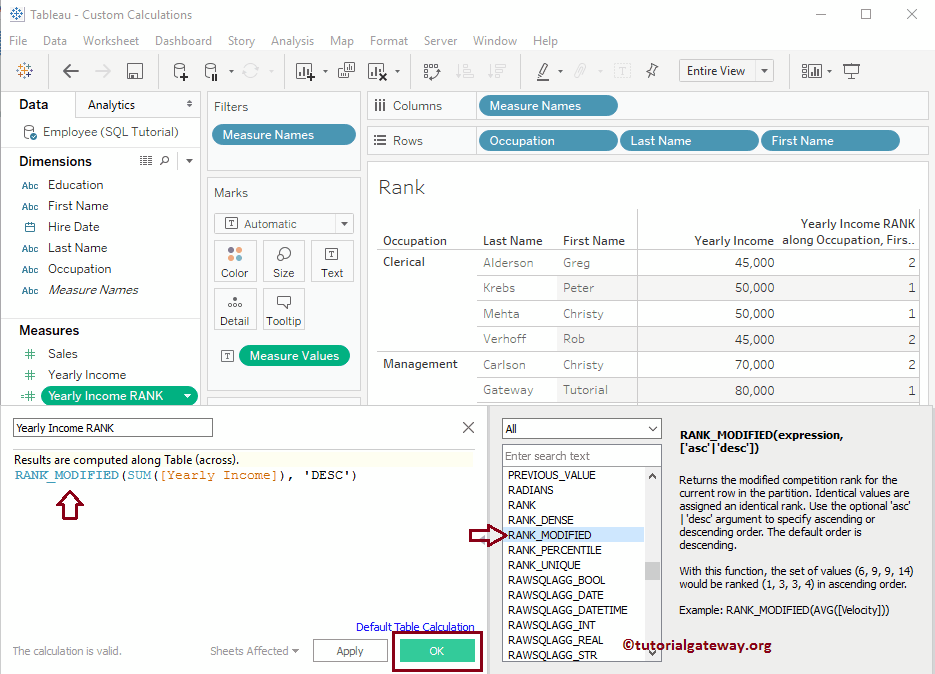
It calculates the Modified Rank for each Occupation
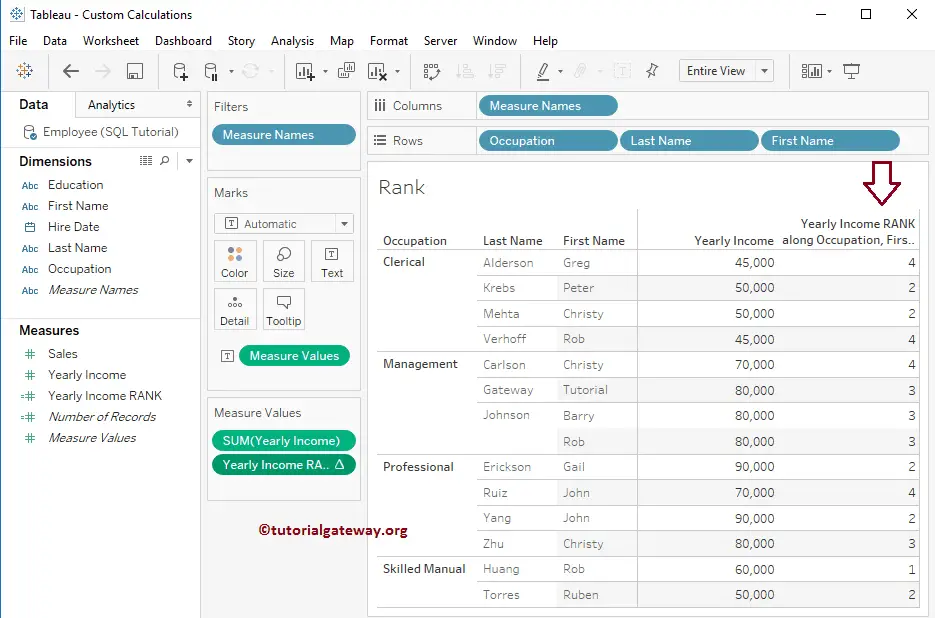
Tableau RANK_PERCENTILE Function
We are using the Tableau RANK_PERCENTILE function. This Tableau Percentile function accepts two arguments: one, aggregated measure (or an expression) and second, ranking order (ascending or descending).
In the Tableau PERCENTILE function, the second argument is optional, and by default, it assigns the DESC (descending).
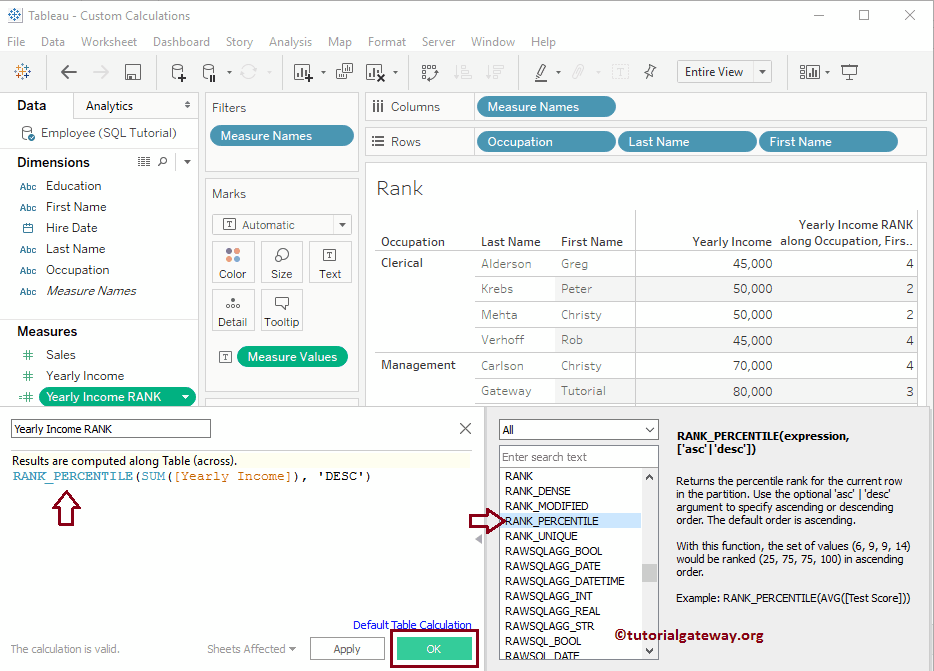
Now, you can see the result of this Tableau Rank function. It calculates the Percentile Rank for each Occupation.
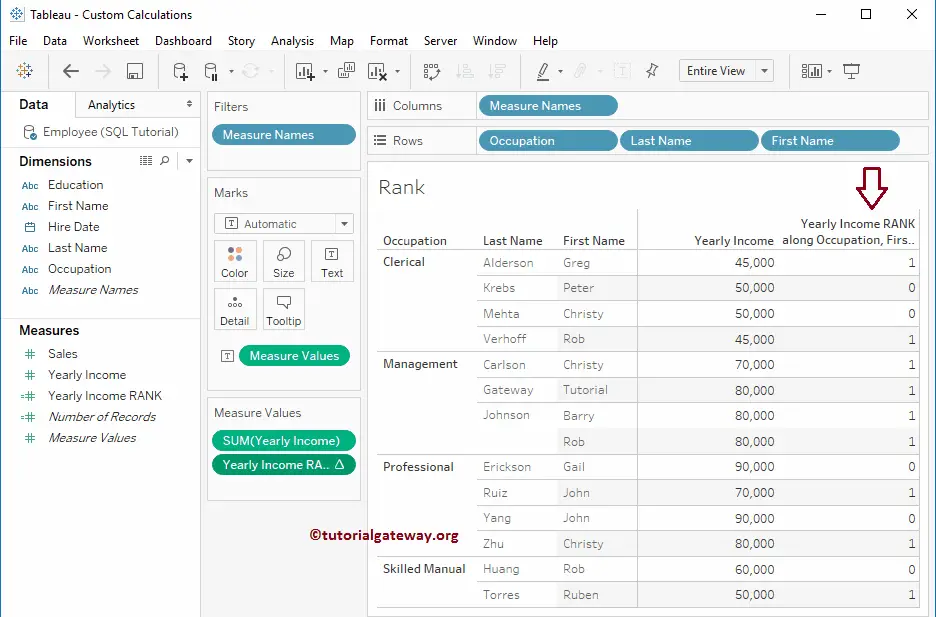
Tableau RANK_UNIQUE Function
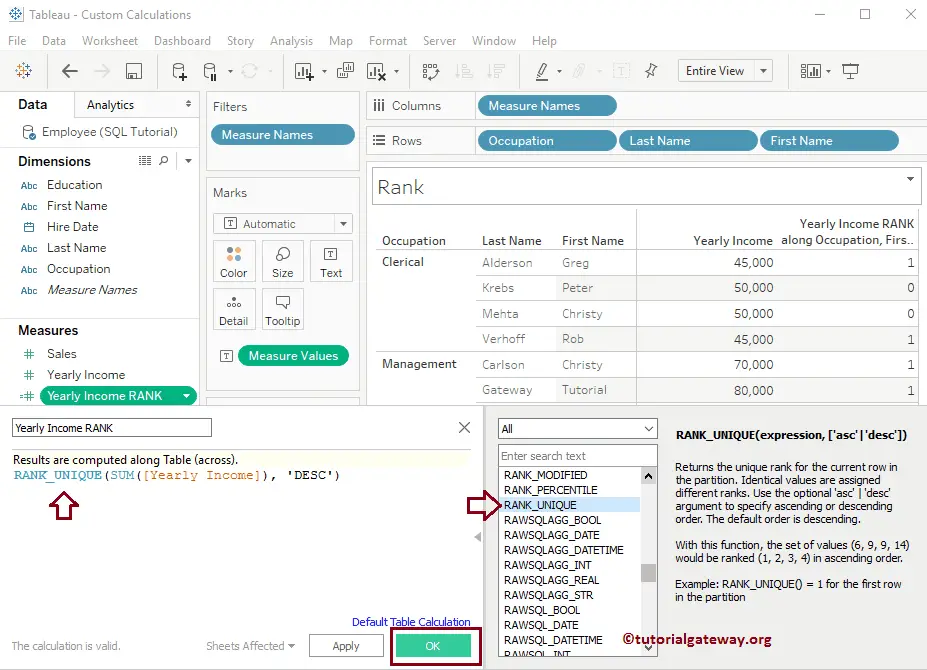
In this example, we are using the Tableau RANK_UNIQUE rank function. This function accepts two arguments: first, an expression, second, ranking order (ascending or descending). Here, the second argument is optional; by default, it will assign DESC (descending).
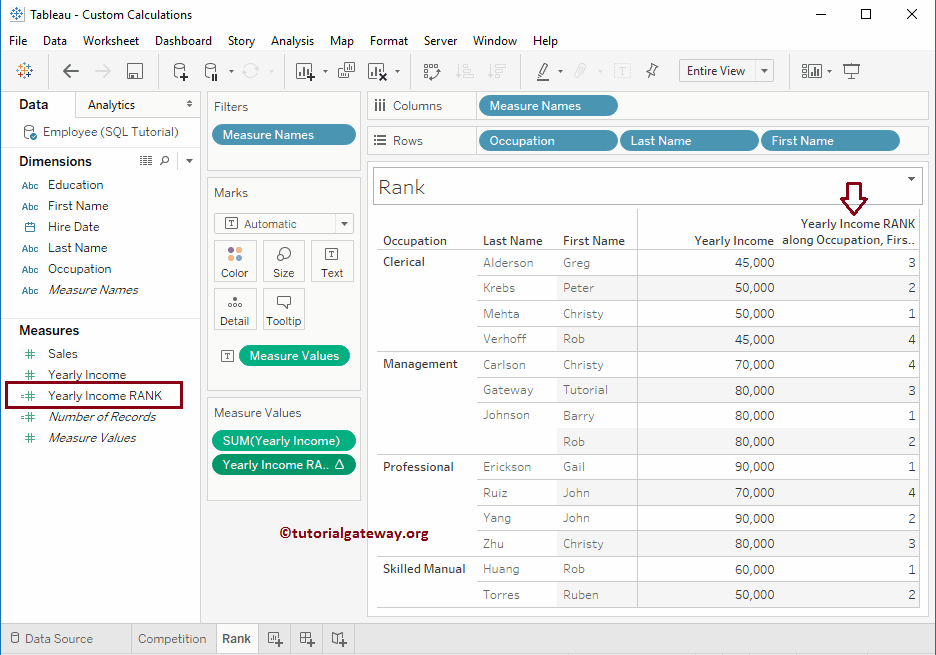
The Tableau Rank_UNIQUE Function will assign the unique rank to an identical value. For example, if we have 100, 200, 200, and 400, the Rank_UNIQUE function will return the ranks as 1, 2, 3, 4 in ascending order.
See the Tableau RANK_UNIQUE function result. It assigns the Unique Rank for each item present in the Occupation.

Comments are closed.