In this article, we will show you how to calculate the Tableau Running Total with an example. For the Running Total demo, we are going to use the Data Source we created in our previous article.
Before we start calculating the running total in Tableau, let me create a report that we are going to use in this example. First, Drag and Drop the order date (Year) from Dimension Region to Column Shelf.
Next, Drag and Drop the Order date (Quarter) and Order date (Month) from Dimension Region to Rows Shelf. Finally, Drag and Drop the Sales Amount from the measures region to the text field present on the Marks shelf.
Calculate Tableau Running Total
Once you drag them, the following Report will generate. Please visit the Data Labels in Reports article to understand the Tableau Data Source.
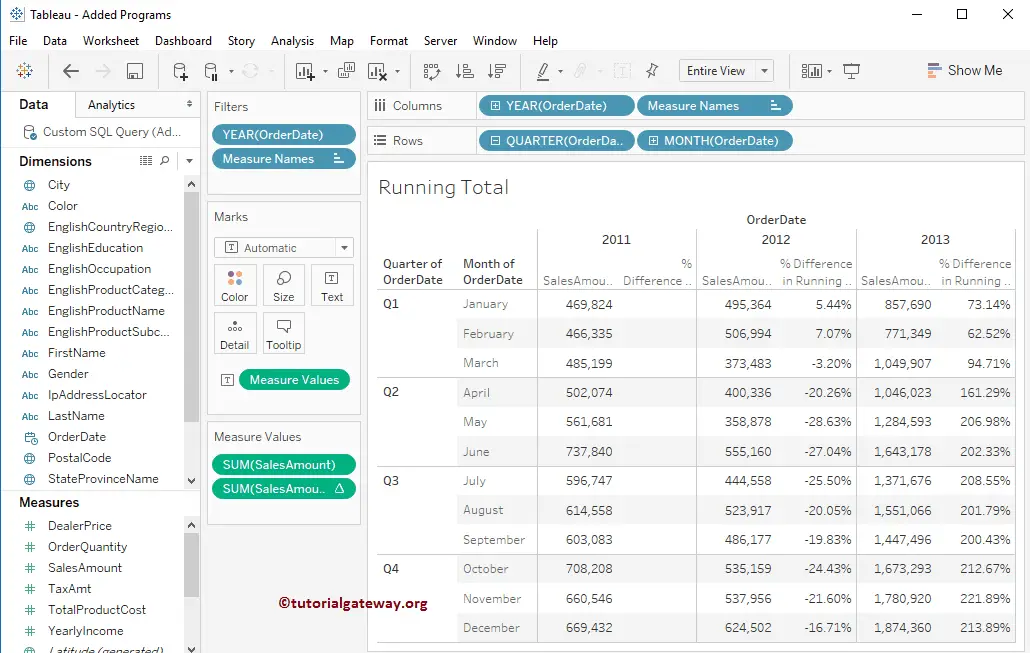
As you know, we don’t have much data (sales) for 2010 and 2014 in the Adventure Works DW database. So, we exclude those two years from the table report by selecting those two columns and then clicking the exclude button present in the tooltip. The screenshot below will show you the final report we will use for calculating the running sum in Tableau.
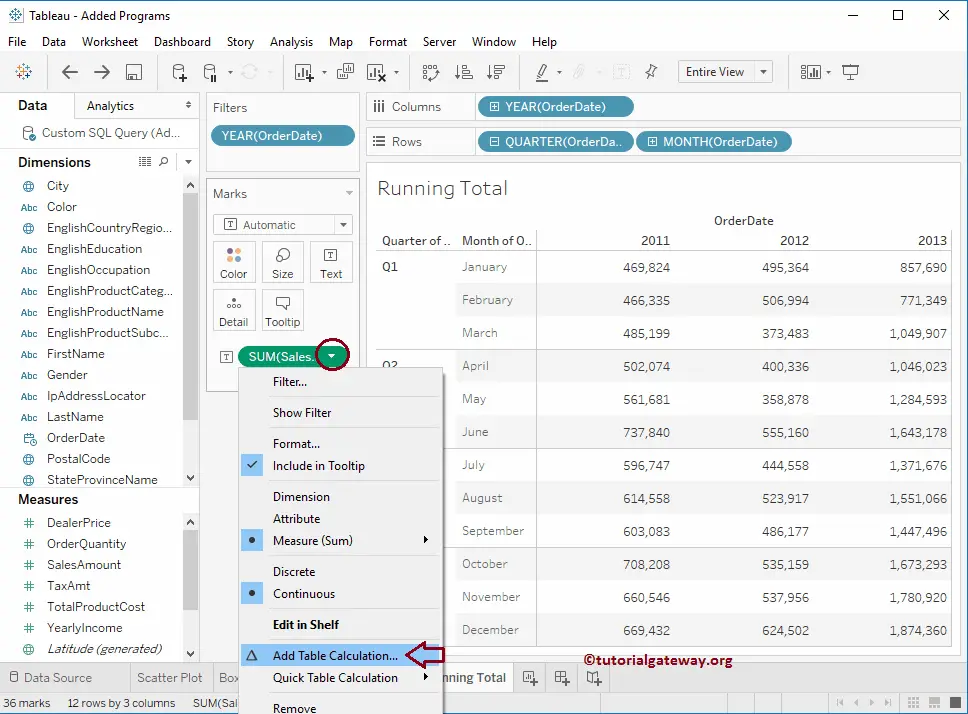
We have to add the table calculation to calculate the running Total in Tableau. To do so, click the Down arrow beside the Sales Amount measure (change as per requirement) to open the context menu.
From the list of available options, you can either select the Add Table option or the Quick Table Calculation option. I suggest you use the Add Table Calculation option.
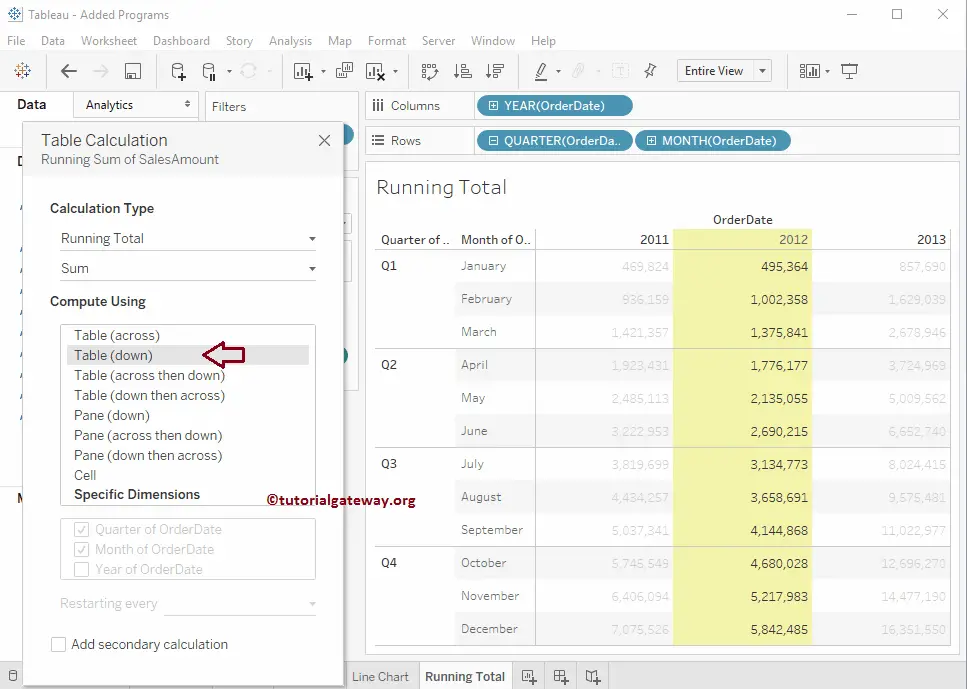
Once you click on the Add Table option, a new window called Table Calculation will open, as shown below. By default, it has selected the Calculation Type as Difference from and Compute using the option as Table (across).
Please change the calculation type from Difference From option to Running Total. Next, change the Computing using the option from Table (across) to Table (down). As you can see, we have successfully generated the report that calculates the running total in Tableau.
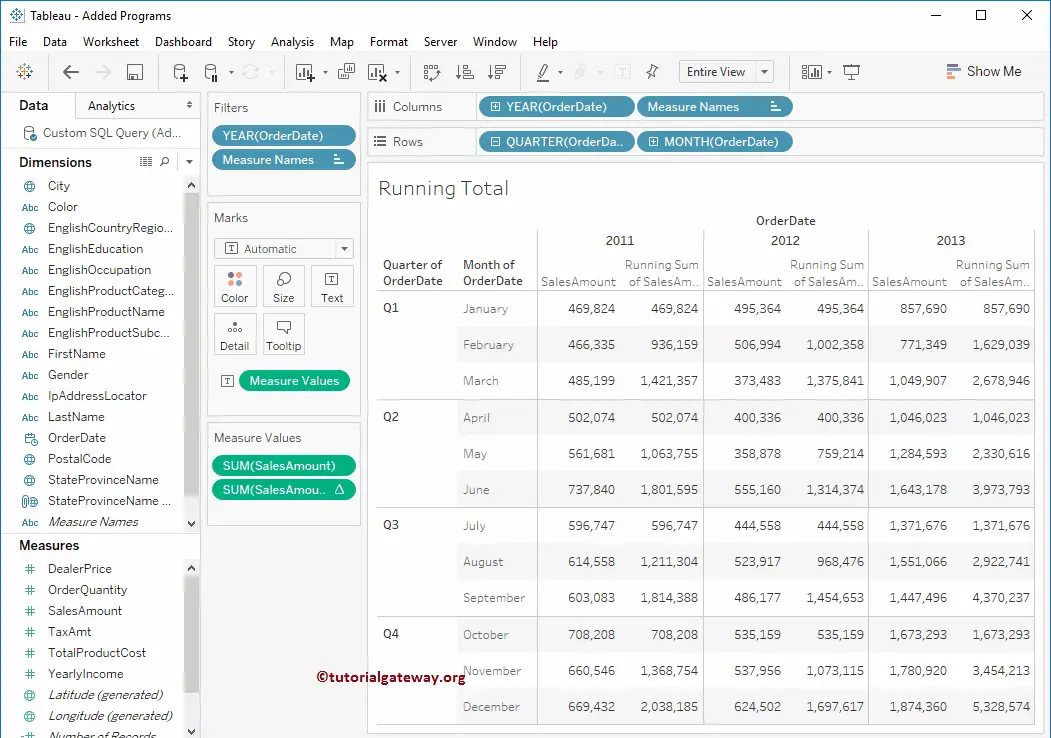
I think it will be helpful to show the Sales Amount values. So that you can compare the Running Total with the Original Sales Amount values, let us add the Sales Amount to the Columns Shelf. As you can see, the desktop shows the Original values and its running Total for each year.
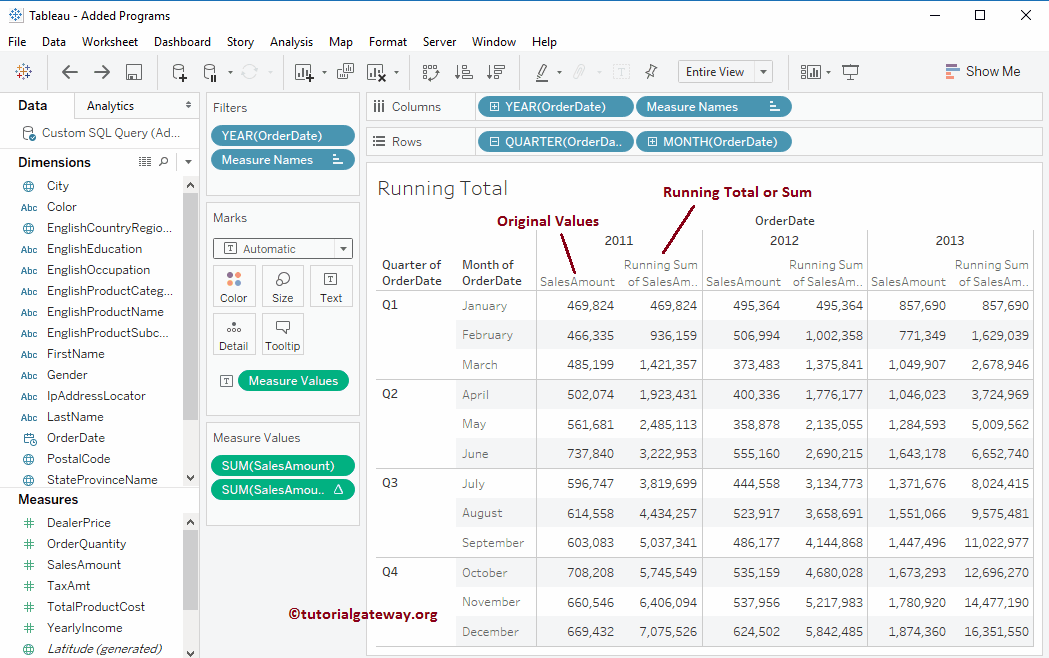
Tableau Running Total for each Partition
It would be nice if we calculate the Running Total for each partition or each Quarter. To change the actual calculation, we have to edit it. To edit the existing table calculation, please click on the down arrow beside the table calculation (with the pyramid symbol), which will open the context menu. You must select the Edit Table Calculation option.
Once you click on the Edit Table Calculation option, a new window called Table Calculation will open. As you can see, tableau has selected the best possible options, such as Calculation Type as Running Total, Aggregation as SUM, and Compute using the option as Specified Dimensions (Quarter of Order date and Month of Order Date) by default.
Here, you must change the Restarting Every option from None to Quarter of Order date. It will ensure restarts the running total for every quarter of the year.
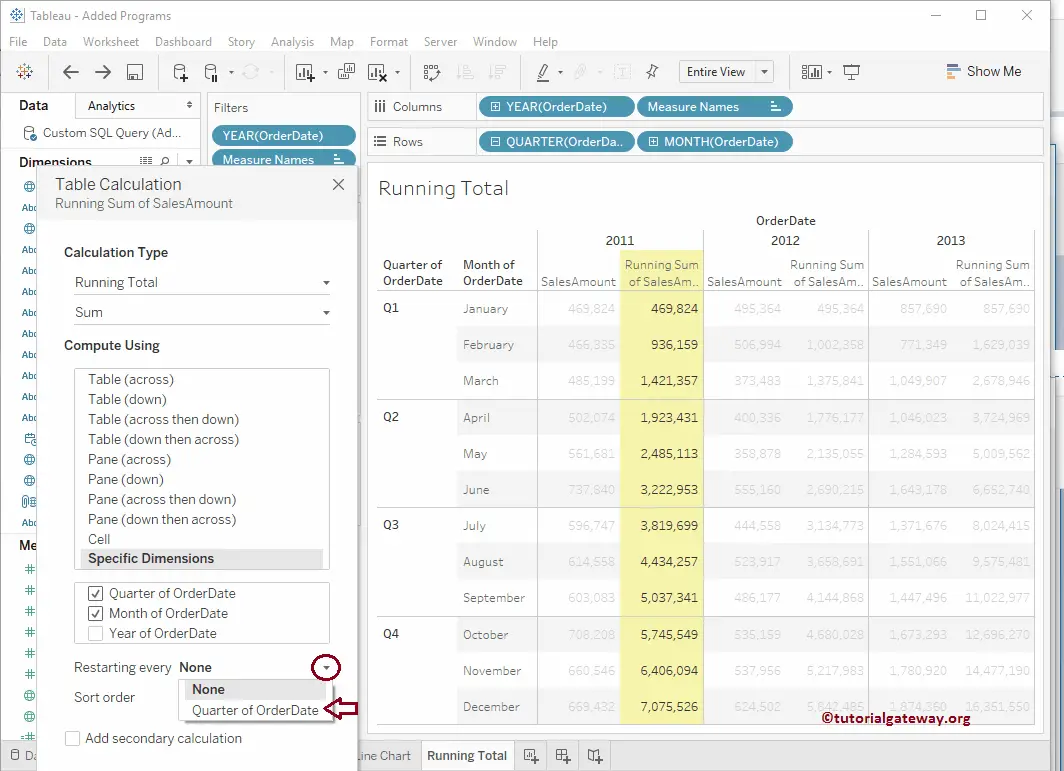
Now you can see the running total for each quarter
Add Secondary Calculation in Tableau
The desktop allows us to add the secondary calculation to the report. It is beneficial to calculate further on top of the actual calculation. To do so, Please check the Add Secondary Calculation option, as shown below.
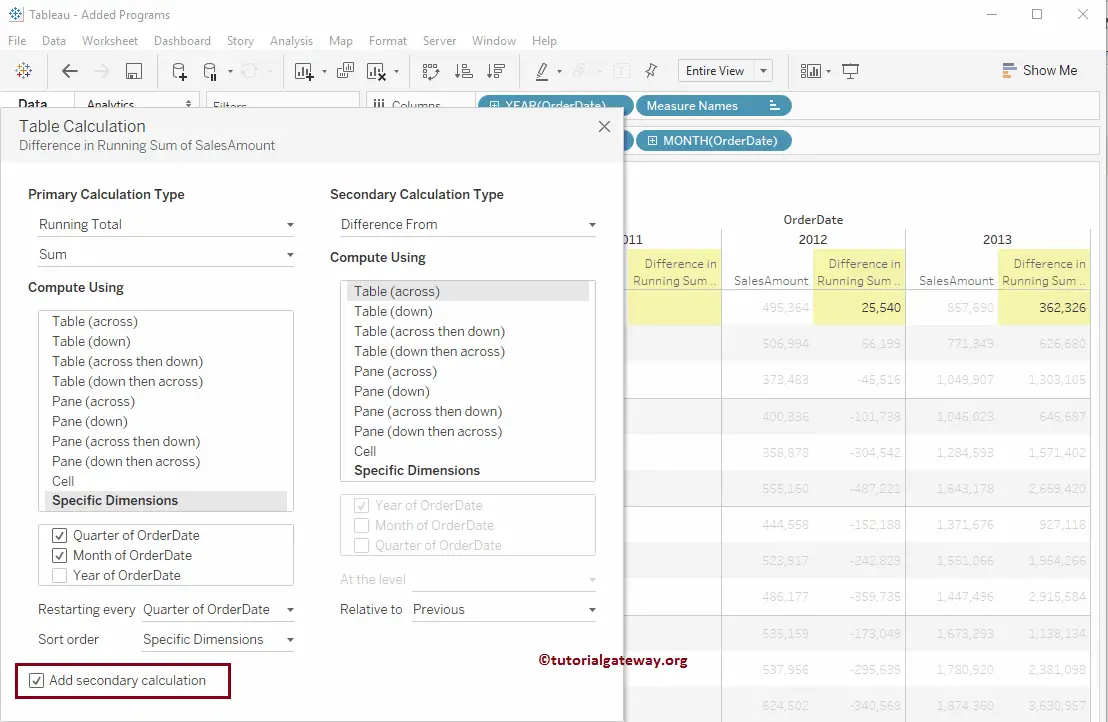
Please leave all the default settings and change the Secondary Calculation Type option from the Difference From to Percentage Difference From
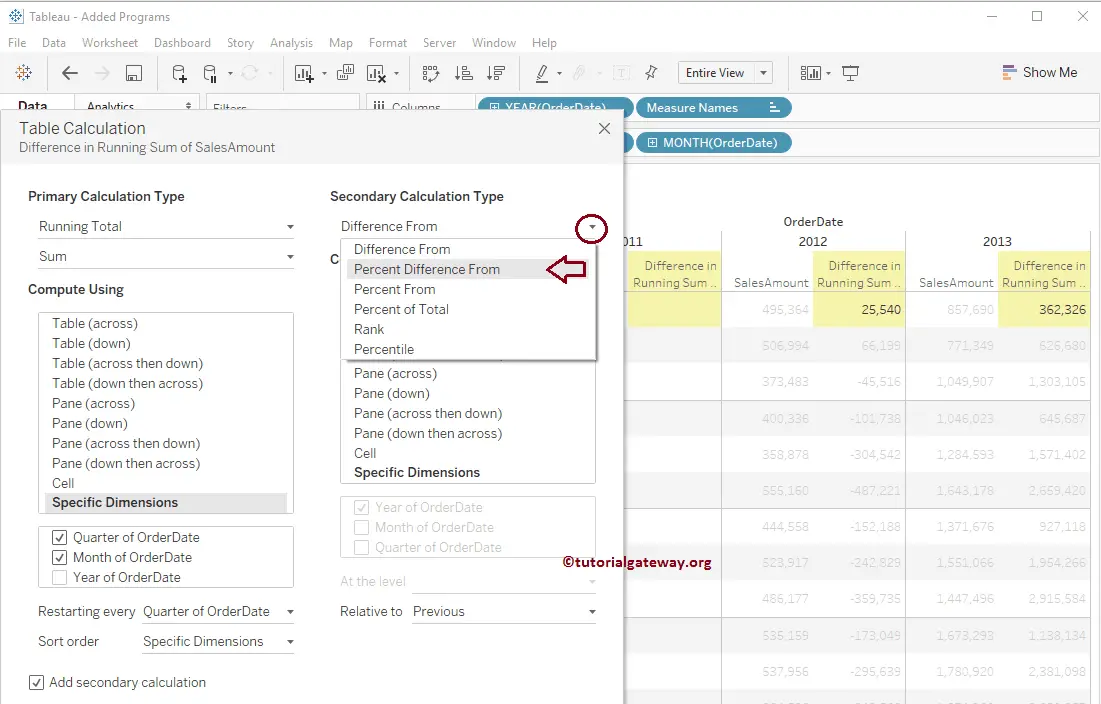
The following screenshot will show you the Percentage of difference in Tableau running total.