This Tableau article shows how to create a Progressive or Progress Bar chart with an example. For this demo, we used the default Sample Superstore dataset.
Create a Tableau Progress Bar Chart
Drag and drop the Sub-Category to Rows and Sales Amount to Columns Shelf to create a horizontal bar chart.
Please sort the Tableau Bar chart by Sales amount in descending order. You can also use the same technique to create a progressive chart for the following ones.

From the Analysis Menu, choose the Create Calculated Field option, which will open the window below. First, let me rename it as One and 1 as the value. Then, please refer to the Calculated Field article from the Tableau tutorial page.
Name: One
Expression: 1
Next, click on Sales to add Quick Table Calculation as the Tableau Percentage of Total to convert numbers as percentages.

Add Sales to Label shelf. Next, click on Sales to add Quick Table Calculation as the Percentage of Total.

Right-click on the Calculated Field (One) -> Default Properties -> Number Format. Please change the Default Number Format of the One from Automatic to Percentage and set the Decimal places to 0.

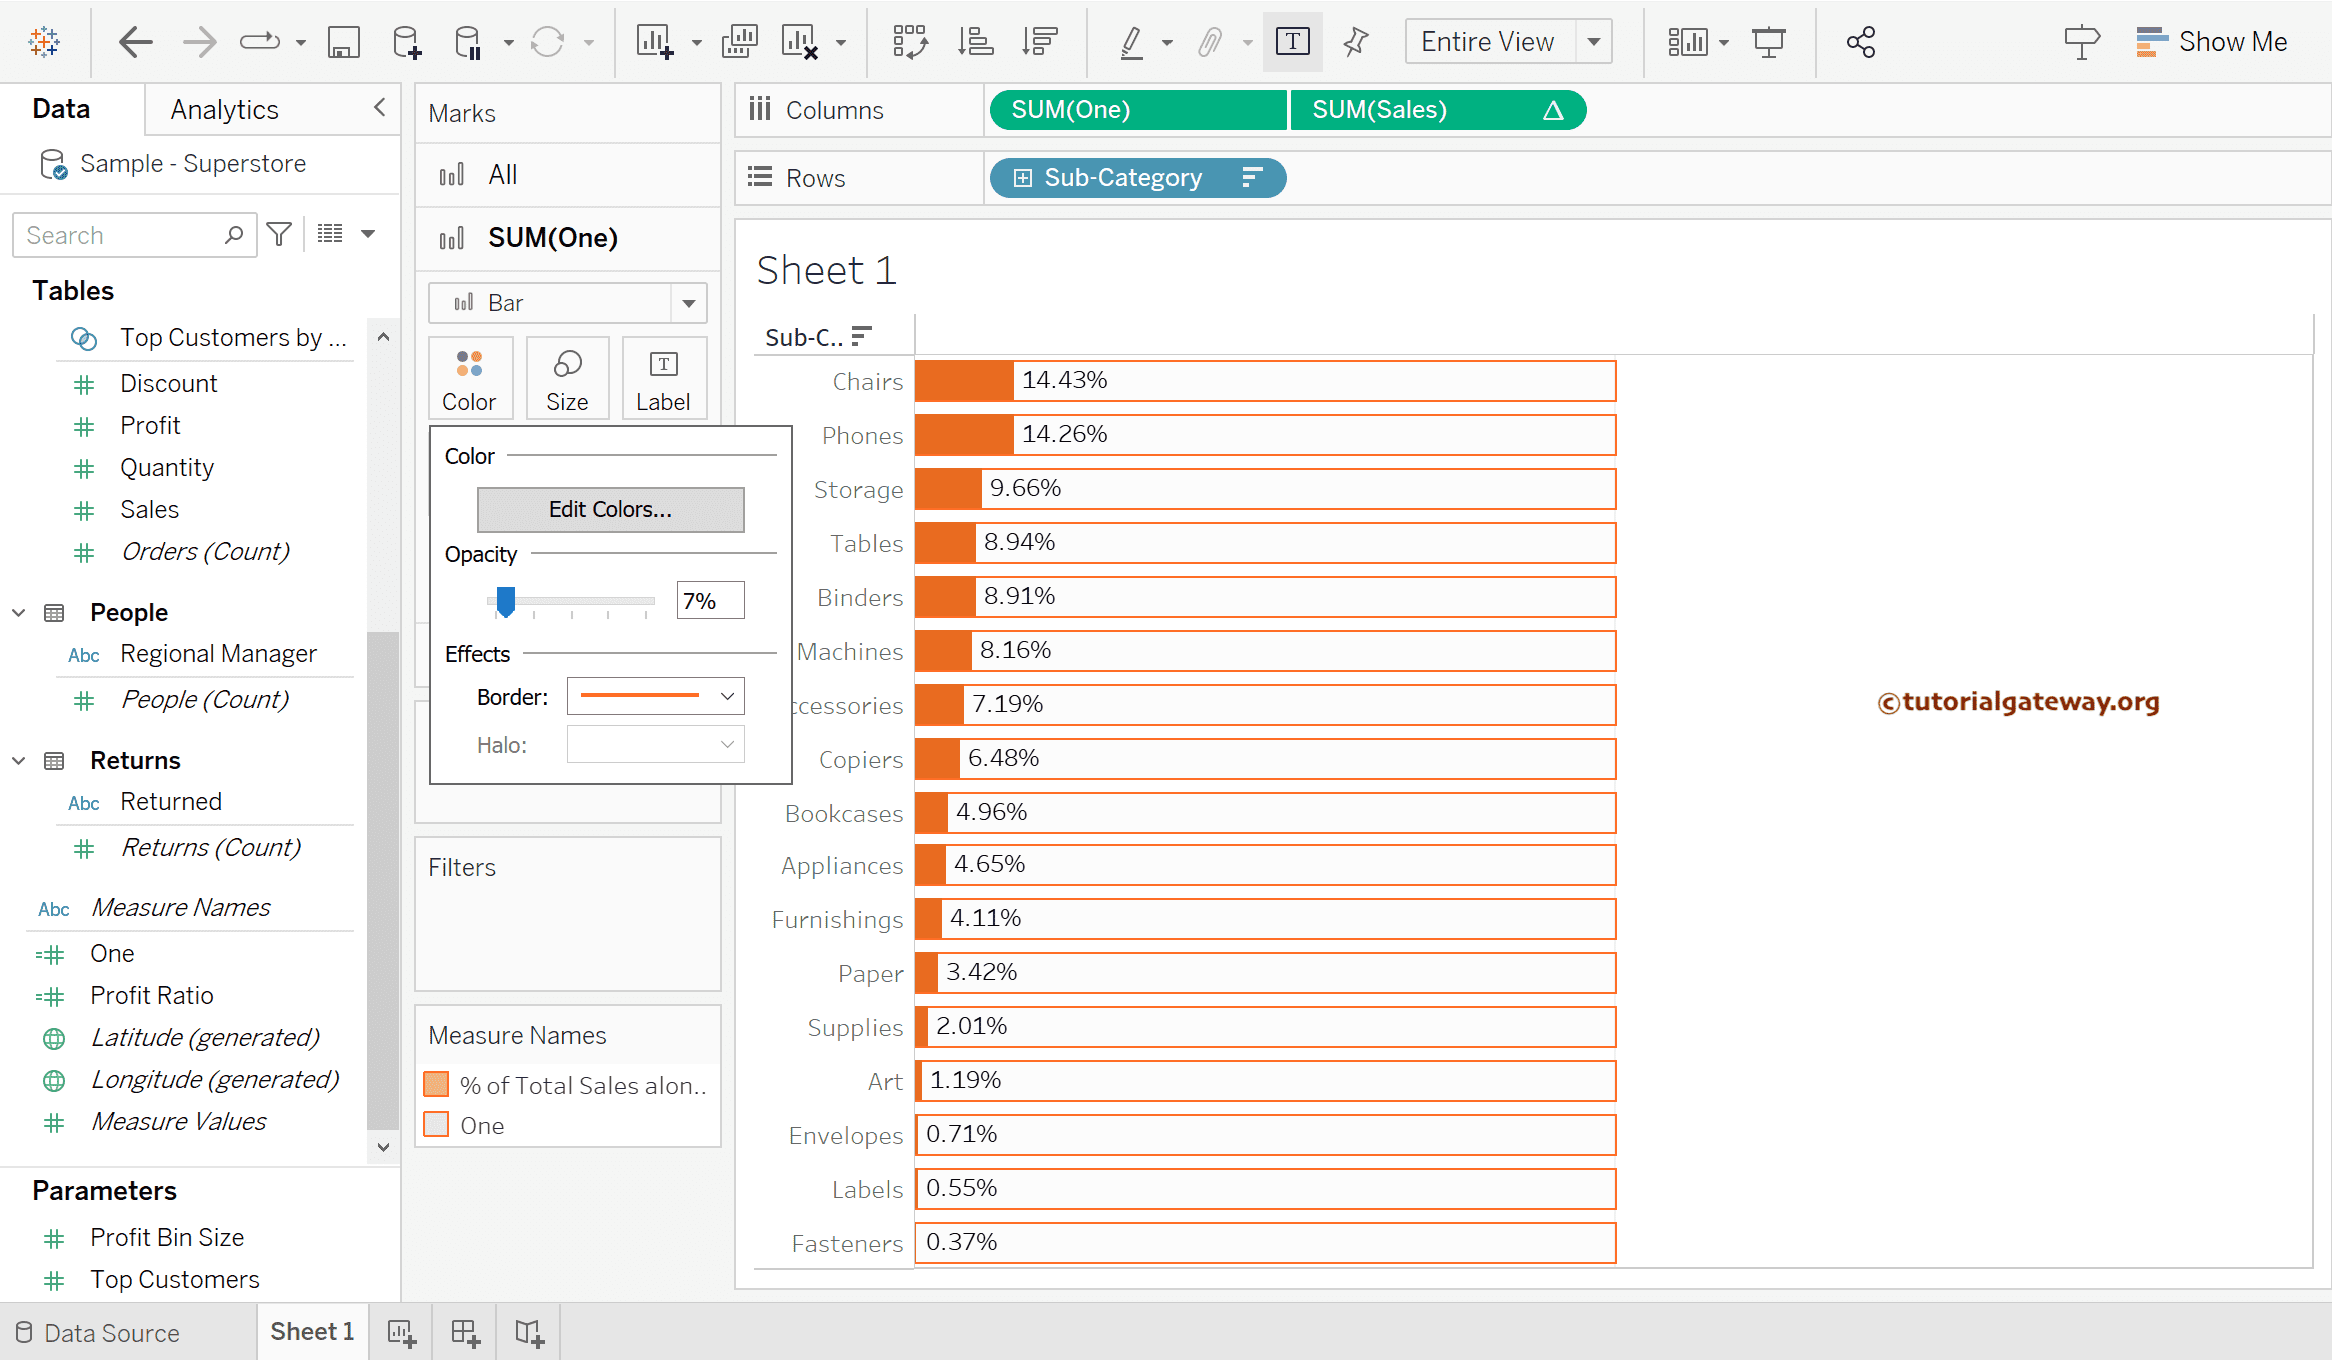
Add One to the Columns shelf to create a secondary axis, and remove the Sales Label from SUM(One).

Click the Down arrow beside the SUM(One) and choose the Dual Axis option.

Under the All section, change the Marks Type from Automatic to Bar to create a Tableau Progress bar chart. Right-click on any axis and choose the Synchronize Axis option. Next, Right-click on both the Axis and uncheck the Show Header option.

Let me do some color and border formatting of the SUM(One).

The final Progress bar chart.