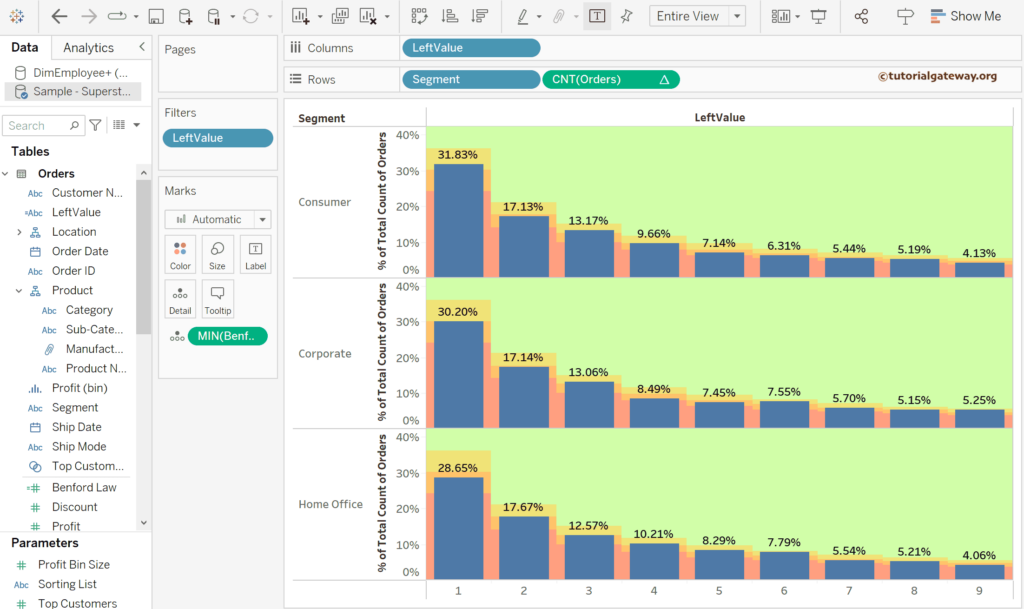
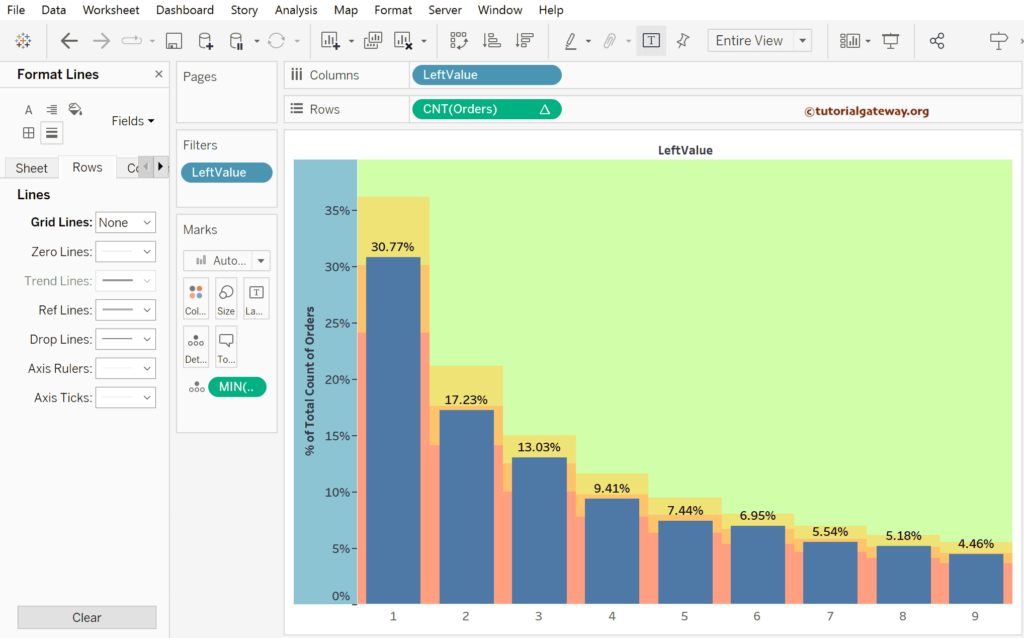
This article explains how to create and use the Tableau Benfords Law chart with a practical example. The Benfords Law chart is a mathematical law that helps to check whether the data is real or fake. It takes the first digit or the leftmost digit and draws the bar chart. If the data obeys the Benford Law, 1 appears around 30%, and 9 appears less than 5%; if true, it is accurate data.
To demonstrate this Tableau Benfords Law chart example, we used the Sample Superstore Excel sheet. Please visit the Excel Source article to understand the Data Source.
Tableau Benfords Law chart
First, create a calculated field to write the expression. To do this, right-click the empty space within the Measures shelf to select the Create Calculated Field.. option. Otherwise, use the Analysis Menu option.
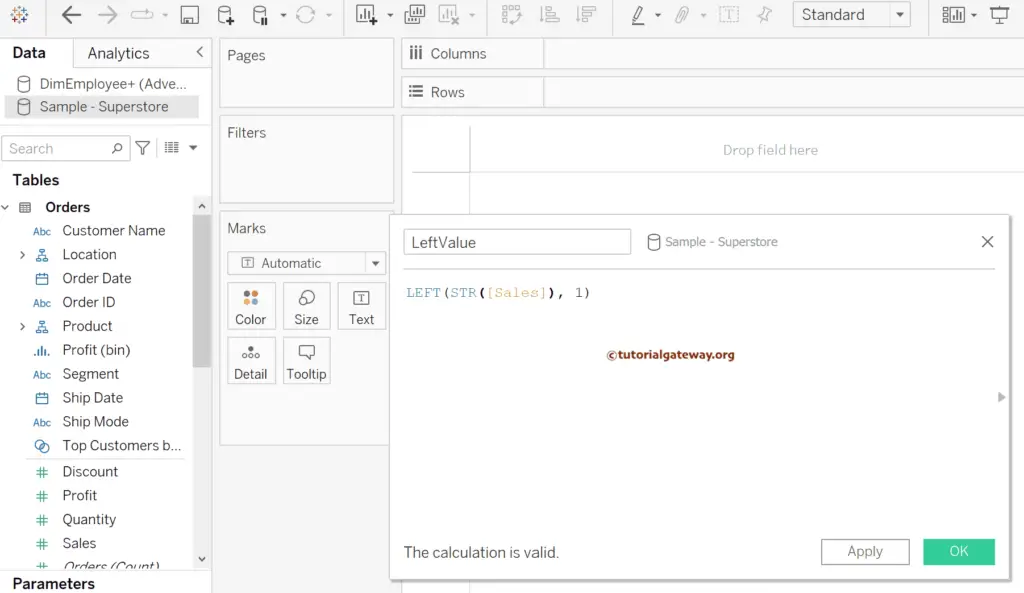
The expression below uses the LEFT string function to return the first or leftmost digit of the sales measure. Here, the STR() function converts the Sales to the string, and the Tableau Benfords Law chart uses it to draw the bar. For remaining functions >> Click Here!
LEFT(STR([Sales]), 1)
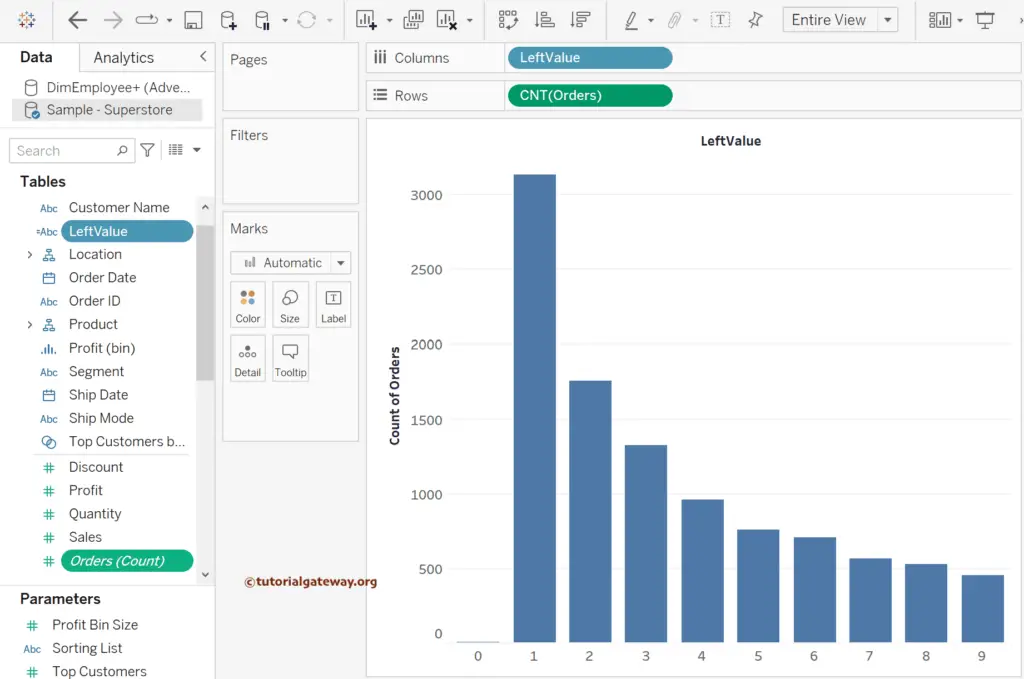
Drag and drop the Count of Orders Measure to the Rows shelf and the newly created LeftValue calculated field to the Columns Shelf. By default, it creates a column chart. If so, please change the mark type from Automatic to Bar. For the remaining charts in Tableau, please click here.
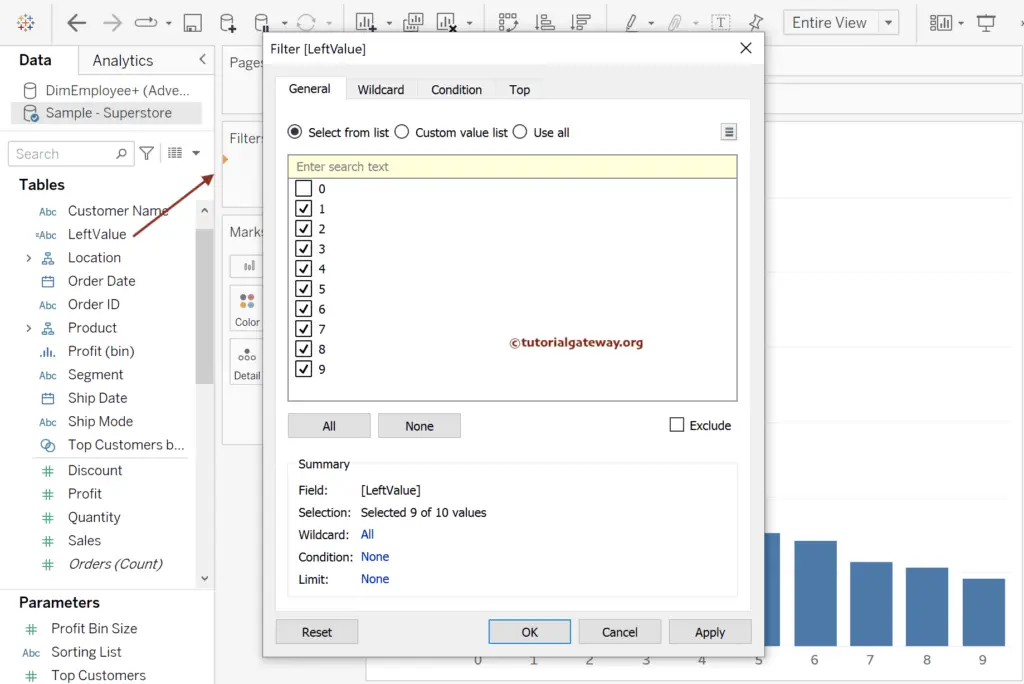
We don’t need the 0 columns to create a Benford Law chart. So, add the LeftValue calculated field to the Filters Shelf and remove/uncheck 0 from the list.
Use the T button in the toolbar to add the data labels to the Tableau Benfords Law chart.
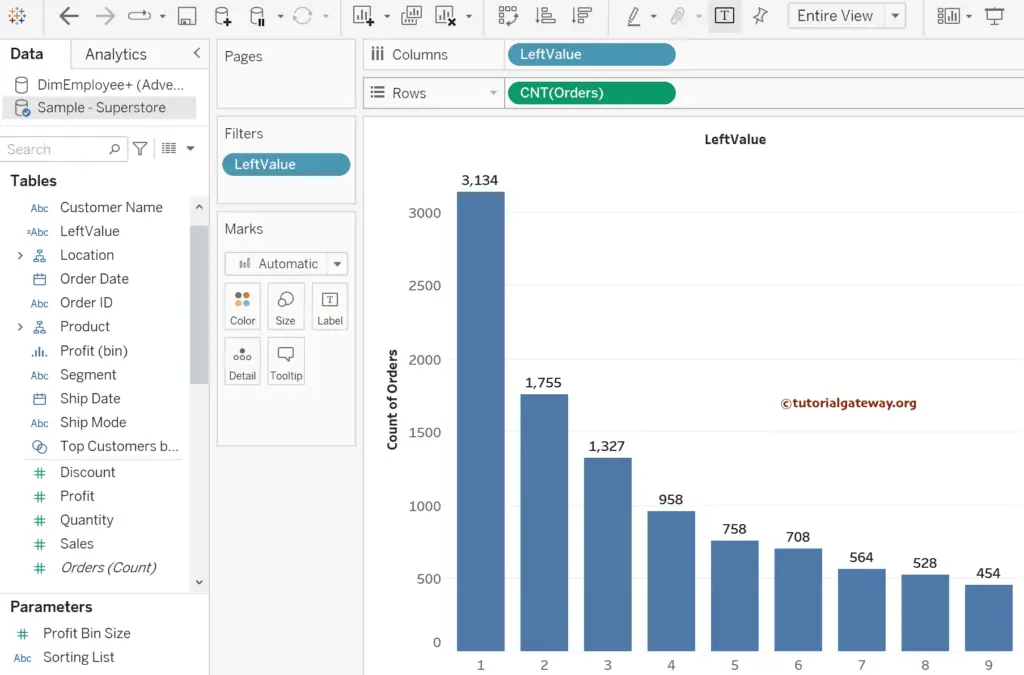
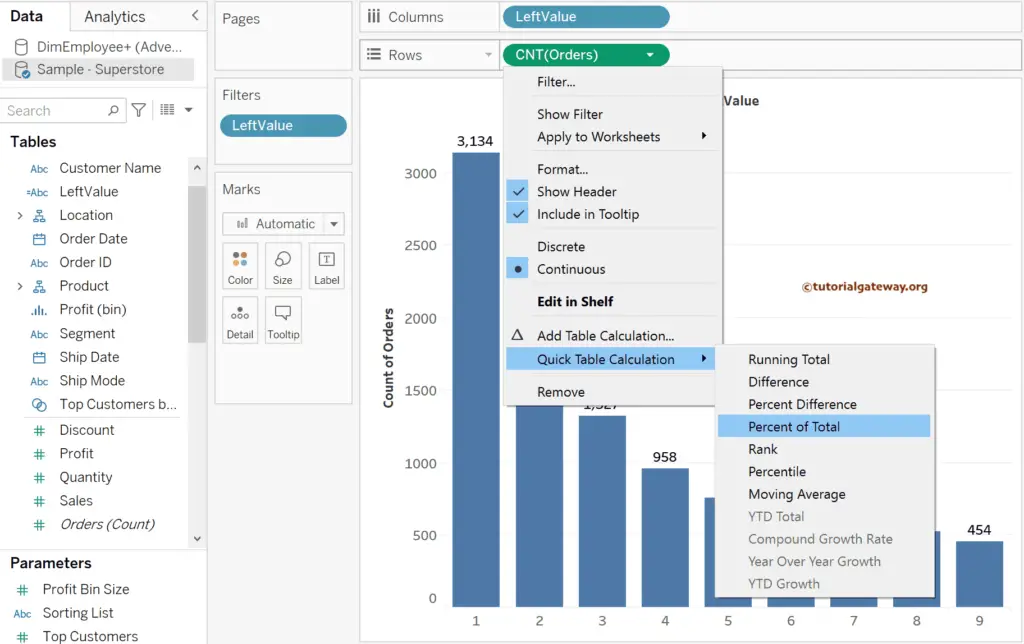
It displays the total orders. However, we need the percentage of the total in the Tableau Benfords Law chart. So, click the down arrow beside the CNT(Orders) in the Rows shelf, choose Quick Table Calculation, and select the percentage of the total. Please refer to the Quick Table Calculation and calculate the percentage of total articles.
Now, you can see the percentage of totals. Let me create one more calculated field to write the Benfords Law expression.
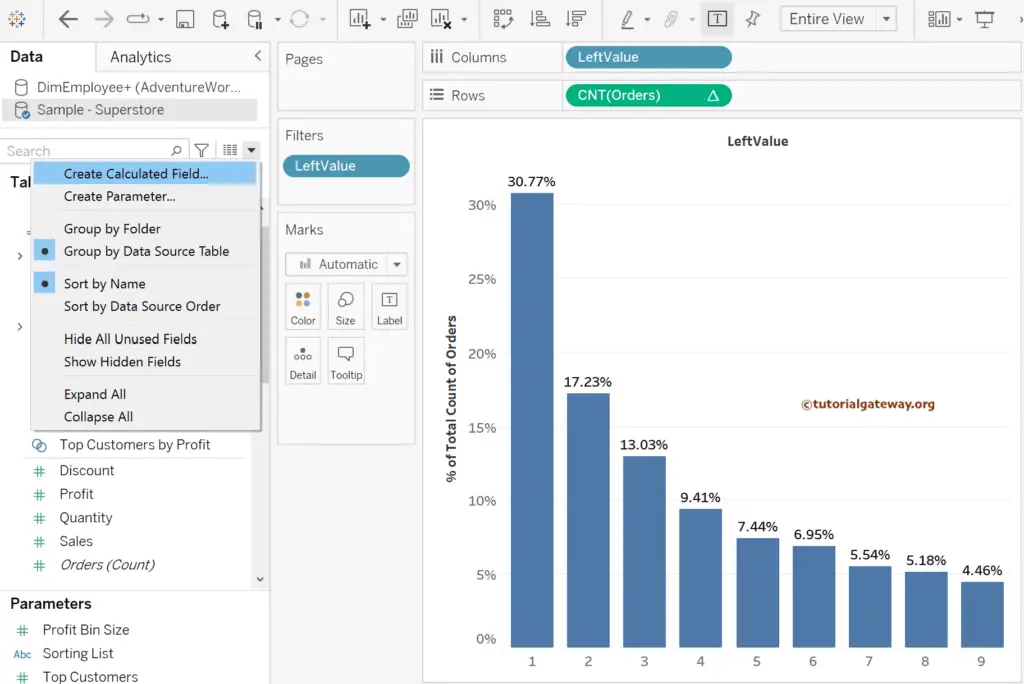
The Tableau expression below calculates the Benfords Law. Please search the internet to understand the formula.
LOG(1 + 1/ INT([LeftValue]))
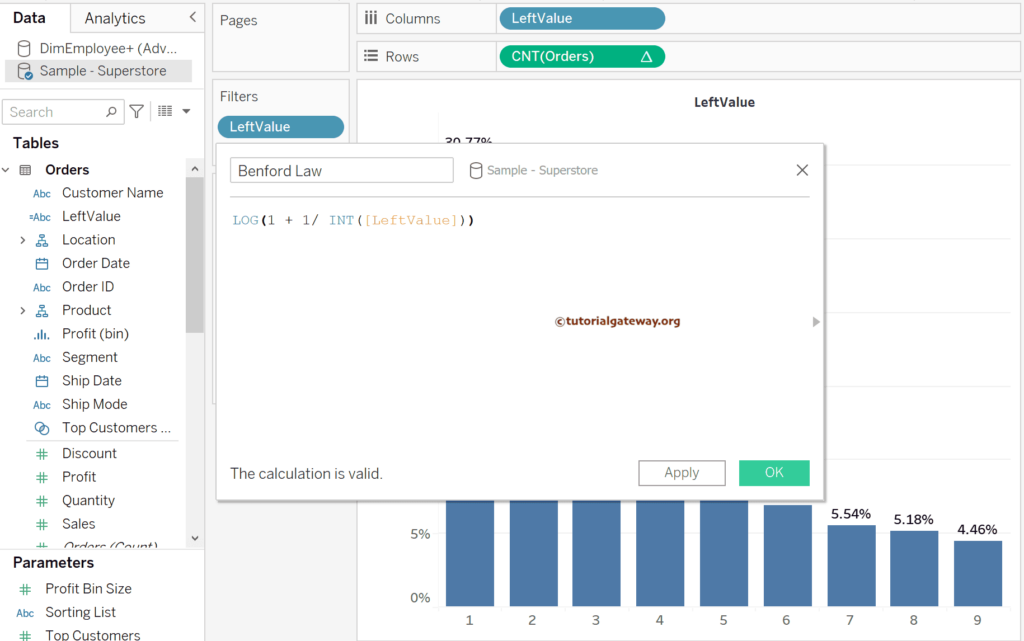
Please add the Tableau Benford Law calculated field to the details shelf; otherwise, you can’t use it in the reference lines. Next, right-click on % of total orders Axis (Y-Axis) and choose the Add Reference Line option.
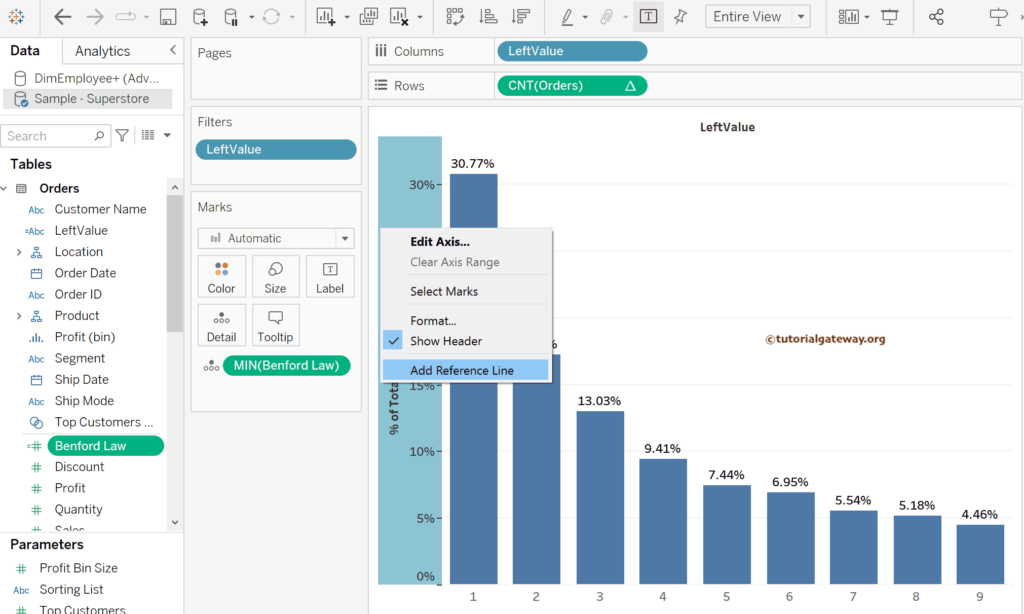
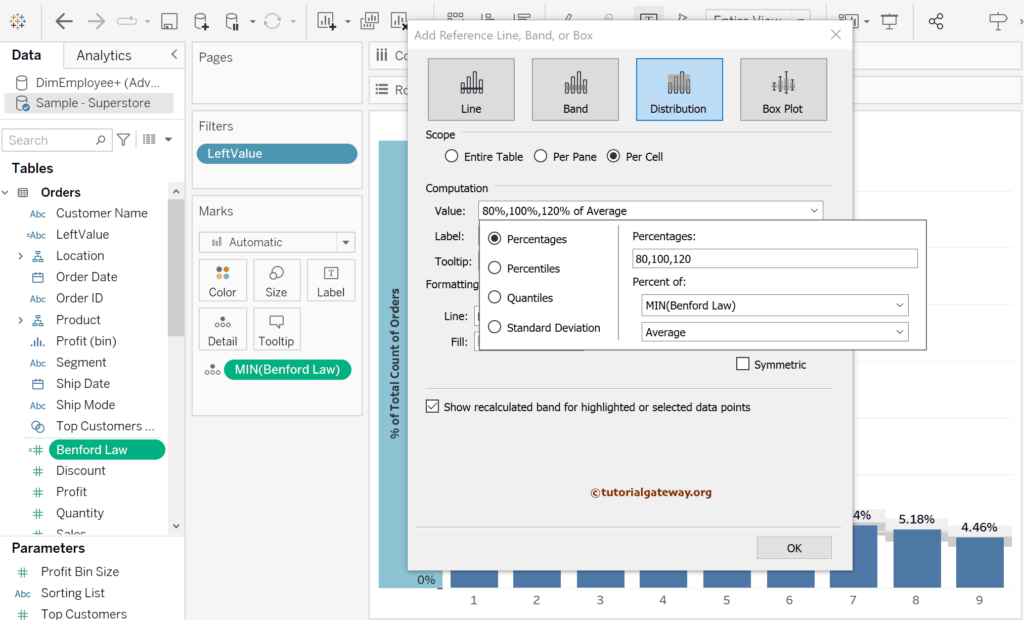
It opens the following Add Reference Line, Band, Box, or Distribution window. Please use this window to add reference Distribution to the Bar chart. First, let me choose the per cell scope value as the 80%, 100%, and 120% of Average. Here, choose the MIN(Benford Law) calculated field as the percent of option. Once you choose them, you can also notice the gray and white smoke lines in the report.
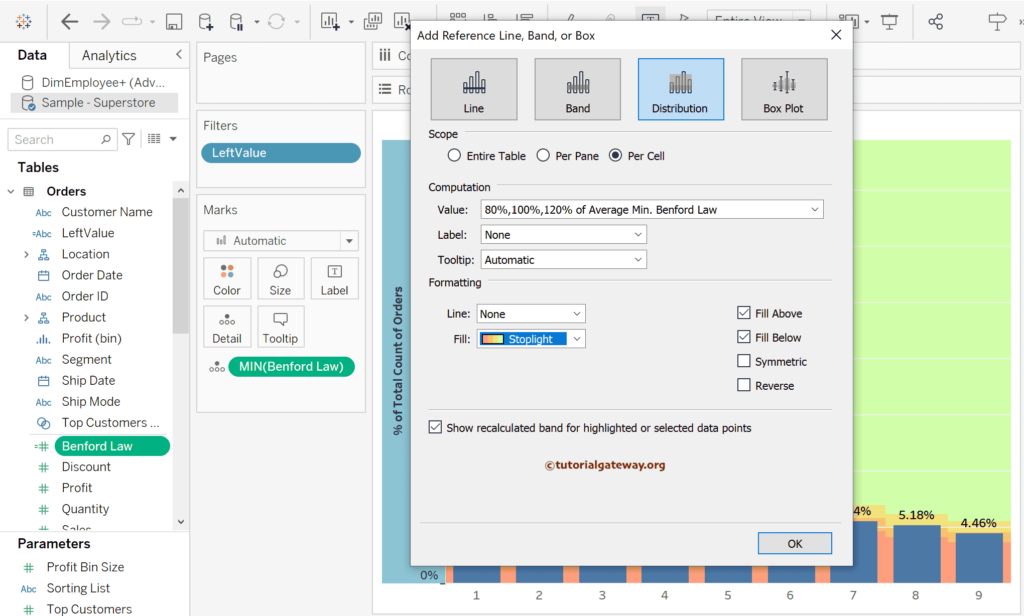
Under the Formatting section, choose the spotlight color to fill below and above the distribution.
As there are some white lines in the Tableau Benfords Law chart, let me use the Format menu to remove the Grid lines, as shown below.
Suppose you add the Category dimension before the Order count. In that case, the Tableau desktop displays the Benfords Law chart for each category.
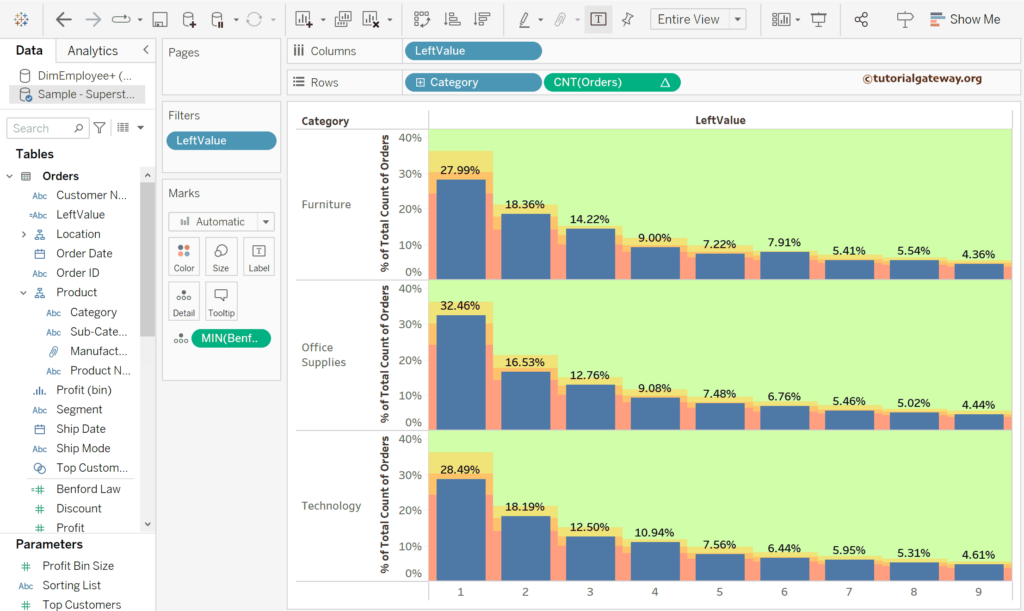
You can experiment with the same by replacing the Category with Segment.
