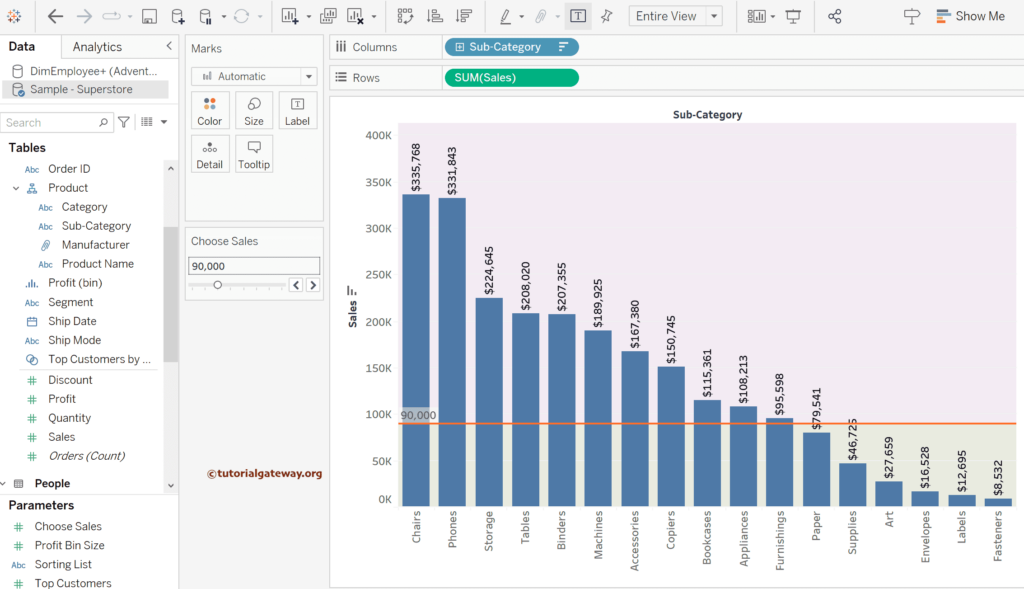
This Tableau article explains how to add a Reference Line using a parameter with an example. In general, you can add a reference line to the sales average. However, if the organization has a specific range of values to compare against the sales, then this approach is viable.
Instead of allowing fixed reference lines, it allows the user to select their own value, and the reference line will appear at that point. We used the Sample Superstore Excel sheet to demonstrate the addition of the Reference Line using the Tableau parameter. Please visit the Excel Source article to understand the Data Source.
How do you add a Reference Line using the Tableau parameter?
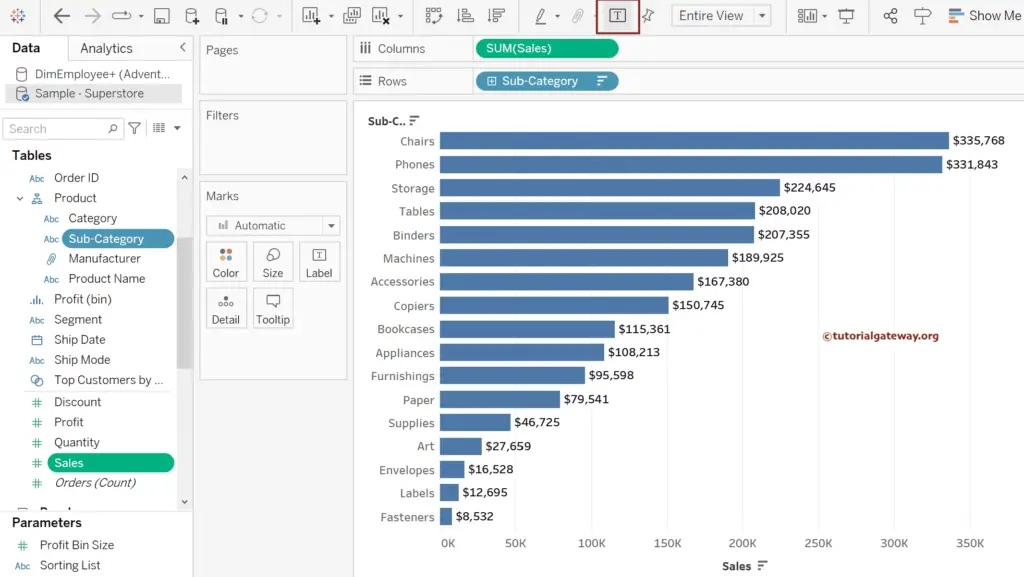
Drag and drop the Sales Measure to the Columns shelf and the Sub-Category dimension to the Rows Shelf. By default, it creates a Bar chart. If not, change the Mark type from Automatic to Bar. Please use the T button on the toolbar to add data labels. For the remaining charts in Tableau, please click here.
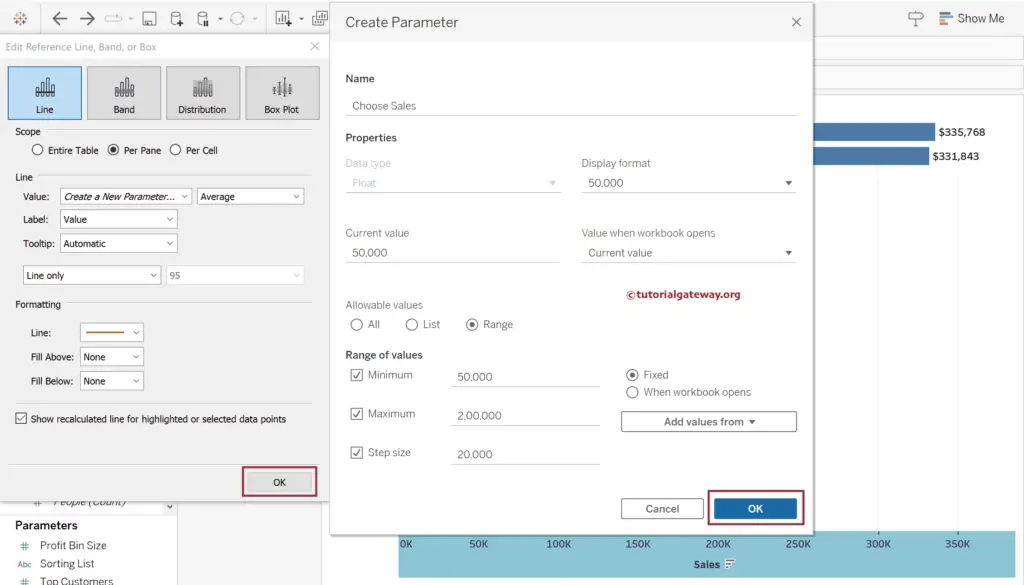
To fulfill this Tableau requirement, we need a parameter, and you can first create it and use (add) it later or create it within the Reference Line window. In this example, we follow the second option. Please refer to Reference Lines and Parameter articles to understand the detailed steps.
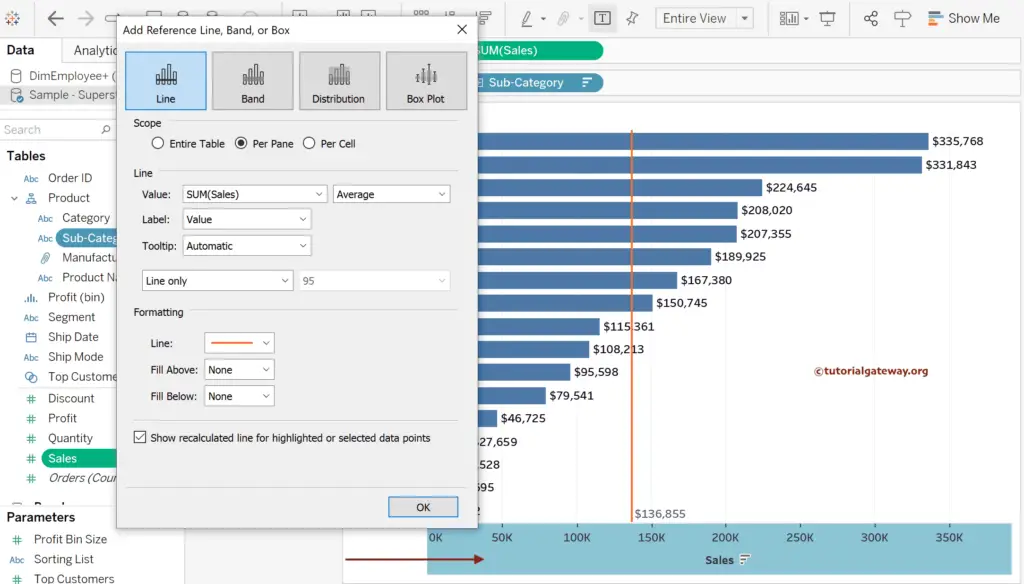
Right-click on the Sales Axis (X-Axis) and choose the Add Reference Line option, and it will open the following window. Please use this window to add reference lines to the bar chart. For the demonstration purpose, let me choose the per pane scope, value as the average of the sum of sales, and label it as value. Next, we used the orange line to show the sales average line and number. You can notice the same in the report as well.
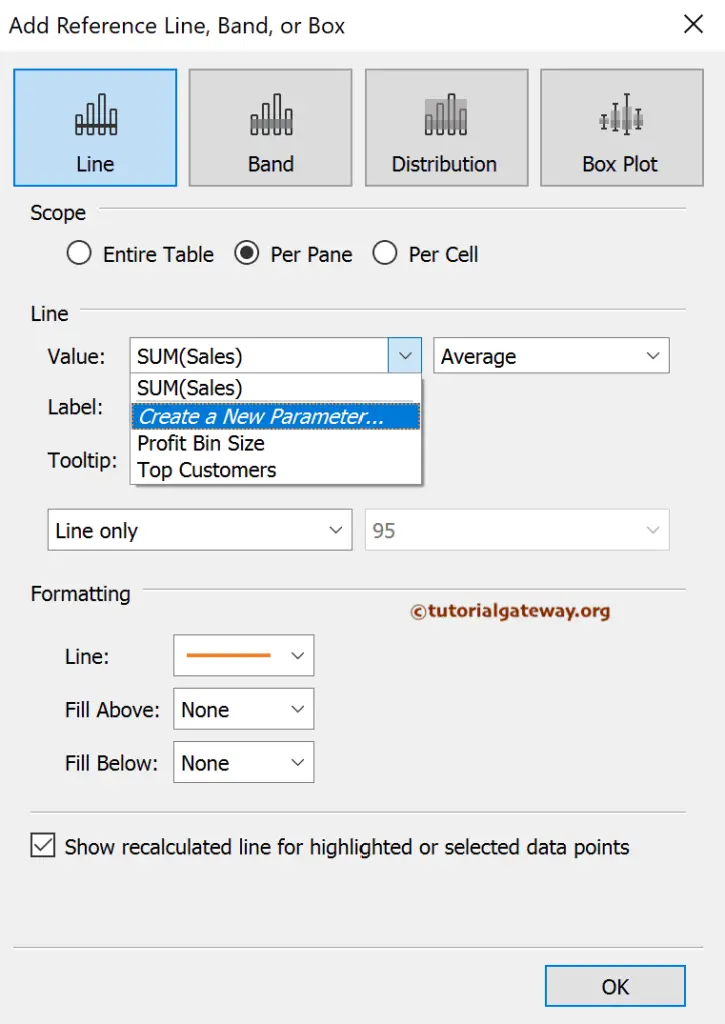
In this example, we aim to demonstrate how to add a Reference Line using the Tableau parameter. So, click the down arrow beside the Value drop-down box and choose Create a new Parameter option.
Please change the name to Choose Sales, the Data type to Float, and set the Allowable values to Range. Next, set the Minimum to 20000, the Maximum to 200000, and the step size to 20000. Please click OK to close the windows.
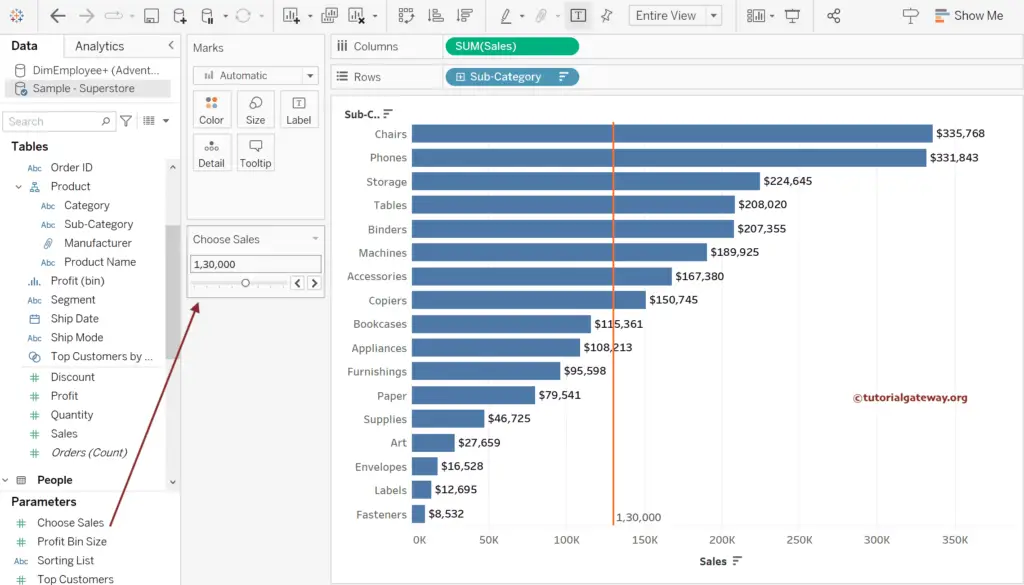
Click the down arrow beside the Country Param, and select the Show Parameter option to see them. Let me choose the sum of sales value as 130000 and see the reference line at that position.
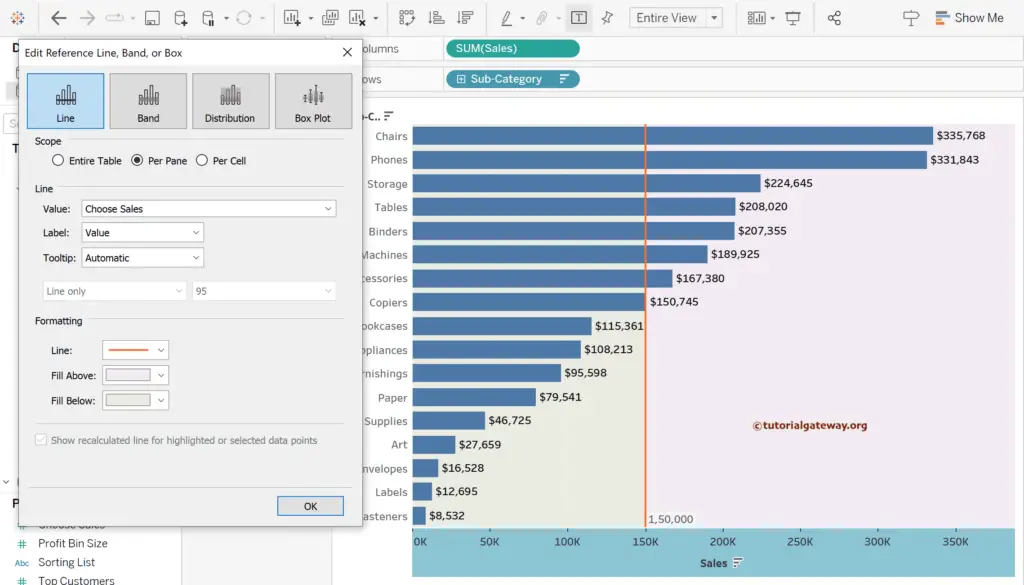
Right-click on the Sales Axis (X-Axis) and choose the Edit Reference Line option. Let me fill in the area above and below the reference line to show you the possibilities.
Using the Tableau toolbar, you can convert to the vertical column chart and the parameter and added. reference lines work intact.
