This Tableau article explains the data aggregation and the supporting aggregation function with an example. In general, when you drag the measures or numeric values, the desktop will aggregate them using the default aggregate function, i.e., SUM, to show the grouped data. However, there are some situations where we need a different function, such as average, count, minimum, maximum, etc. Tableau allows us to perform data aggregations on Dimensions (numeric data), and Measures allows you to change the default function from SUM to any other supporting function.
We used the Sample Superstore Excel sheet to demonstrate this Tableau Data Aggregation example. Please visit the Excel Source article to understand the Data Source.
Tableau Data Aggregation
Drag and drop the Category and Sub-Category dimensions to the Columns shelf. Next, drag the Sales Measure to the Rows shelf. When you drag any measure or numeric data type column to the report section (Columns, Rows, Marks, Filters, and Pages Shelf), Tableau will use the SUM default aggregate function to perform the data aggregation.
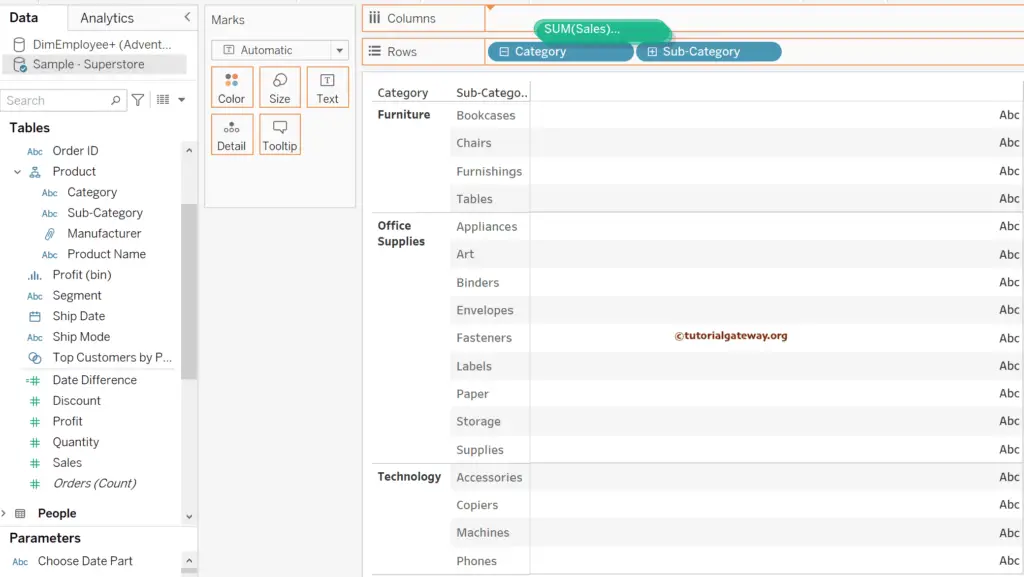
As you can see, it automatically creates a Side-by-Side Bar chart. If not, please change the mark type from Automatic to Bar. Next, add the Profit measure to the Color shelf and change the palette per the requirement. If you notice, the profit measure also used the default aggregate function SUM.
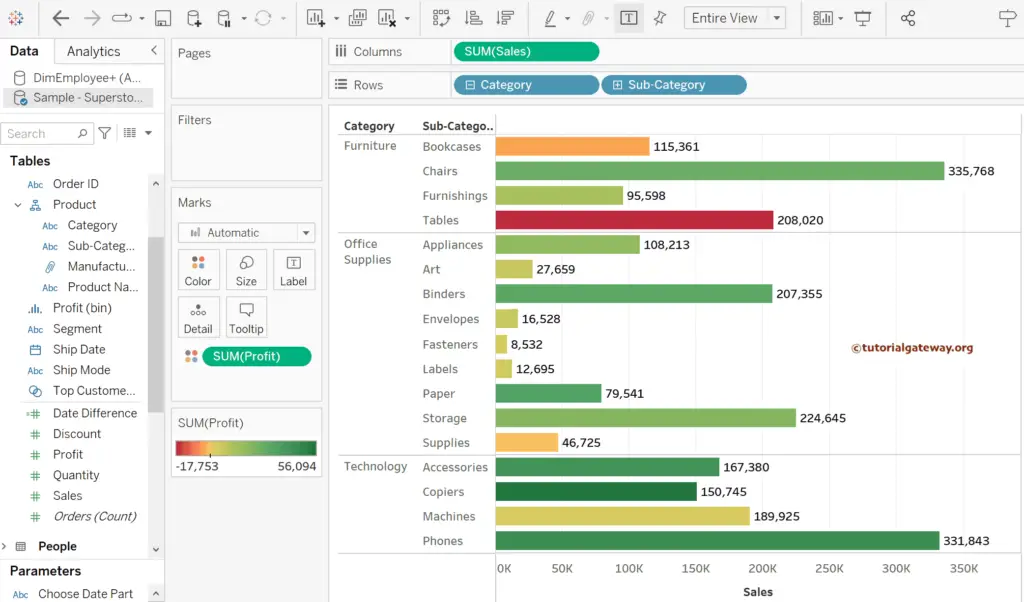
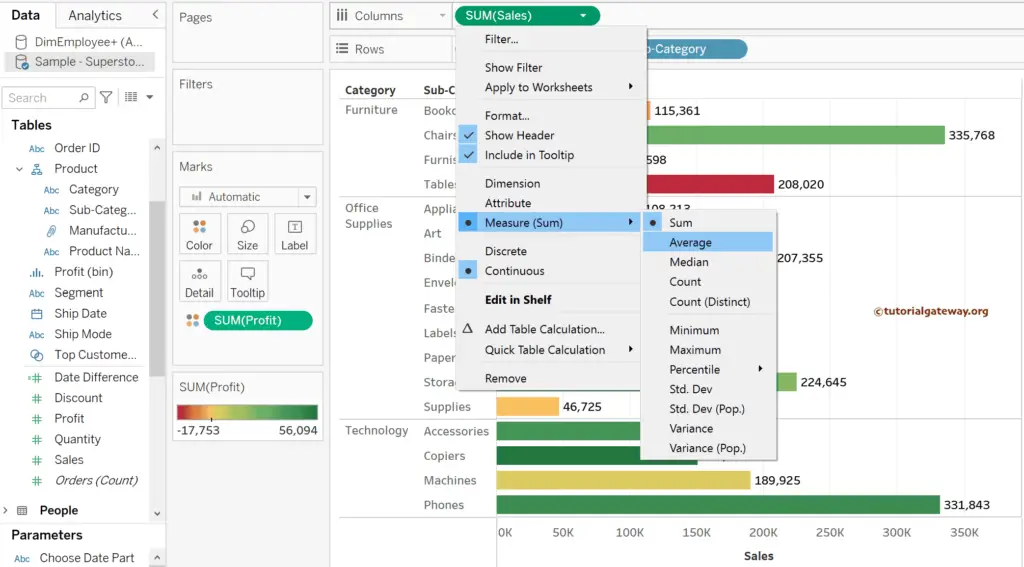
Tableau provides multiple ways to change the default data aggregation function, and one of the ways is to click the down arrow beside the SUM(Sales), select Measure, and choose the aggregate function. Let me select the Average.
Now you can see the Side-by-Side Bar chart showing the average sales of Category and Sub-Category dimensions. For the remaining charts in Tableau, please click here.
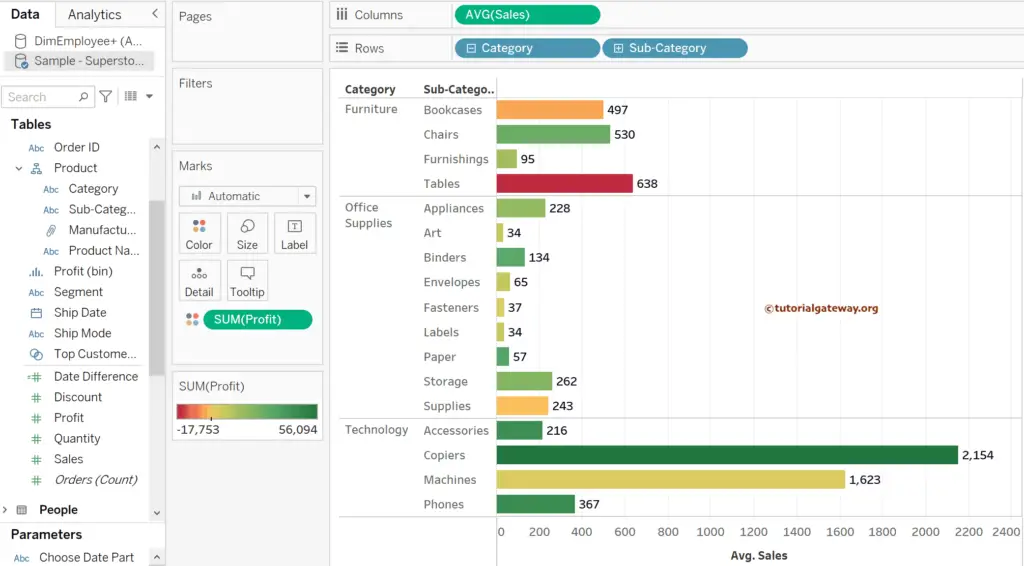
Change the Tableau Default Data Aggregation function
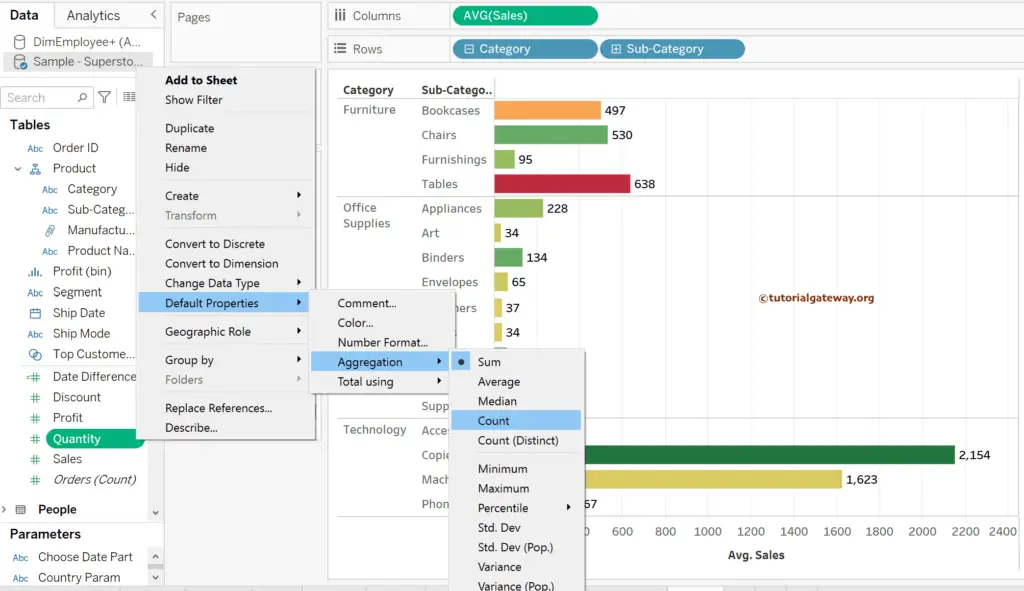
The above approach changes within the report, and it is helpful when you have to change the function for one time. However, in some situations, we use the Tableau default data aggregation function as the Average, Count, etc. In such scenarios, you must change the default Aggregation property of the Measure.
To do so, click the down arrow beside the Measure (Quantity) -> Default Property -> Aggregation -> Count. It means it uses the COUNT function whenever you add the Quantity Measure to the report instead of SUM.
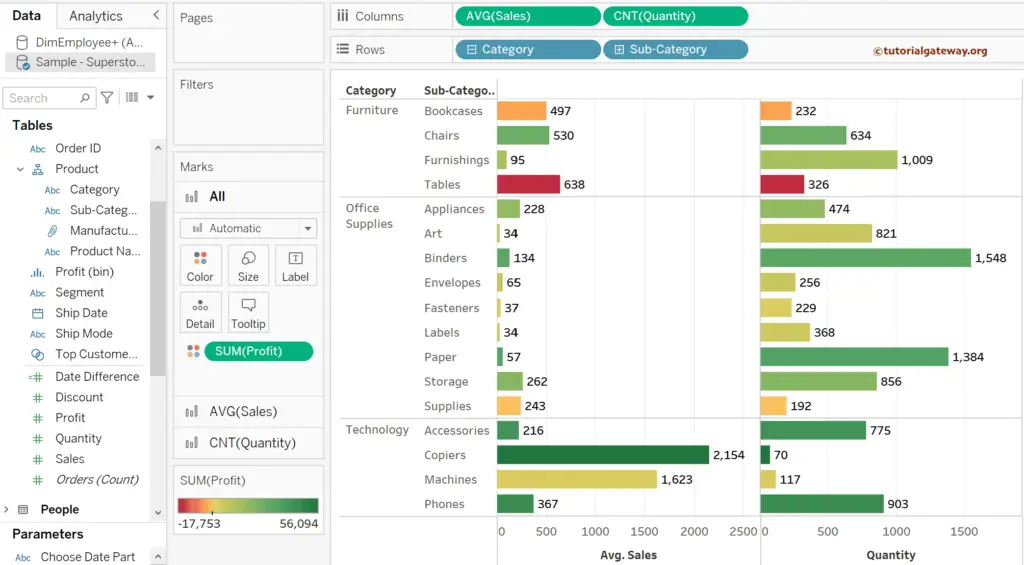
Drag and drop the Quantity Measure to the Columns shelf beside the Sales to demonstrate the same. You can notice the Quantity Count (CNT(Quantity)).
The Filters shelf will also allow you to choose the Aggregate function. Instead of using the default SUM, you can use any available function.
Tableau Data Aggregation of Dimensions
Apart from the Measure, Tableau allows you to change the default aggregate function of the dimension. Still, it has to be a numeric value. For the Dimensions, Maximum, Minimum, Count, and Count(Distinct) are the available functional options.
Let me drag the Order ID (Numeric) dimension to the Columns shelf, and clicking the down arrows shows the Dimension is selected. Please choose the Measure and select the Count as the aggregate function.
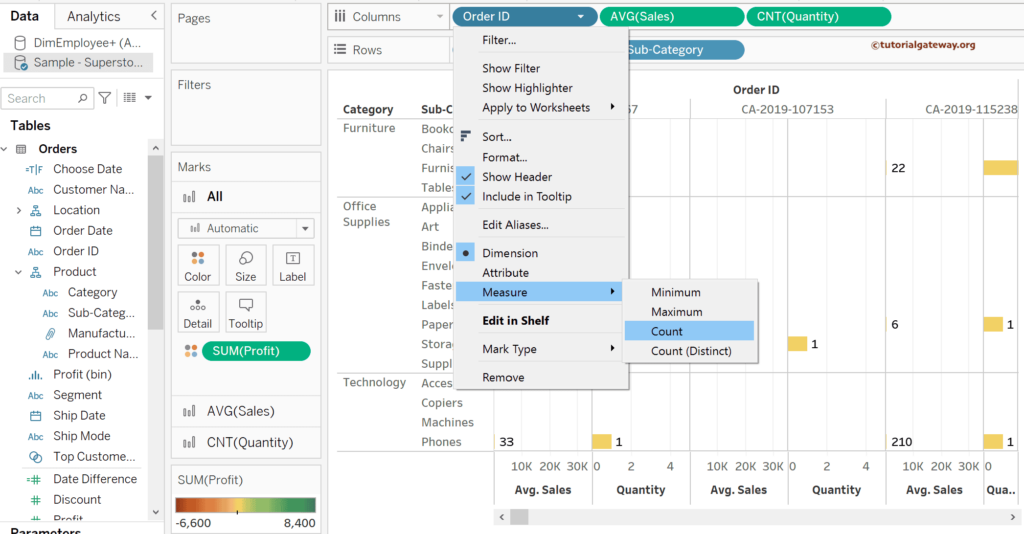
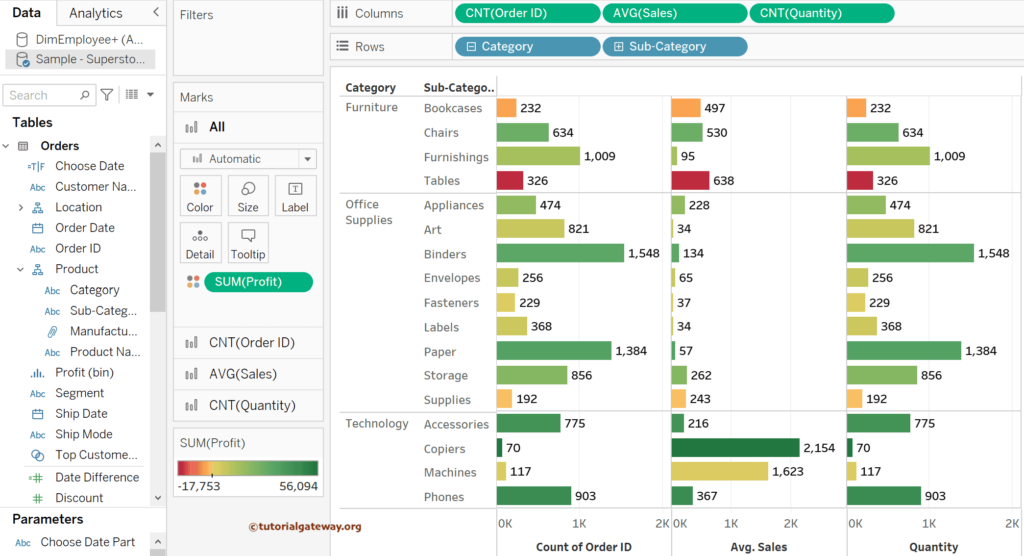
The screenshot below shows the data with changed default aggregations of the measures and dimensions.
Let me show you what happens if you want to apply aggregation to text data. To do so, we must first convert it into Measurement, as shown below.
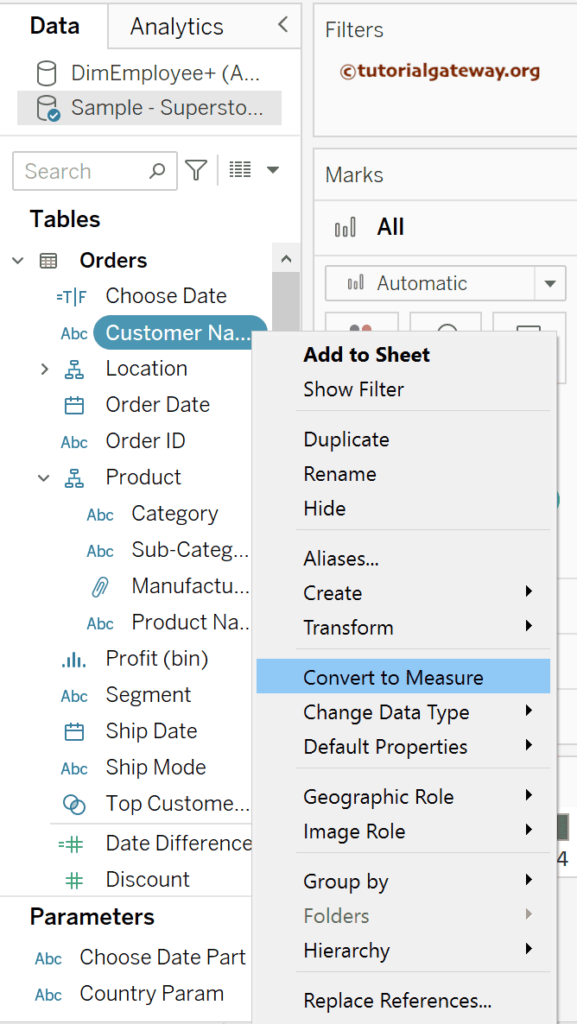
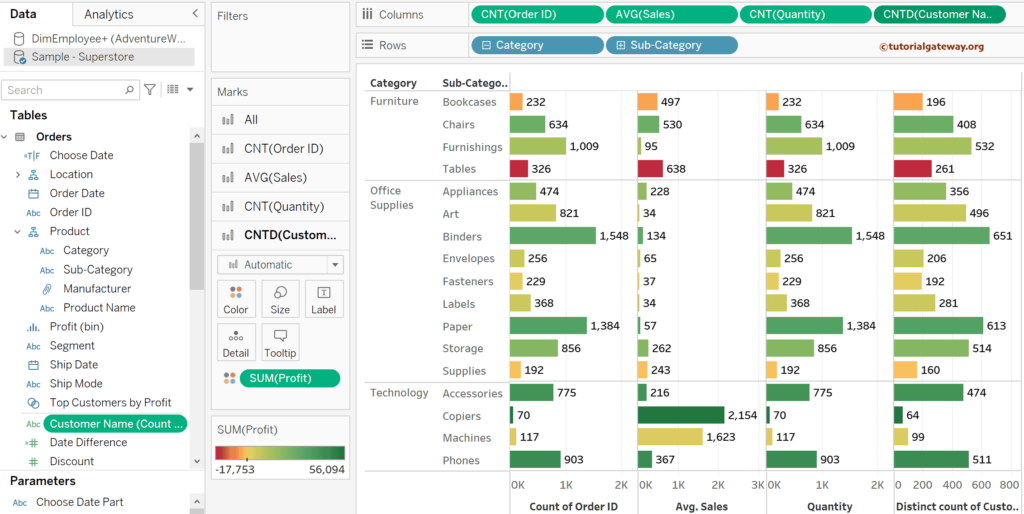
Tableau automatically chooses the default data aggregation. Let me add that Count distinct customer names using the COUNTD function to the report.
Calculated Fields
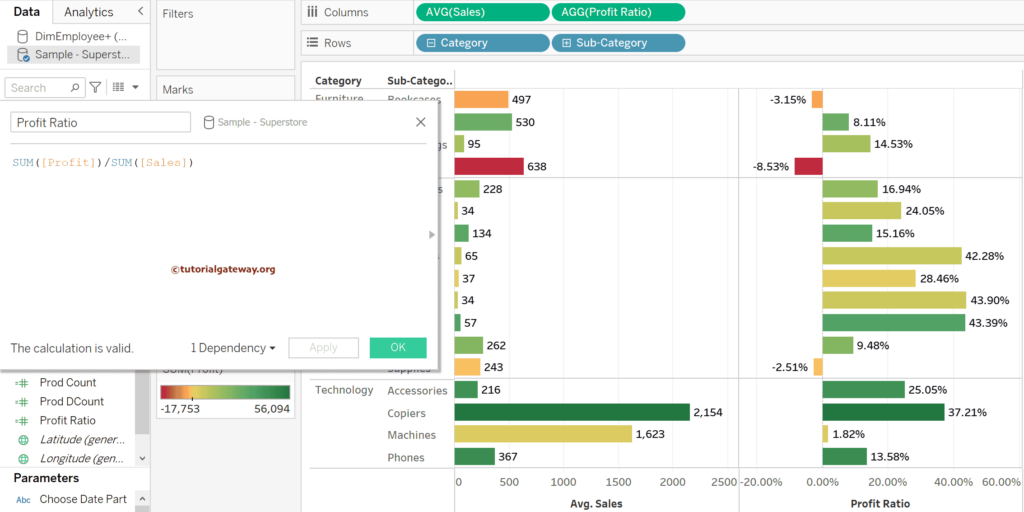
You can’t change the data aggregation for the calculated field. Let me add the below-calculated field to the columns shelf to show the same.
SUM([Profit])/SUM([Sales])
