Tableau provides various Aggregate Functions, which help you to perform aggregations such as calculating the sum, avg, minimum, maximum, etc. In this article, we will show you how to use Aggregate Functions with examples.
To demonstrate these Tableau Aggregate Functions, we are going to use the data source that we created in our previous article. So, Please visit Data Labels in the Reports article.
Tableau Aggregate Functions
The following examples will show you the list of Aggregate Functions.
Tableau Sum Function
The Tableau Sum function is used to find the Sum of records in a column and the basic syntax of this aggregated Sum is as shown below:
SUM(Expression)
To demonstrate these Tableau functions, we have to use the Calculated Field. Please navigate to Analysis Tab and select the Create Calculated Field… option to create a calculated field.
Once you click on the Create Calculated Field… option, the following window will be opened. Here, we renamed the default calculation name as Sum_Of_Sales. As you can see from the below screenshot, while I was typing, the aggregate calculation window is showing the function suggestions.
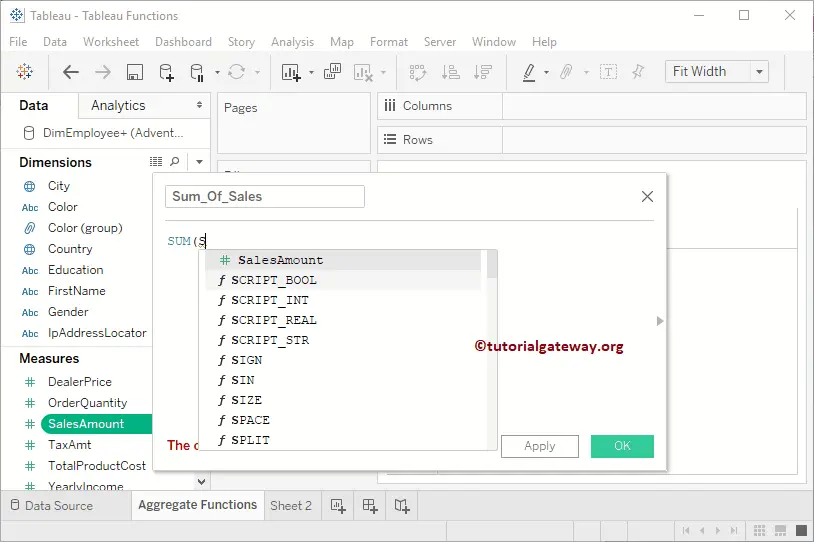
For the demo purpose, we will calculate the Sum of the Sales Amount. By clicking the OK button, a new field called Sum_Of_Sales will create. And the final Code of the Tableau aggregated Sum function is
SUM([SalesAmount])
Now you can see our newly created Sum calculated field. Let me create a Bar Chart by dragging Country to Columns Shelf, Sum_Of_Sales (new calculated field) to Rows shelf, and Country to Colors shelf.
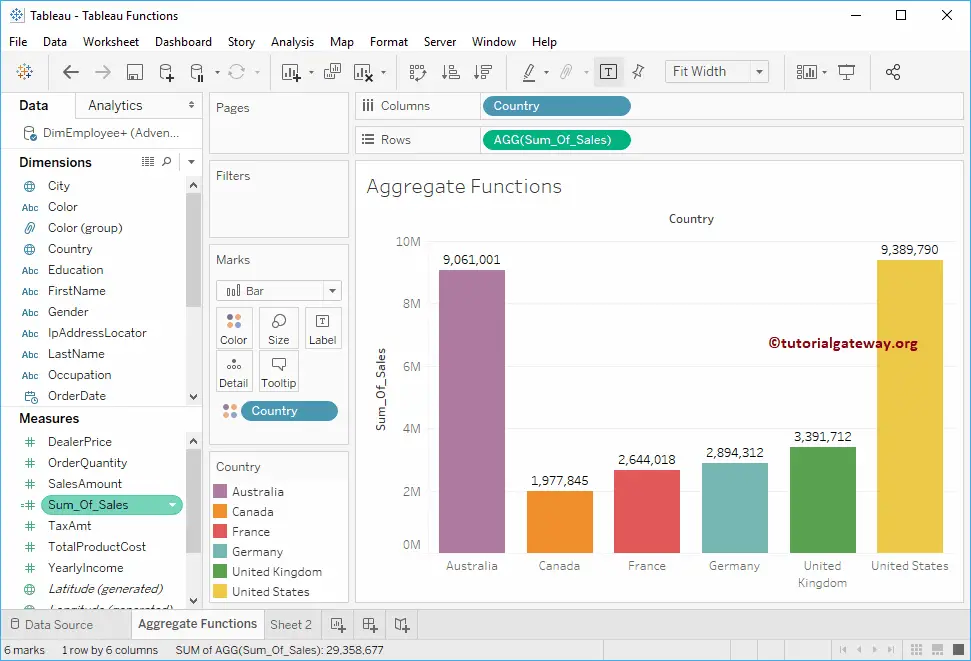
Tableau Avg Function
The Tableau Avg or average function is used to calculate the Average and the syntax of this is as shown below:
AVG(Expression)
As you can see from the below screenshot, we are creating a new field (Sales Average) using the aggregate function.
AVG([SalesAmount])
Click OK to close the window. Let me replace the Sum of Sales in the Rows shelf with this Sales Average field.
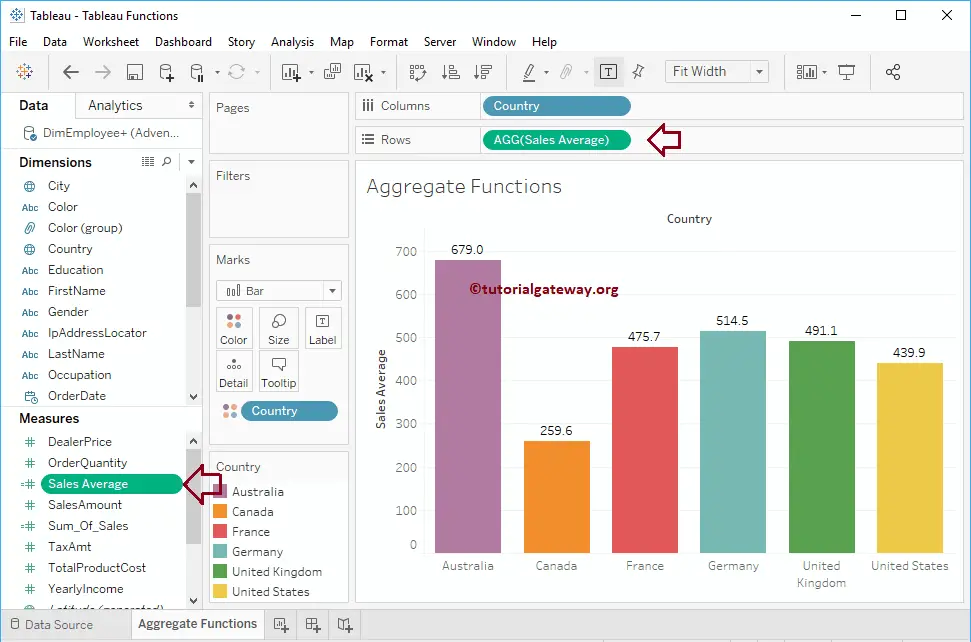
Tableau MIN Function
The Tableau MIN is an aggregate function, which is used to find the minimum value and the syntax of this is as shown below:
MIN(Expression)
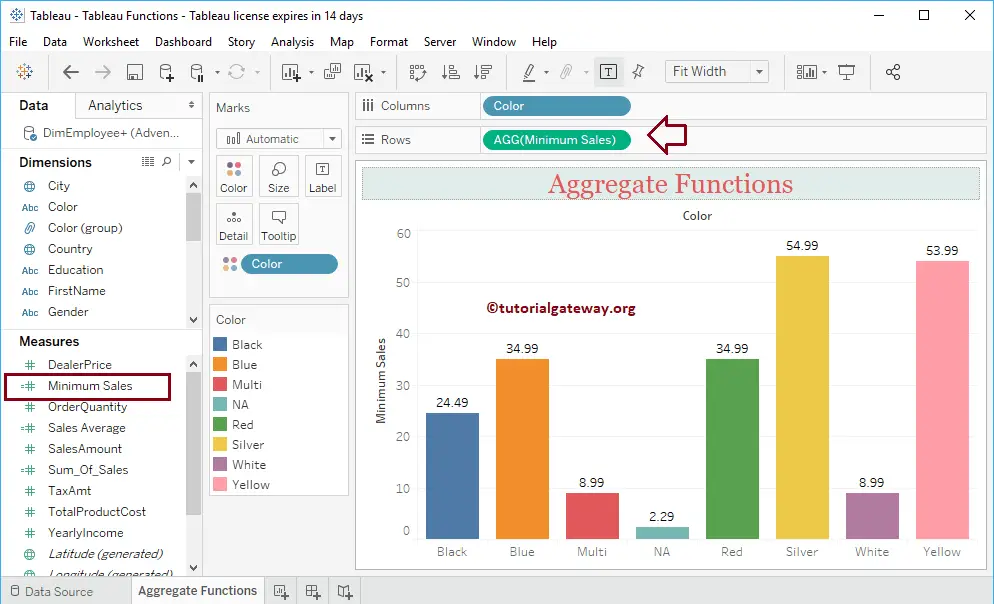
As you can see from the below screenshot, we are creating a field called Minimum Sales.
MIN([SalesAmount])
Let me place the Minimum Sales on the Rows shelf, and the Color dimension on Columns Shelf.
The Tableau MIN function accepts two arguments. Use this to find the smallest between two numbers. Syntax is:
MIN(Expression1, Expression2)
Here, we created a new field, Minimum_Sales_Cost, to find the lowest value between the Sales Amount and Total Cost. Let me add Minimum Sales_Cost, SalesAmount & Total Product Cost to the chart
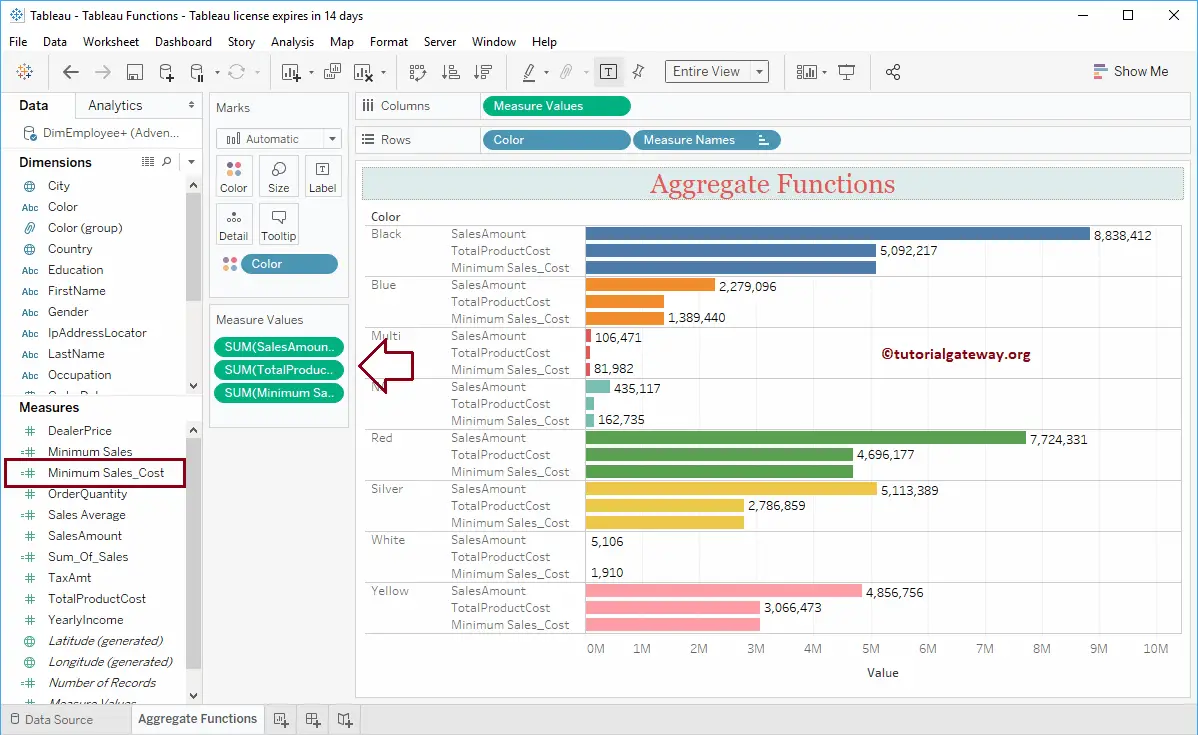
Tableau MAX Function
The MAX function is used to find the maximum value and the syntax of this MAX aggregate is as shown below:
MAX(Expression)
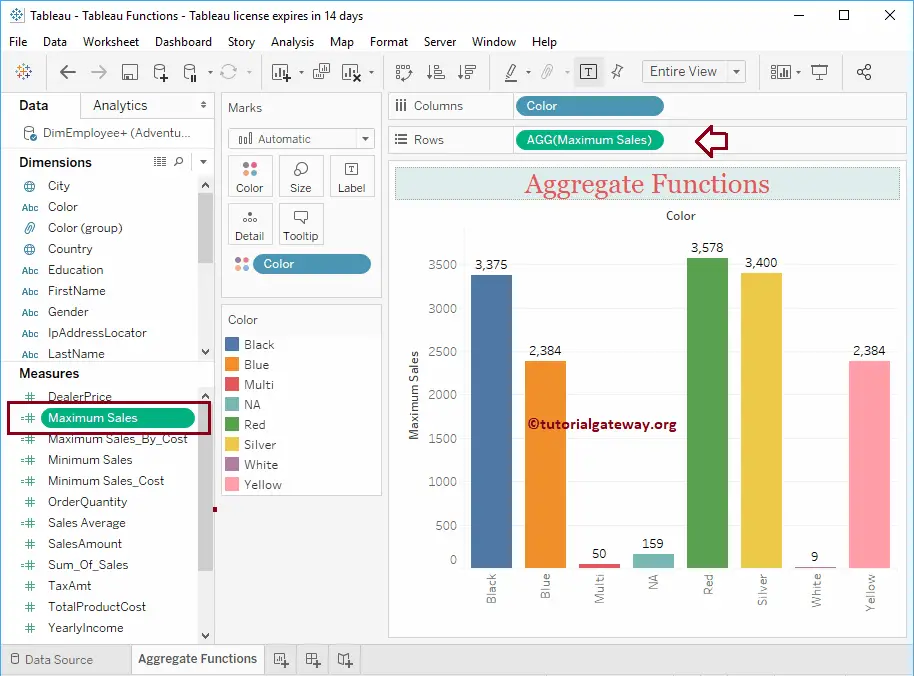
You can see that we are creating a field called Maximum Sales.
MAX([SalesAmount])
Let me replace the Minimum Sales field in the Rows shelf with the Maximum Sales field.
The MAX function accepts two arguments. Use this to find the largest among two numbers. Syntax is:
MAX(Expression 1, Expression 2)
Here, we created a new field, Maximum_Sales_By_Cost, to find the largest value among the Sales Amount and Total Product Cost. Let me add Maximum Sales_By_Cost, SalesAmount, and Total Product Cost to the chart
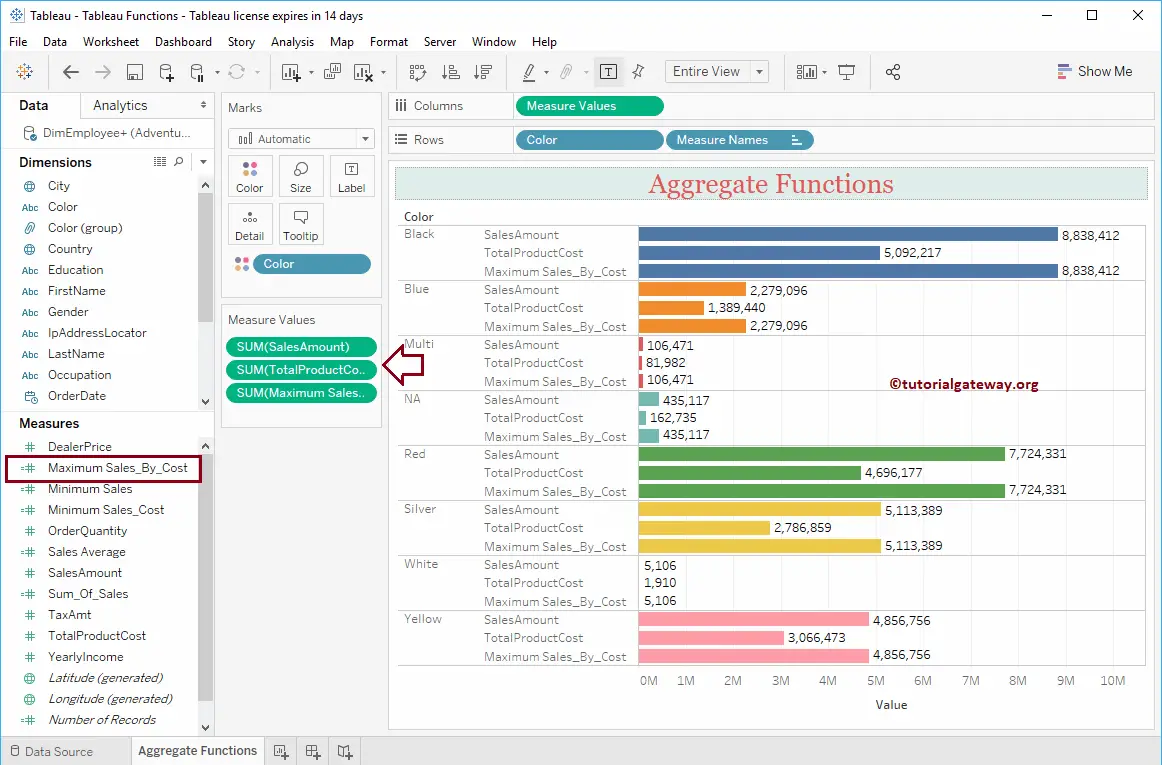
Tableau VAR Function
The Tableau VAR is an aggregate function, which is used to find the Variance of the sample population. The syntax of this VAR is as shown below:
VAR(Expression)
Here, we are creating a new field called Sales_Variance.
VAR([SalesAmount])
Click OK to close the window
Tableau VARP Function
The VARP function is useful to find the Variance of the entire population and the syntax of the VARP aggregate is :
VARP(Expression)
Let me create a new field called Sales_PVariance.
VARP([SalesAmount])
Click OK to close the window. Let me add those two variances VAR and VARP to the column chart
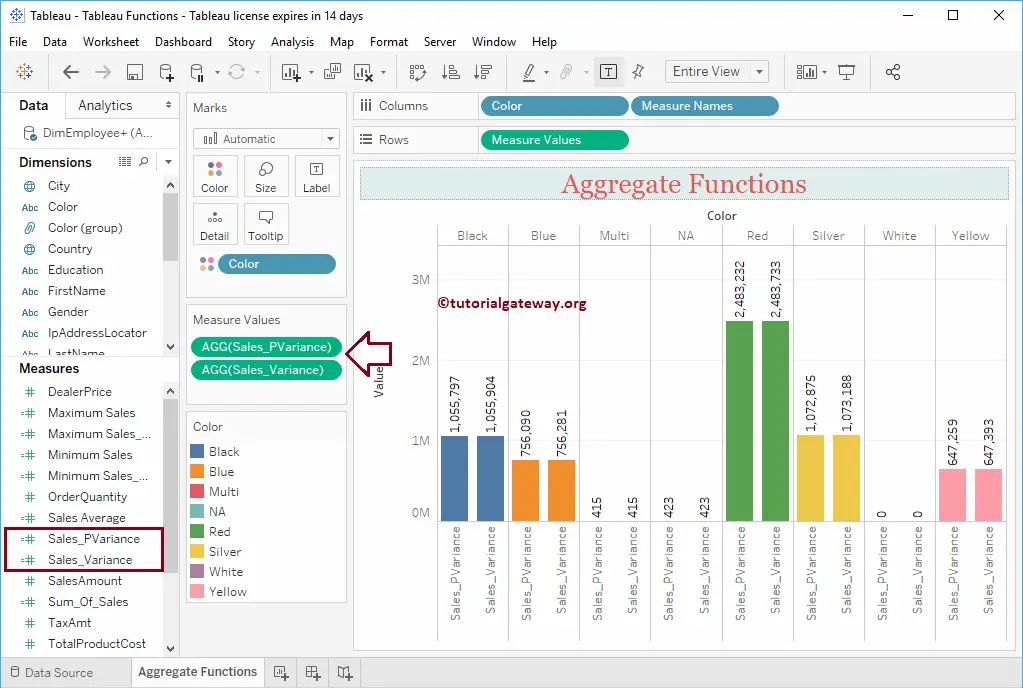
Tableau STDEV Function
The STDEV is one of the aggregate functions in Tableau, which is useful to find the standard deviation of the sample population. The syntax of this STDEV is as shown below:
STDEV(Expression)
Here, we are creating a new field called Sales_StdDeviation.
STDEV([SalesAmount])
Click OK to close the window.
Tableau STDEVP Function
This aggregate function is for finding the standard deviation of the entire population and the syntax of this STDEVP is:
STDEVP(Expression)
Let me create a new field called Sales_StdDeviationP.
STDEVP([SalesAmount])
Let me add those two standard deviations, STDEV and STDEVP, to the column chart.
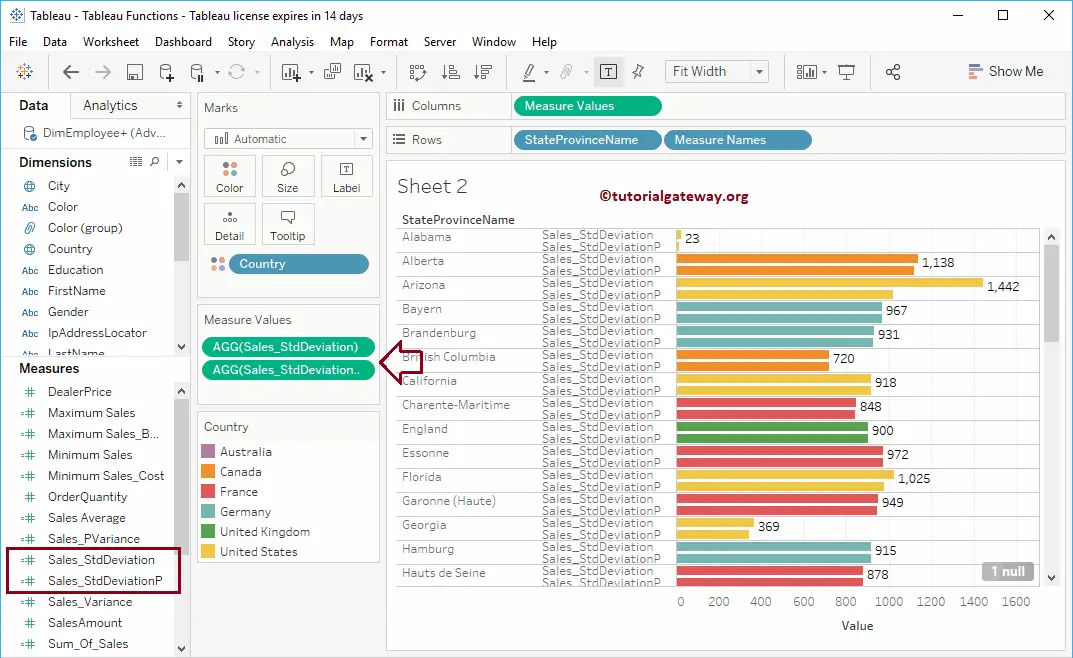
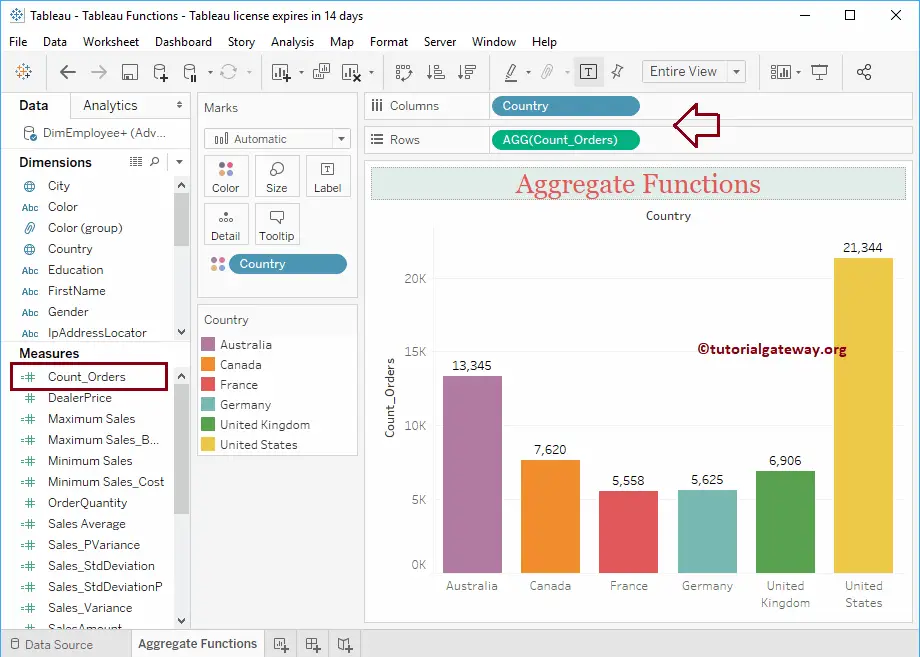
Tableau COUNT Function
The COUNT is one of the Tableau aggregate functions, which is useful to find the number of not null values. The syntax of this COUNT is as shown below:
COUNT(Expression)
Here, we are creating a new field called Count_Orders.
COUNT([OrderQuantity])
Click OK to close the window. Let me add this to Tableau Count Row Field.
TIP: Use the Tableau COUNTD function to get a distinct count.