In Tableau, there are two aggregate functions called COUNT() and COUNTD() to count and distinct count the records in a Table or a particular section (category or segment). Although they sound the same, the result will differ in most cases.
- COUNT() – It will count and return the total number of rows or items in a given column, group, or category. It will not calculate the NULL values.
- COUNTD() – The Tableau COUNTD function will count the unique number of rows in a measure or dimension to write a distinct combination. You can use the COUNTD() to avoid duplicates.
The syntax for using the Tableau Count and Distinct Count is shown below.
COUNT(Column or Expression) - Non-unique


COUNTD(Column or Expression) - Distinct
Neither of the functions will count the NULL values. This article shows how to use these Tableau COUNT() and distinct COUNTD() functions to count the Measures and Dimensions and compare the results with an example.
Tableau Distinct COUNTD and COUNT Functions Examples
We use the Order ID column in the Sample Superstore Excel sheet to demonstrate this Distinct Count aggregate function to find the total orders.
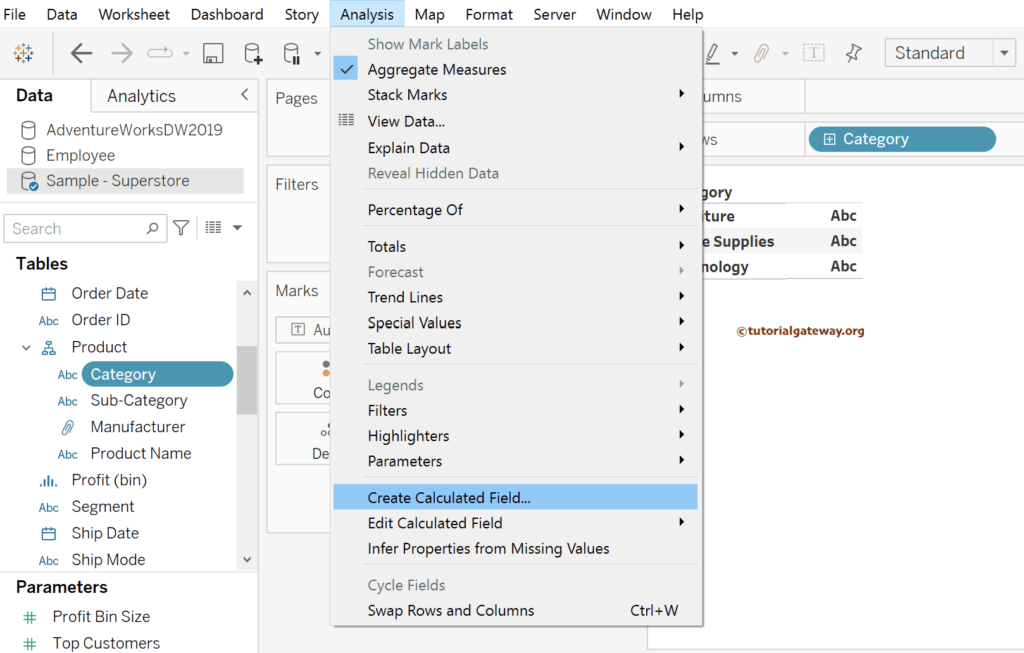
First, drag and drop the Category Dimension to the Rows Shelf, and next, we must create a calculated Field to write an expression. To do this, use the Analysis Menu and select the Create Calculated Field.. option. For more Aggregate Functions or the remaining Functions, please check the Tableau tutorial.
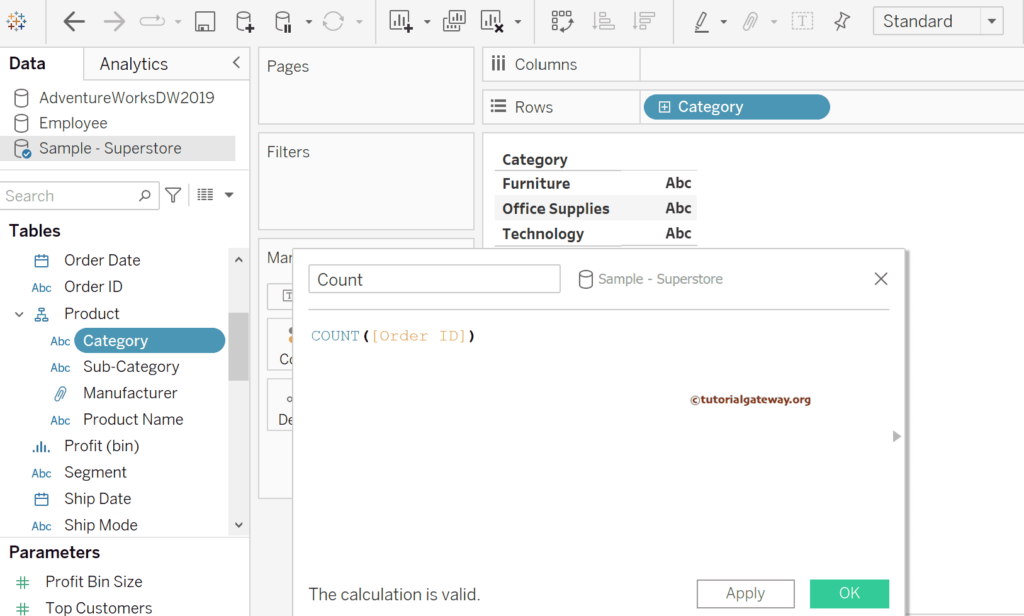
In the expression below, we used the COUNT() function to count the total number of orders in each category.
COUNT([Order ID])
The Tableau expression below uses the COUNTD() function to distinctly count the total number of unique orders in each category.
COUNTD([Order ID])
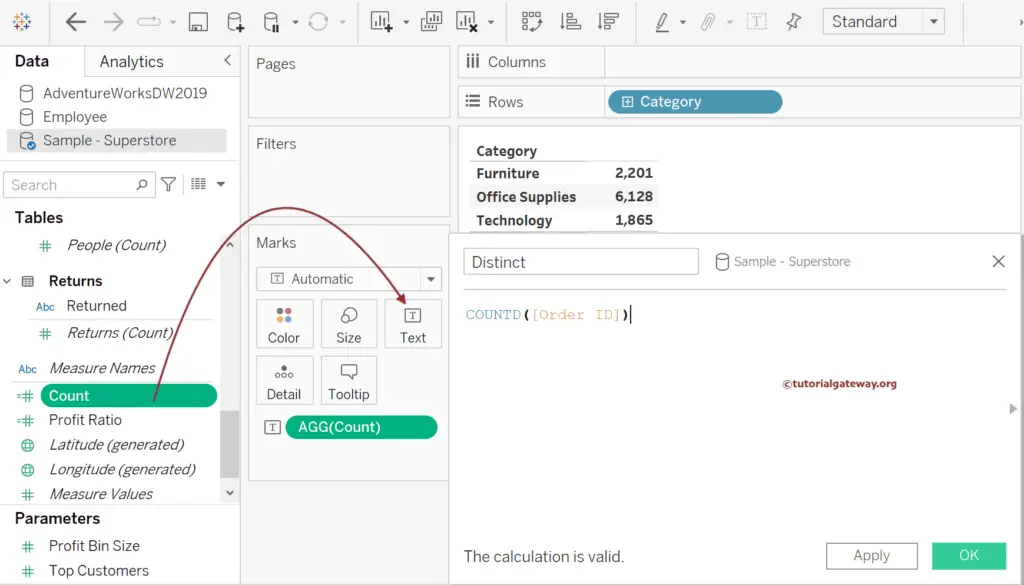
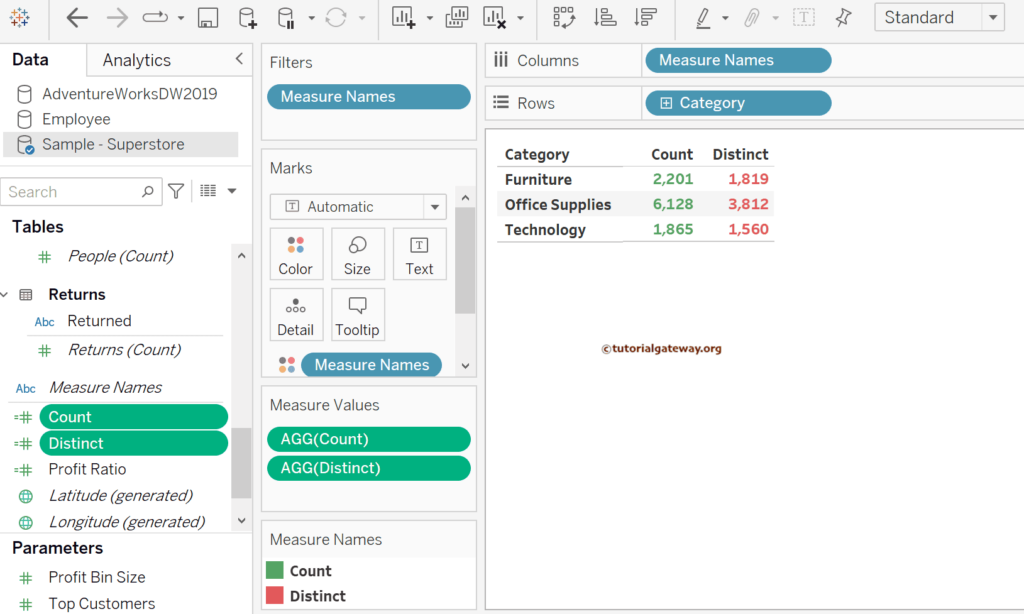
Double-click the newly created calculated fields to add them to the Measure Values. Next, add the Measure Names to the Color shelf to distinguish the difference.
If you observe the below report, the results of the two newly created calculated fields are different for Furniture, Office Supplies, and Technology. A few customers may have repeated orders, so the Tableau COUNT() function returns all the orders, and COUNTD() returns distinct or unique orders.
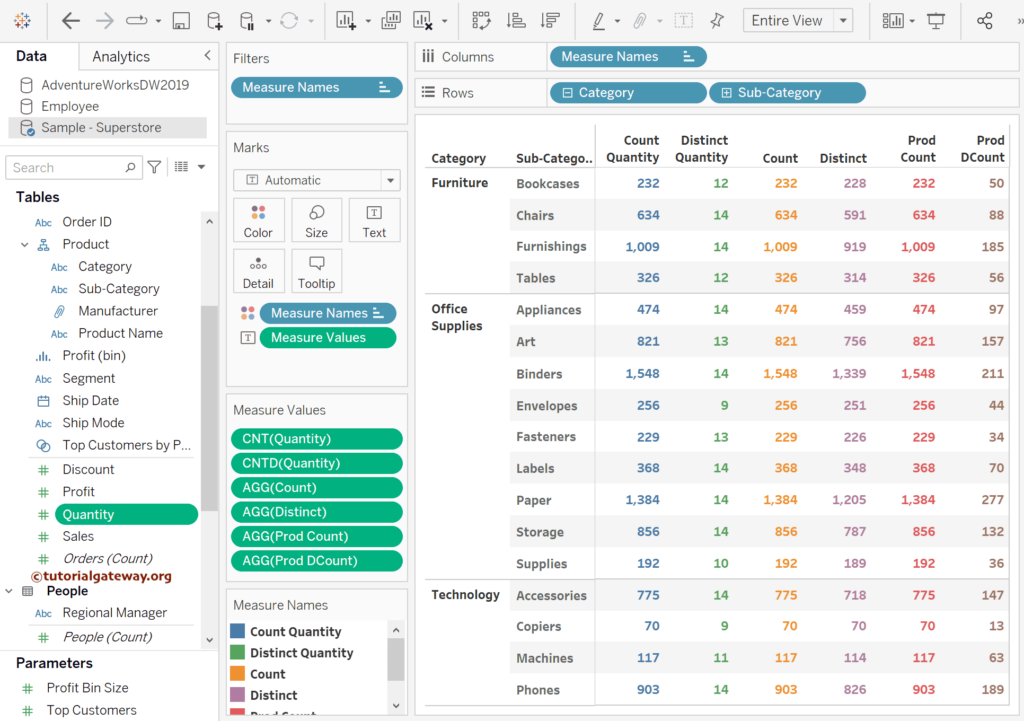
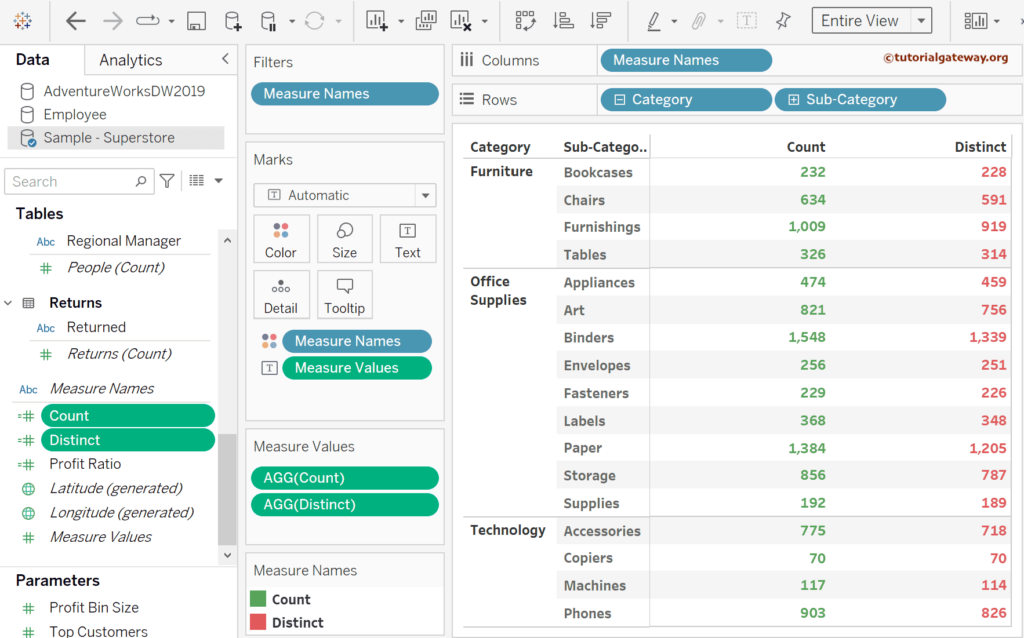
Expanding the category by clicking the Plus button lets you see the difference in the sub-category level. Suppose you observe the Count and Distinct values of the Copiers (Technology). In that case, the number is the same because there are no repeated orders.
Like the above, let me create two more Tableau calculated fields to count and count the product names for each subcategory distinctly. Please add the below code in separate fields.
COUNT([Product Name])

COUNTD([Product Name])
Next, add these two fields to the table by double-clicking them.
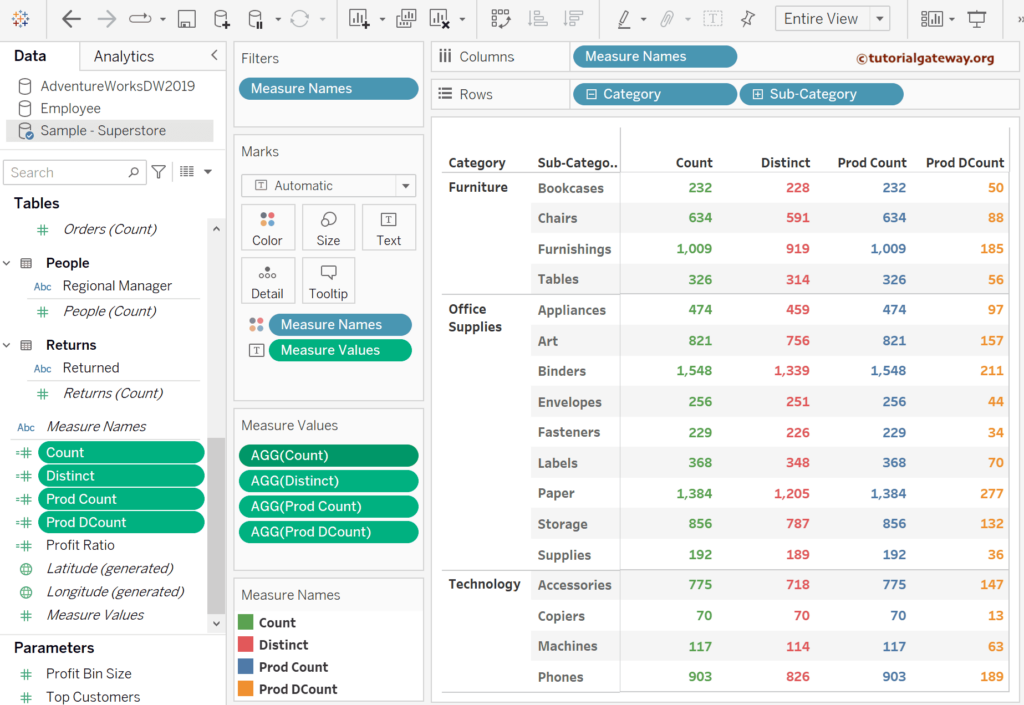
Tableau Count and Distinct Count Measures Example
As both are aggregated functions, using COUNT() and COUNTD() on measures is straightforward. Please drag and drop the Quantity or any Measure value and click the down arrow. Next, change the Measure from default Sum to Count.
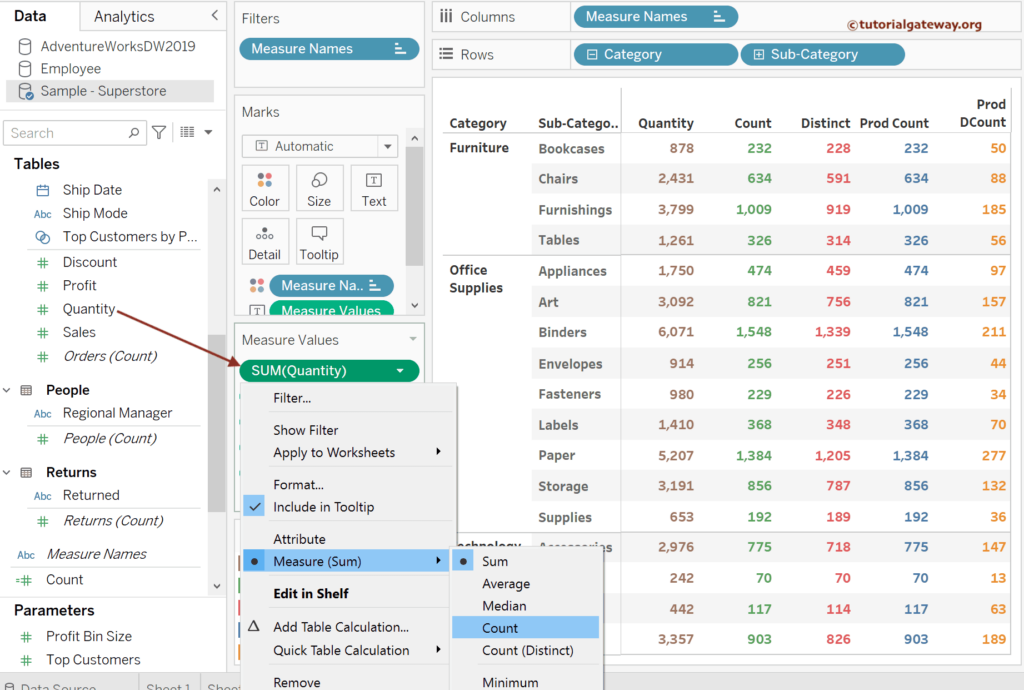
Similarly, add Quantity again and change the Measure calculation from Sum to Count (Distinct). Next, please check the Tableau image below to see the distinct count of order quantities for each subcategory. For instance, the total order quantity for Bookcases is 232, and the unique or distinct orders are 12.
