The Power BI SUM function is a DAX aggregate function that adds all the numeric values in a given column to find the total or sum of those records. This article explains the DAX SUM function to perform the aggregation and return a single decimal number.
In real-time, it is very helpful to calculate the total cost, sales, orders, expenses, budget, tax, etc. The syntax of the Power BI DAX SUM function is as shown below:
SUM(<ColumnName>)
As we mentioned earlier, the SUM function works on numeric columns (measures); to assign the total result, we need a Measure. So, within the Home tab, click the New Measure button to write the expression. It will create a new measure on the selected table. Use the whitespace to write the DAX expression.
Power BI DAX SUM Function Example
Please rename the Measure name as per the requirement. Let me name it the Total Sales and type SU after the equals operator. The Power BI IntelliSense will show the suggestions, and once you select the DAX SUM() function, it will show the definition or the operation it performs.

To demonstrate the DAX SUM() function, let me use the SalesAmount column from the FactInternetSales table to obtain the total sales.
The final expression generated by the desktop or written manually is. Please refer to the Aggregate and DAX functions article for the remaining Power BI functions.
Total Sales = SUM(FactInternetSales[SalesAmount])
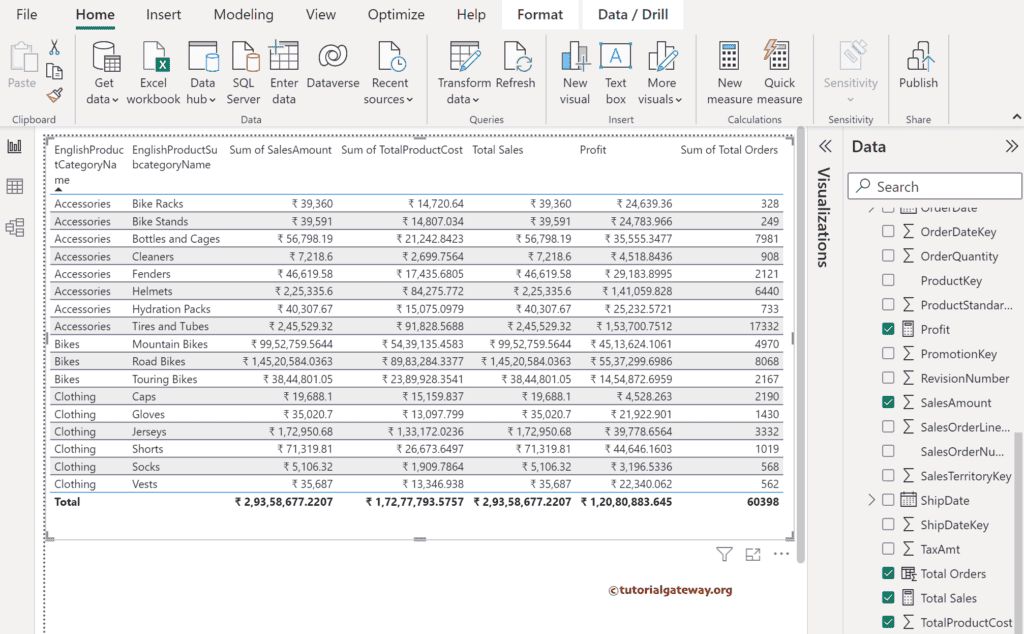
Please add the new SUM() measure to the table report. For more charts >> Click Here!

Let me create a card to display the total result and a Bar chart to show the sum of sales by product category.

Apart from the Home tab, you can use the below tabs to create a Measure for writing the Power BI DAX SUM Function.
- Measure Tools -> New Measure
- Table Tools -> New Measure and New Column options
- Modeling -> New Measure and New Column options
Clicking the New Column button in the Modeling tab or Table Tools will create a Calculated Column. For any calculated column, the aggregation will apply at the time of report; otherwise, it acts as a natural (regular) column. Let me create a Calculated column to find the sum of orders. Don’t forget to click the Commit button.
Total Orders = FactInternetSales[OrderQuantity]

If you use the expression below, the result will be 4 billion, which is wrong.
Total Orders = SUM(FactInternetSales[OrderQuantity])
Calculating the Profit
Apart from calculating the total, you can use the Power BI DAX SUM function to find the profit. To do so, we must subtract the total product cost from the total SalesAmount.
Profit = SUM(FactInternetSales[SalesAmount]) - SUM(FactInternetSales[TotalProductCost])
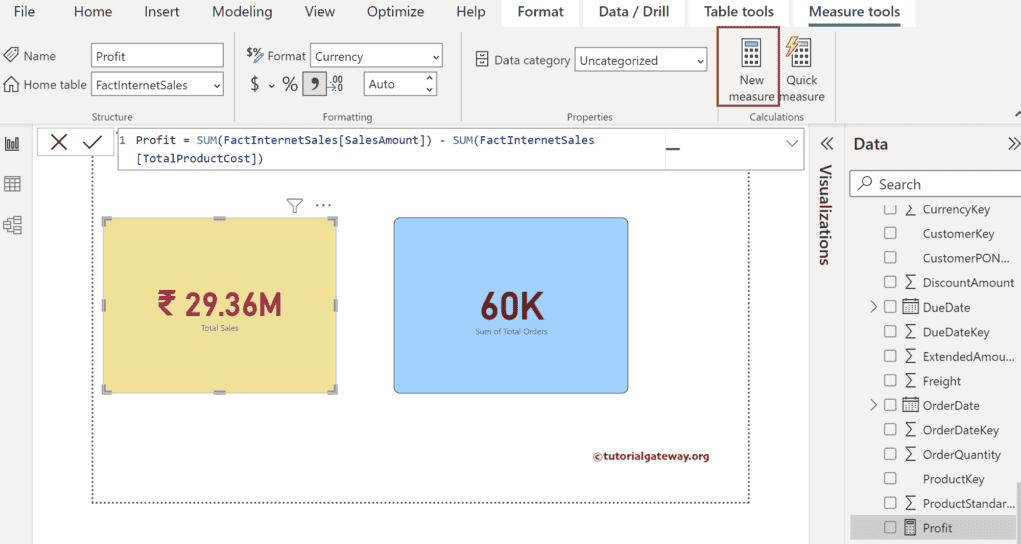
Create one more card to show the profit.
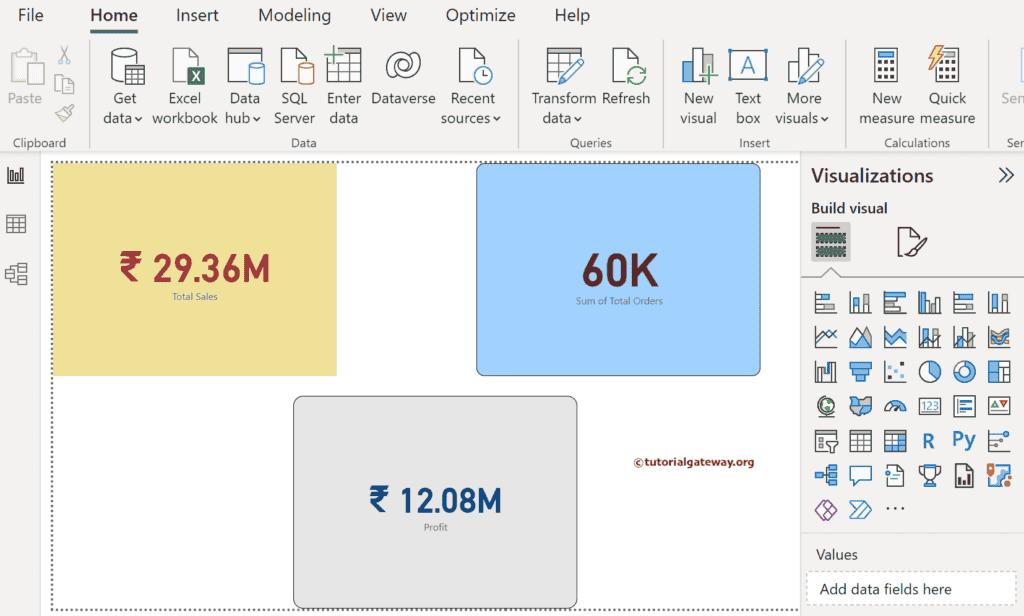
Please add the results of the Total Sales, Profit, and the Sum of Total orders to the table report.