How to use DAX Aggregate Functions in Power BI with examples? Microsoft Power BI DAX provides various Aggregate Functions, which allow us to perform aggregations such as calculating sum, average, minimum, maximum, etc.
To demonstrate these Power BI DAX aggregate functions, we will use the below-shown data. As you can see, there are 15 records in this table.

Power BI DAX Aggregate Functions
The following examples show the list of DAX Aggregate Functions.
Power BI DAX Sum Function
The DAX SUM function calculates the total or Sum of records in a column and the DAX Sum Function syntax is
Measure Name = SUM(Expression or Column Name)
To demonstrate these DAX aggregation functions, we have to use Measures. To create a measure, please click on the New Measure option under the Power BI Home tab or Modeling tab.
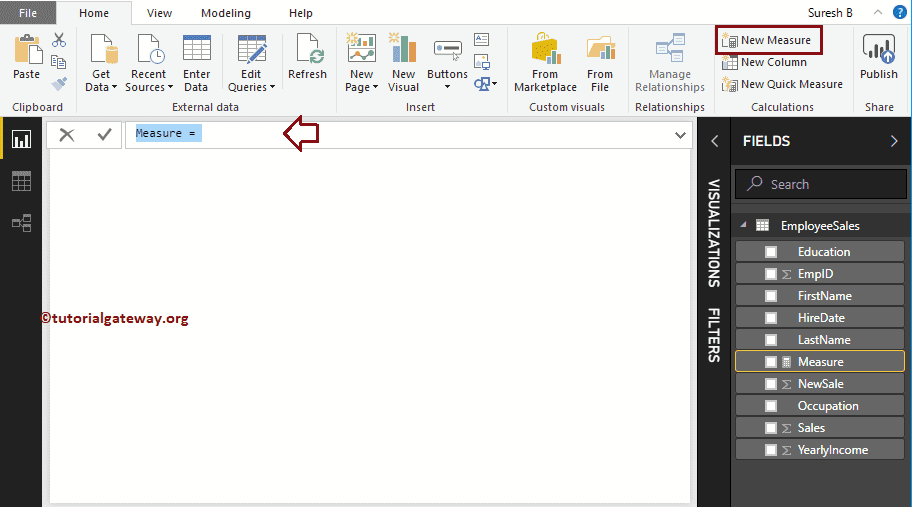
We renamed the default measure name as Sales Sum. As you can see from the screenshot below, while I was typing, IntelliSense is showing the suggestions.
Let me select the DAX SUM function. For the DAX Aggregate Functions demo purpose, we will calculate the Sum of Sales in this table.
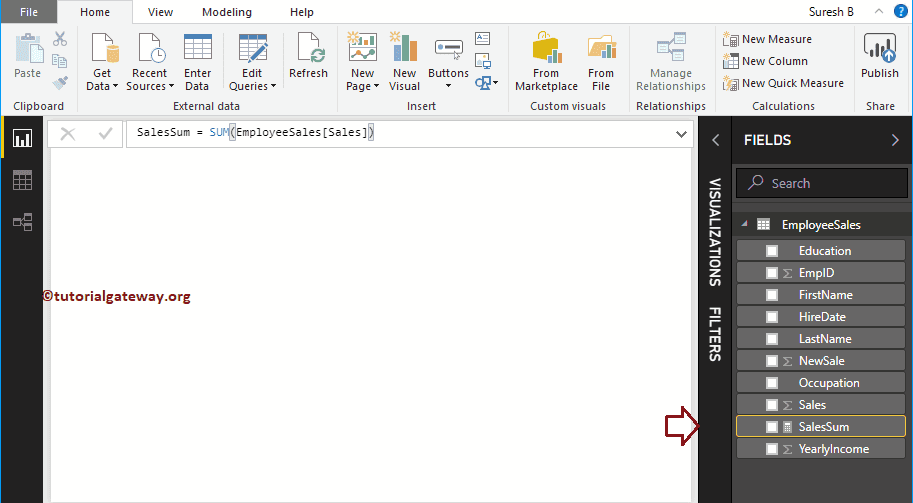
By clicking the enter or any key, a new Measure called SalesSum was created. And the final Power bi dax sum group by example Code is
SalesSum = SUM(EmployeeSales[Sales])
Let me create a Card using this Measure. Please refer to Create a Card and Format Card articles to understand the steps involved in creating and formatting cards.

DAX Average Function
The Power BI DAX Average function is used to calculate the Average of records in a column. The DAX Average Function syntax is
Measure Name = AVERAGE(Expression or Column Name)
As you can see from the screenshot below, we created a Measure (named AVGSale) to calculate the Sales column average. And the Code is
AVGSale = AVERAGE(EmployeeSales[Sales])
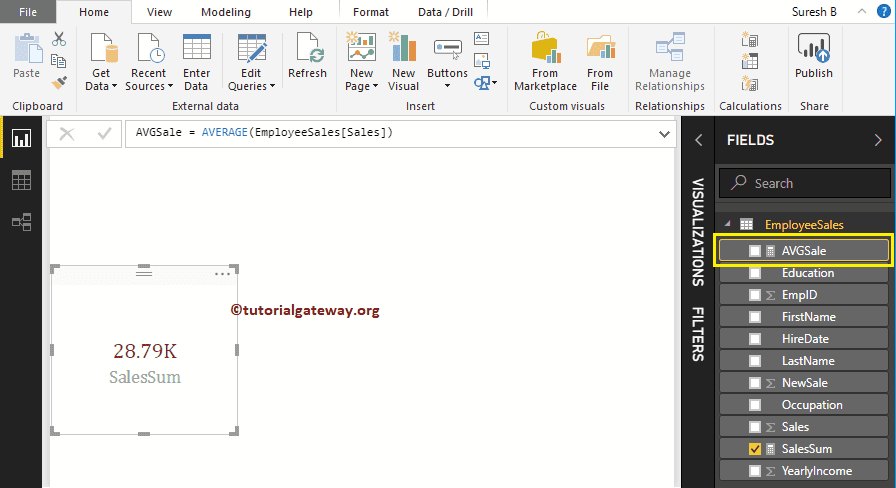
Next, let me create a Card using this Average Measure.
DAX MIN Function
The Power BI DAX MIN function finds the Minimum value in a column. The syntax of the DAX MIN Function is
Measure Name = MIN(Expression or Column Name)
As you can see from the below screenshot, we created a Measure (named MinSale) to find the Minimum Sales amount in the Sales column. And the Code is
MinSale = MIN(EmployeeSales[Sales])
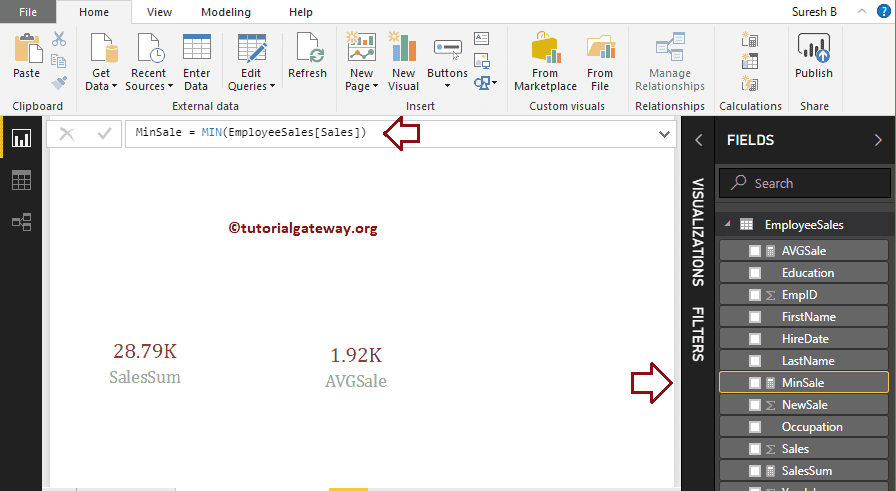
Next, let me create a Card using this Minimum Measure.
DAX MAX Function
The DAX MAX function finds the Maximum value in a column. The syntax of the DAX MAX Function is
Measure Name = MAX(Expression or Column Name)
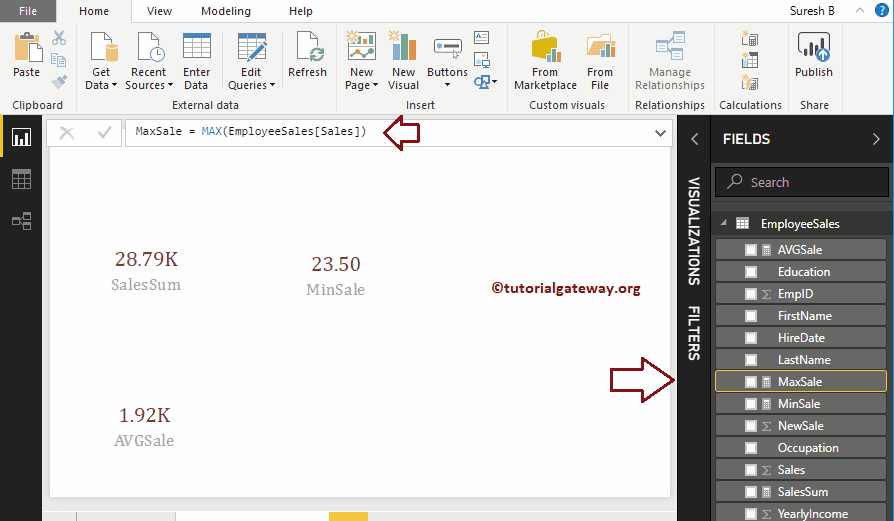
Here, we created a Measure (named as MaxSale) to find the Maximum Sales amount in the Sales column. And the Code is
MaxSale = MAX(EmployeeSales[Sales])
Power BI DAX COUNT Function
The DAX COUNT function counts the number of records in a column. The syntax of the DAX COUNT Function is
Measure Name = COUNT(Expression or Column Name)
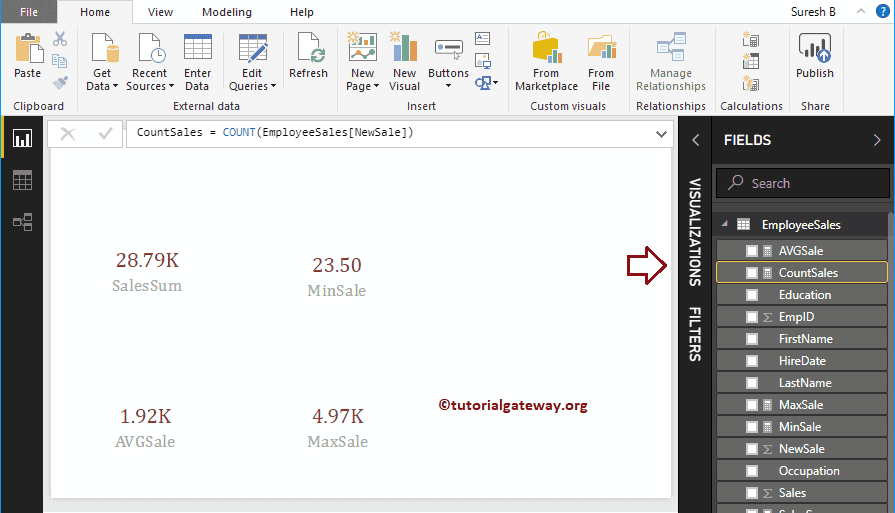
Here, we created a Measure (named as CountSale) to count the number of records in the New Sales column. And the Code is
CountSales = COUNT(EmployeeSales[NewSale])
DAX VAR.S Function
The DAX VAR.S function finds the statistical Variance of complete records. The Power BI DAX VAR.S Function syntax is
Measure Name = VAR.S(Expression or Column Name)
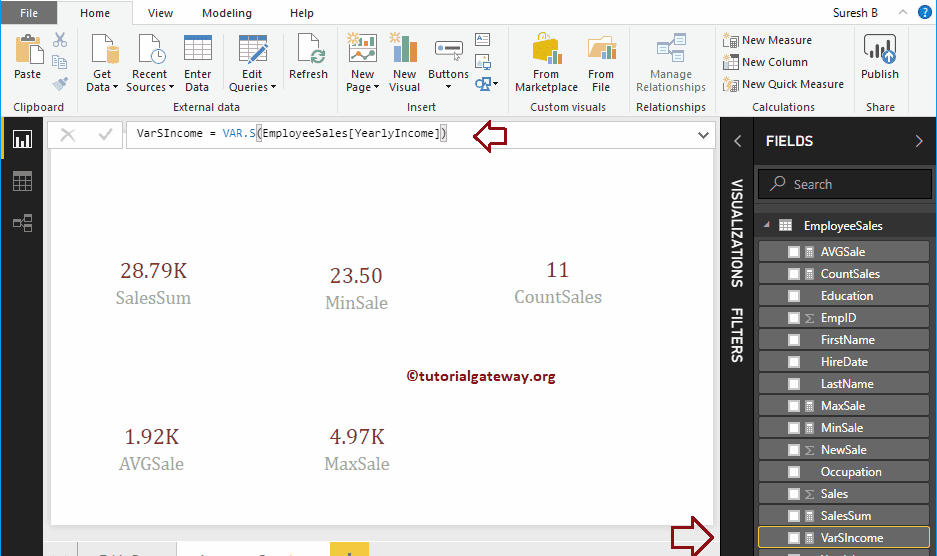
Here, we created a Measure (named as VarSIncome) to find the statistical Variance of a Yearly Income column. And the Code is
VarSIncome = VAR.S(EmployeeSales[YearlyIncome])
DAX VAR.P Function
The Power BI DAX VAR.P function finds the statistical variance of selected or some records. The syntax of the DAX VAR.P Function is
Measure Name = VAR.P(Expression or Column Name)
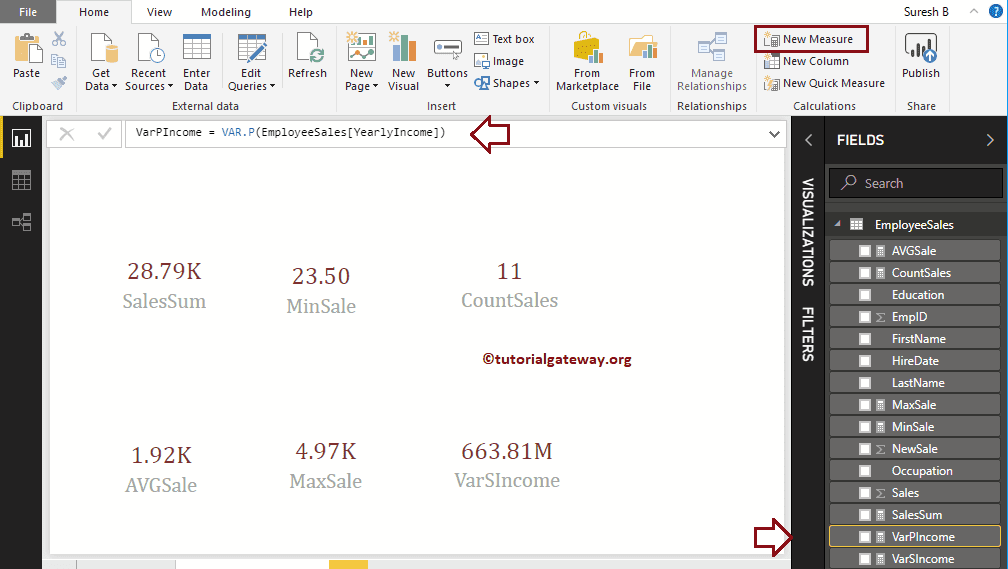
Here, we created a Measure (name as VarSIncome) to find the statistical P Variance of a Yearly Income column. And the Code is
VarPIncome = VAR.P(EmployeeSales[YearlyIncome])
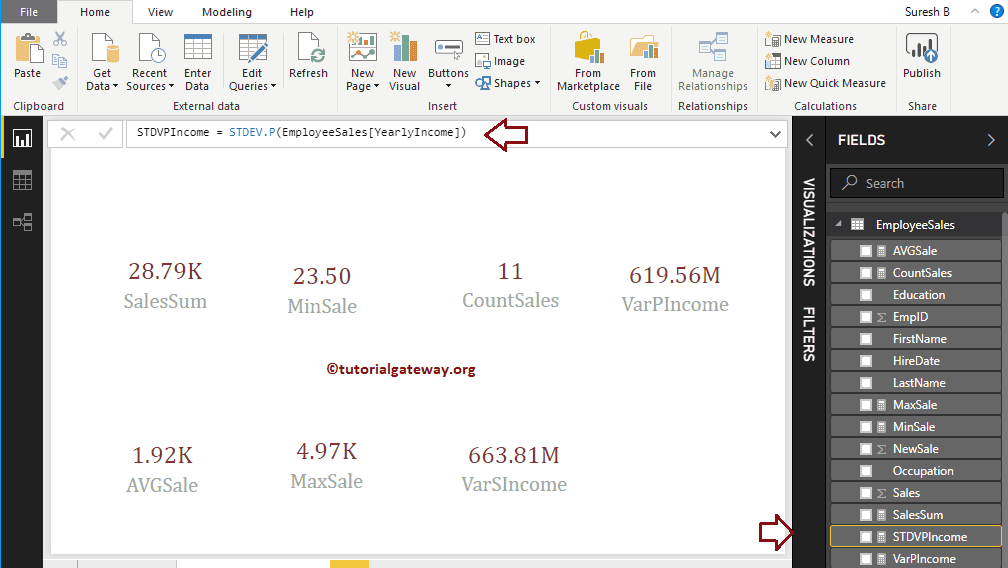
Power BI DAX STDEV.P Function
The DAX STDEV.P function finds the standard deviance of selected records. The syntax of the DAX STDEV.P Function is
Measure Name = STDEV.P(Expression or Column Name)
Here, we created a Measure (named as STDEVPIncome) to find the standard deviance of a Yearly Income column. And the Code is
StdevPIncome = STDEV.P(EmployeeSales[YearlyIncome])
Power BI DAX STDEV.S Function
The DAX STDEV.S function finds the standard deviance of complete records. The syntax of the DAX STDEV.S Function is
Measure Name = STDEV.S(Expression or Column Name)
Here, we created the Measure (named as STDEVSIncome) to find the standard deviance of a Yearly Income column. And the Code is
StdevSIncome = STDEV.S(EmployeeSales[YearlyIncome])
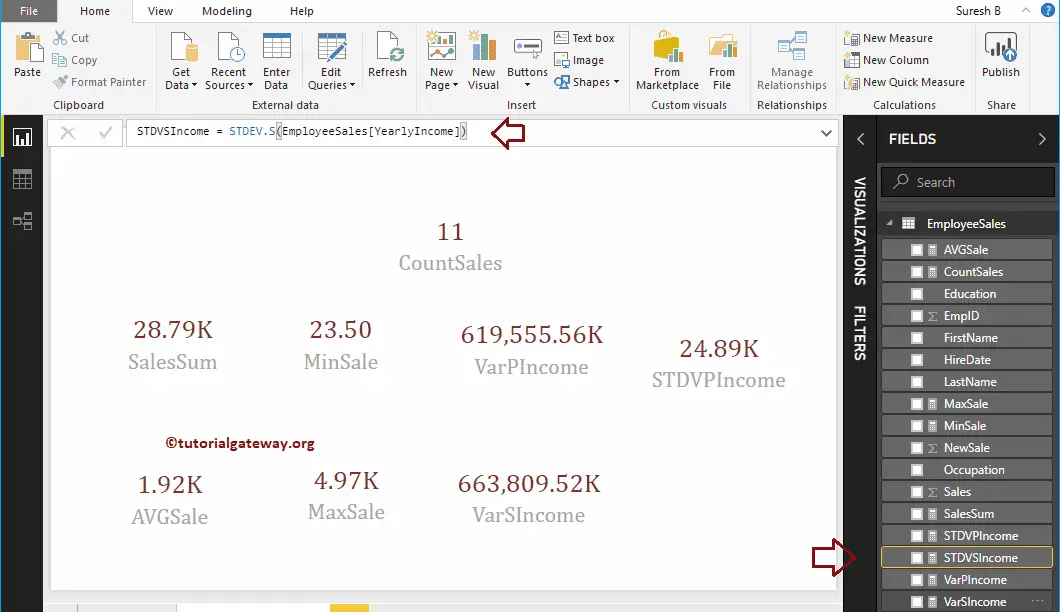
Let me create a new card for the Standard Device Measure

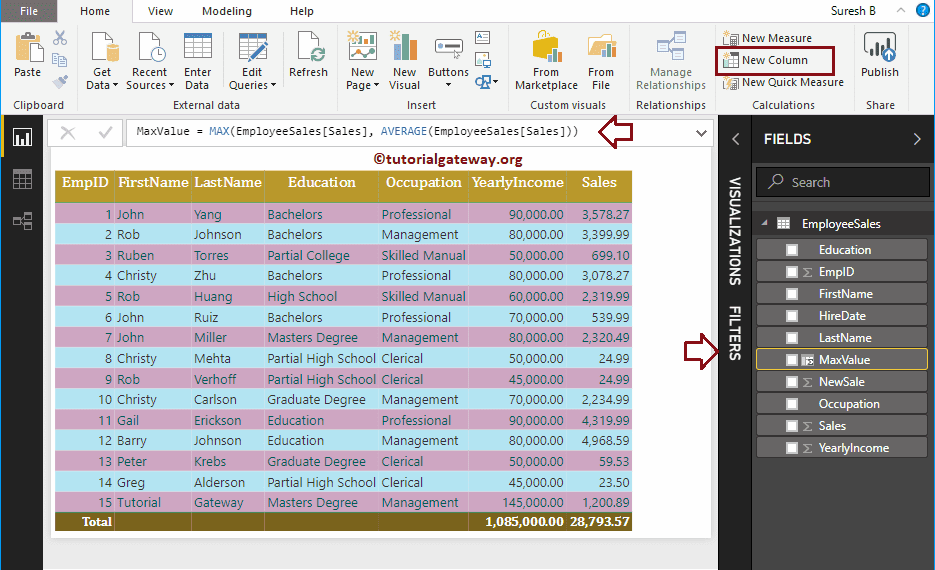
DAX MAX Function Example 2
The DAX MAX function also accepts two arguments. You can use this function to find the maximum value between those two. The DAX MAX function syntax is:
Measure Name = MAX(Expression1, Expression2)
Here, we created a new column (named as MaxValue) to find the largest value in-between the Sales and the Average Sales. I suggest you refer to Create a Column article to understand the steps involved in creating a column.
DAX MIN Function Example 2
The DAX MIN function accepts two arguments. Use this MIN function to find the smallest value between two numbers. Syntax is:
Measure Name = MIN(Expression1, Expression2)
Here, we created a new column (named as MinValue) to find the smallest value between the Sales and Average Sales.
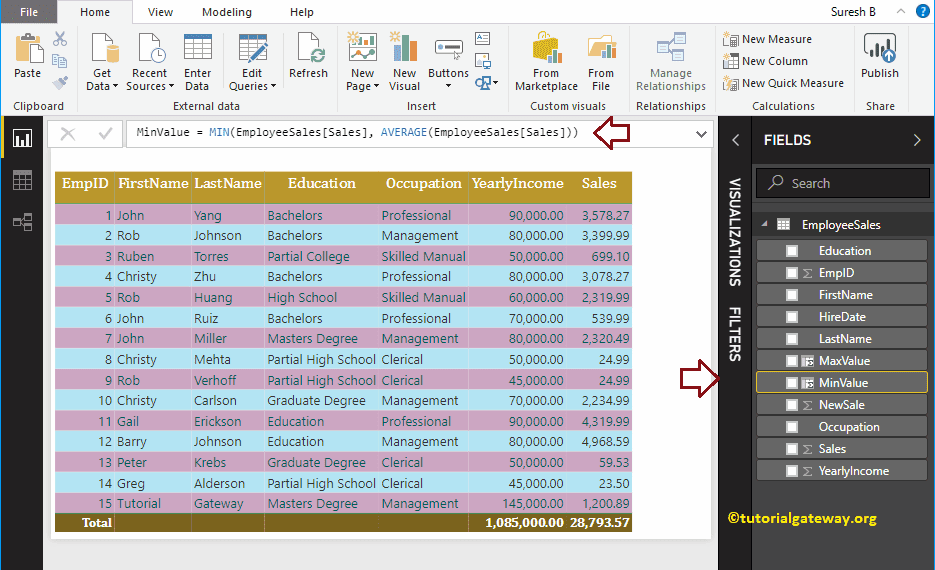
Let me add those two Max Value and Min Value columns to this table.
