Tableau provides various table functions to perform calculations on all visual data. They are FIRST, LAST, INDEX, RUNNING_SUM, RUNNING_AVG, WINDOW_SUM, WINDOW_VAR, etc. In this article, we will show you how to use Tableau Table Functions with an example of each.
To demonstrate these Tableau Functions, we use the table below. Remember, this is an Excel Worksheet. So, Please refer to the Connecting to the Excel Files in Tableau.
Tableau Table Functions
The following examples will show you the list of Table Functions.
Tableau Table FIRST Function
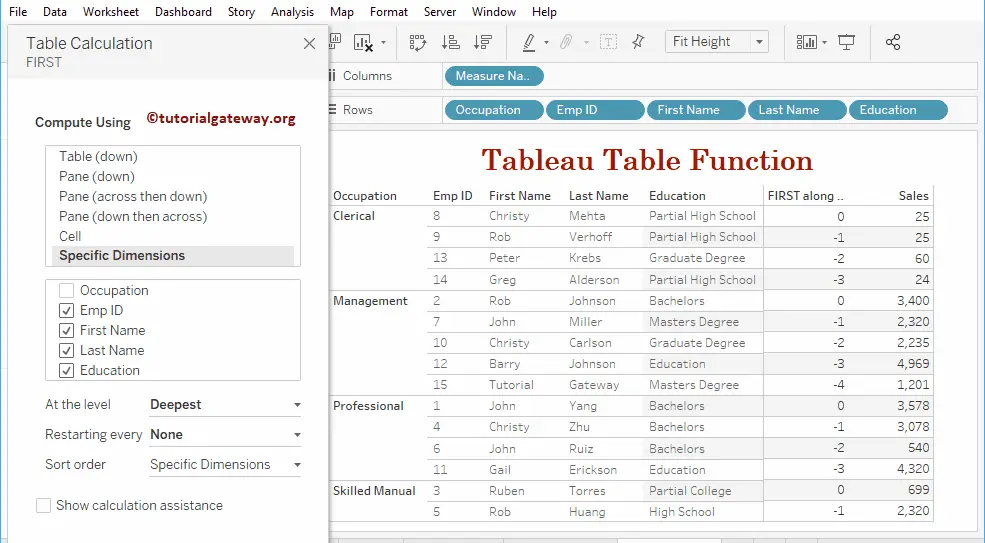
The FIRST function returns values from 0 to -n in a table, and the syntax of this FIRST is:
FIRST()
To demonstrate these Tableau functions, we have to use the table calculation. To create a table calculation, please navigate to the Analysis Tab and select the Create Calculated Field… option. For more built-in functions >> Click Here!
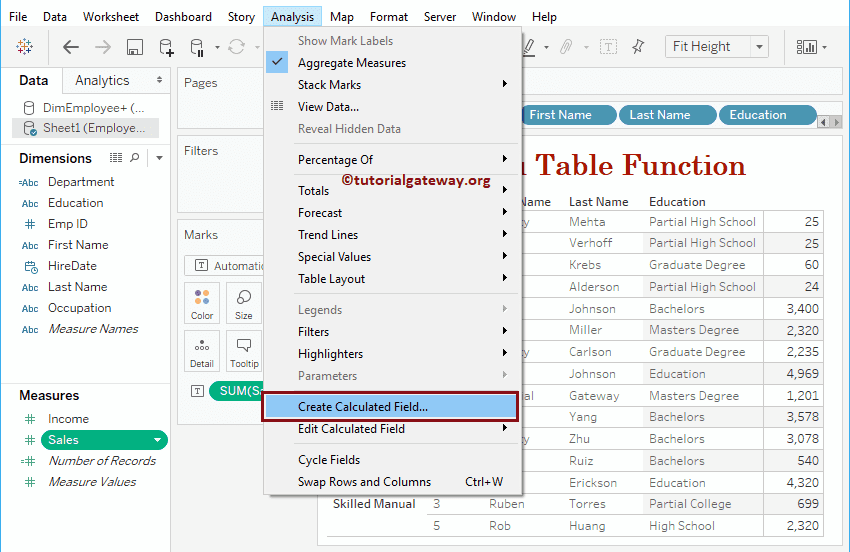
Once you click on the Create Calculated Field… option, the following window will be opened. Here, we renamed the default calculation name as FIRST. Click OK to close this window
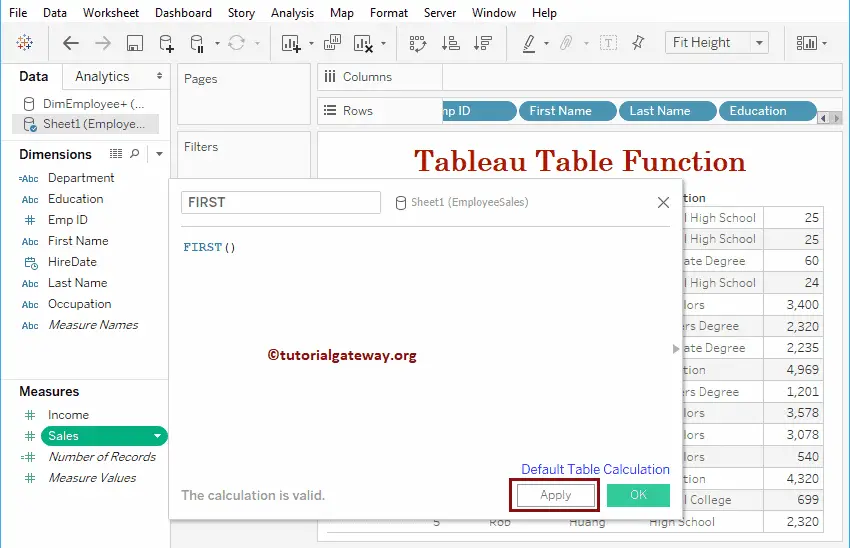
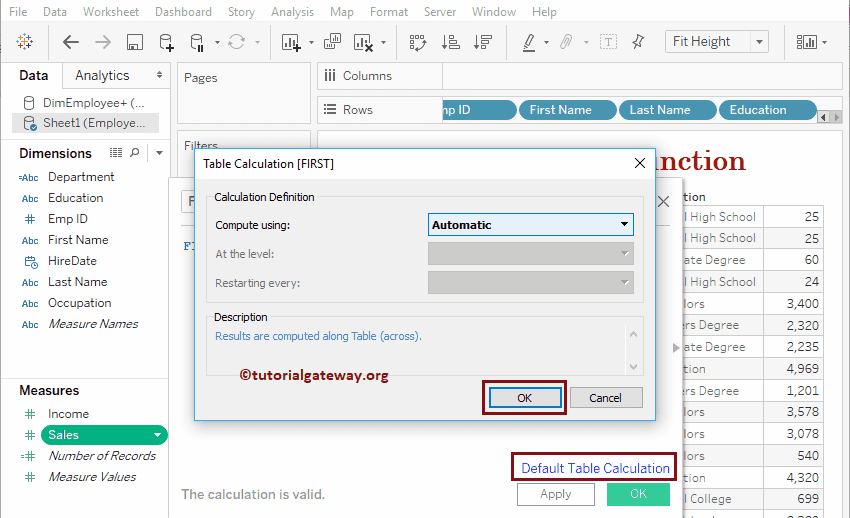
Or you can click the Default Table calculation hyperlink to alter the default settings. Clicking that link will open the following window.
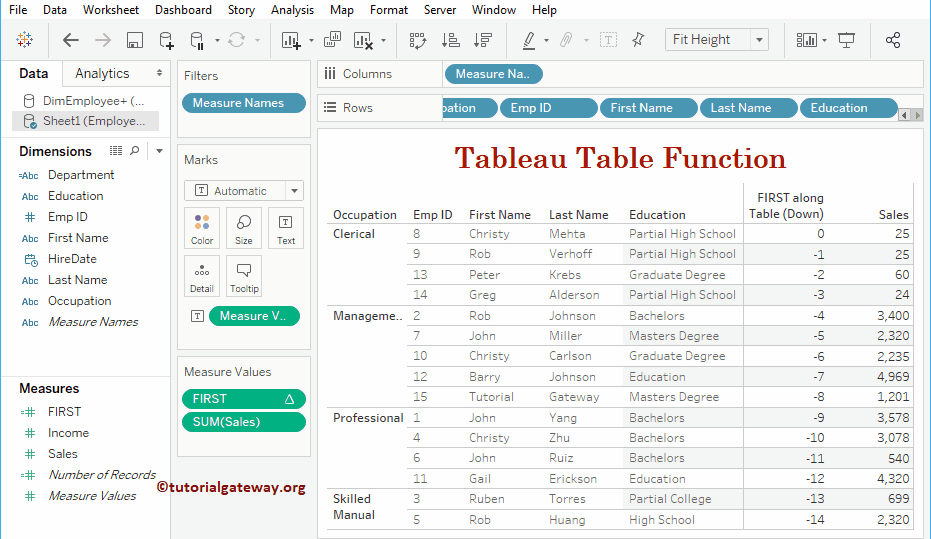
Let me add this FIRST field to an existing table (by dragging the field to Measures Shelf). Please refer to the Create Table Report article to understand the process of creating a table
You can edit this table calculation by clicking the down arrow. Next, select the Edit Table Calculation option from the context menu.
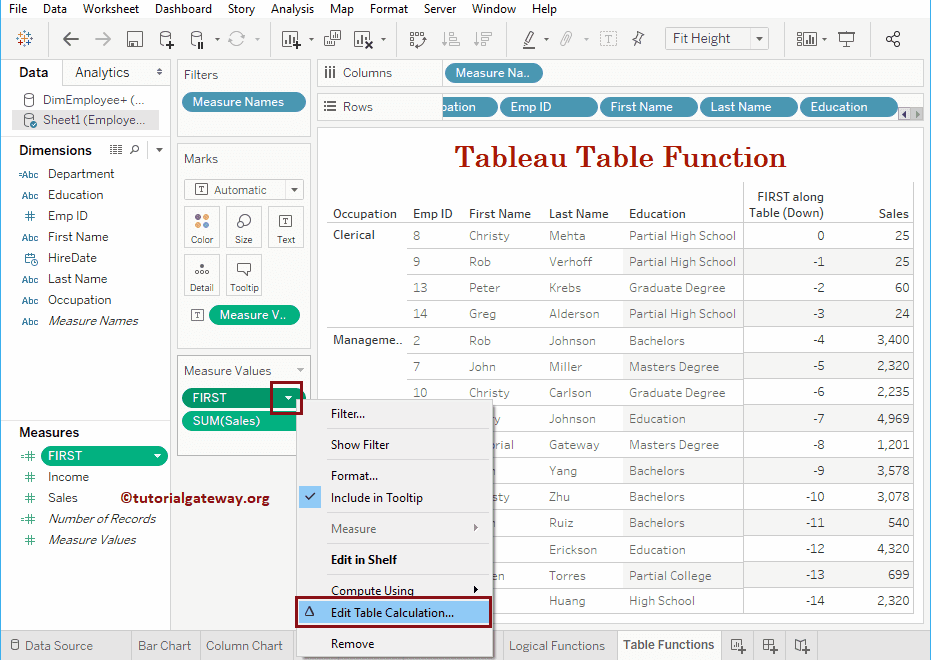
It will open a new window called Table calculation.
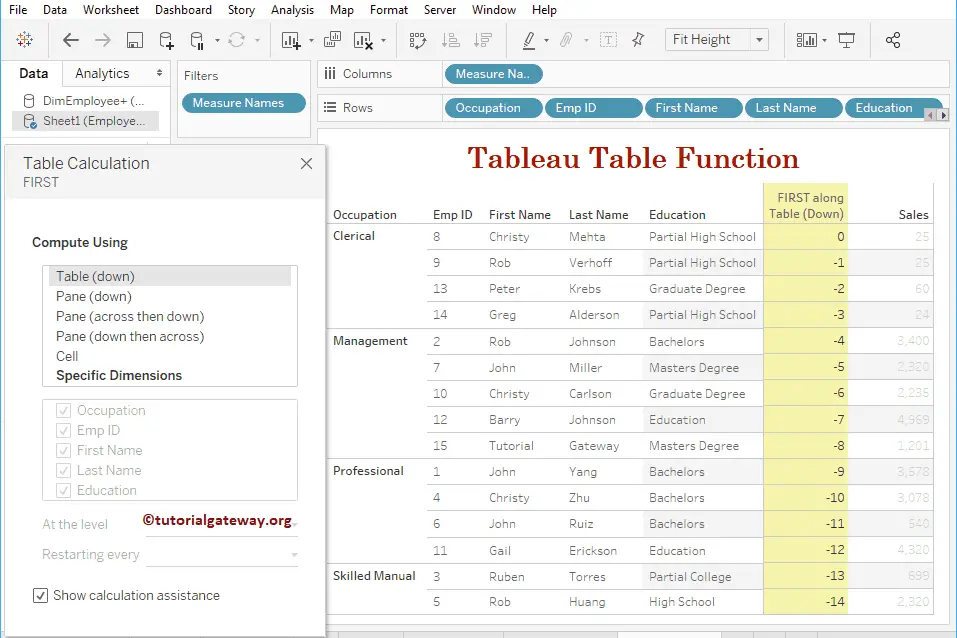
Use this window to change the calculation process. We already explained these properties in our previous article. So, please refer to Table Calculations article to understand these functionalities.
LAST Function
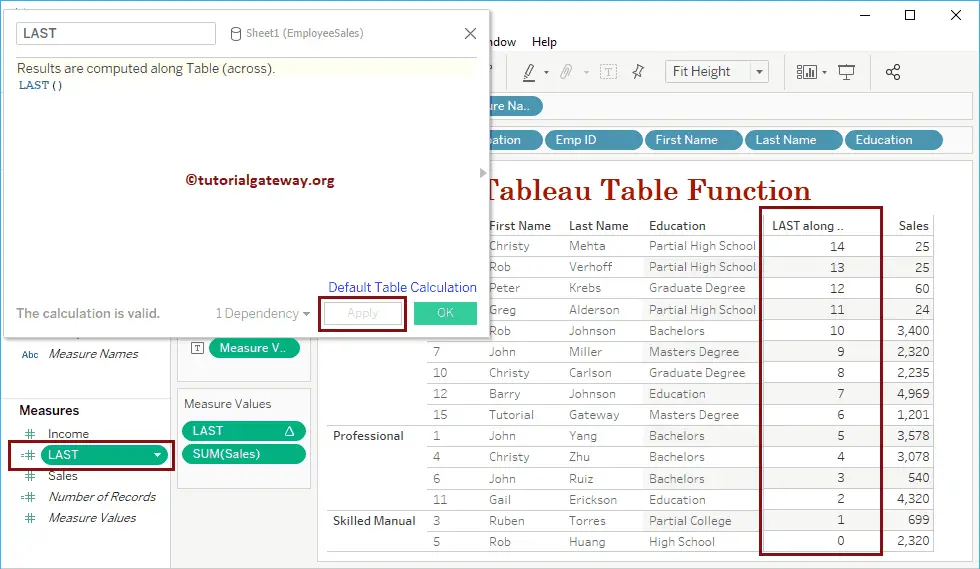
The LAST will return numbers from n to 0. I mean, the last record is 0, and the first record is n. The syntax of this Tableau LAST Function on a table is:
LAST()
Let me add this LAST function field to the Measures shelf.
INDEX
The Tableau Table INDEX function will return numbers from i to n. I mean, the first record is 1, and the last record is n. The syntax of this INDEX is:
INDEX()
Let me add this INDEX field to the Measures shelf
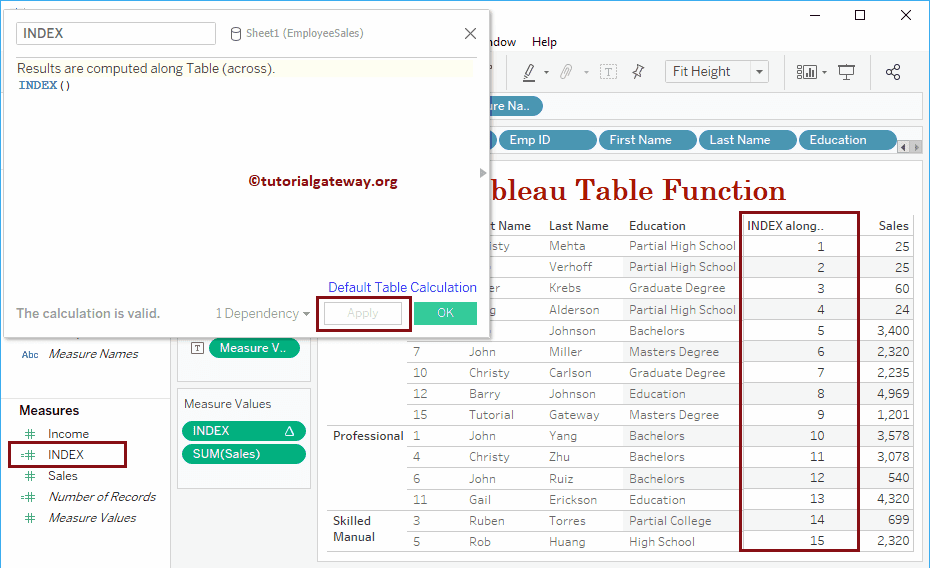
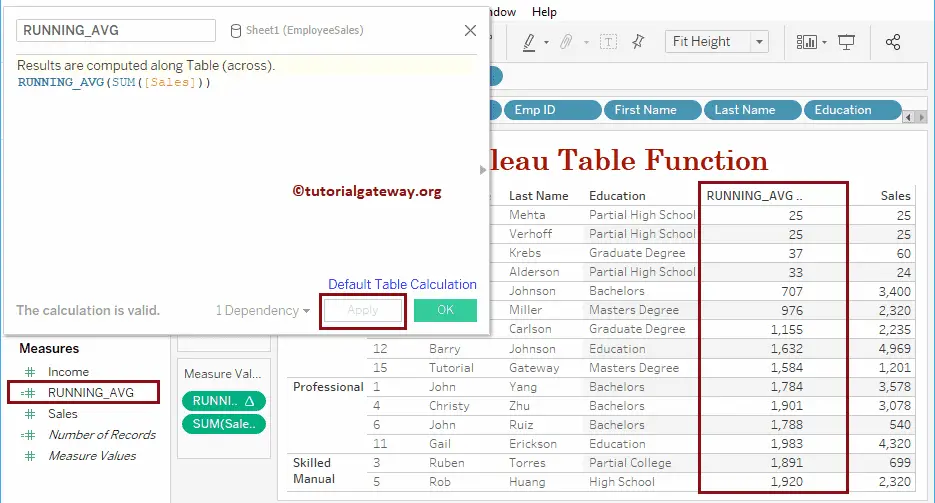
Tableau RUNNING_AVG
The RUNNING_AVG function will calculate the running average of the table, and the syntax of this RUNNING_AVG is:
RUNNING_AVG(Expression)
The below statement calculates the running average of the Sales column across the table.
RUNNING_AVG(SUM([Sales]))
Let me add this RUNNING_AVG field to the Measures shelf.
Third record: (25 + 25 + 60) /3 = 36.667 = 37
RUNNING_COUNT
The Tableau RUNNING_COUNT function will return the running count of the table, and the syntax of this RUNNING_COUNT is:
RUNNING_COUNT(Expression)
The below statement returns the running count of the Sales column.
RUNNING_COUNT(SUM([Sales]))
Let me add this RUNNING_COUNT field to the Measures shelf.
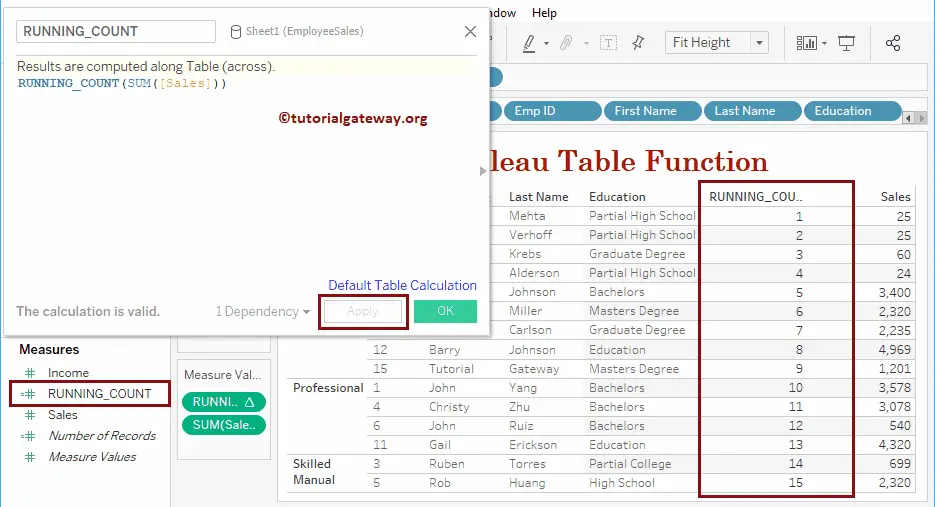
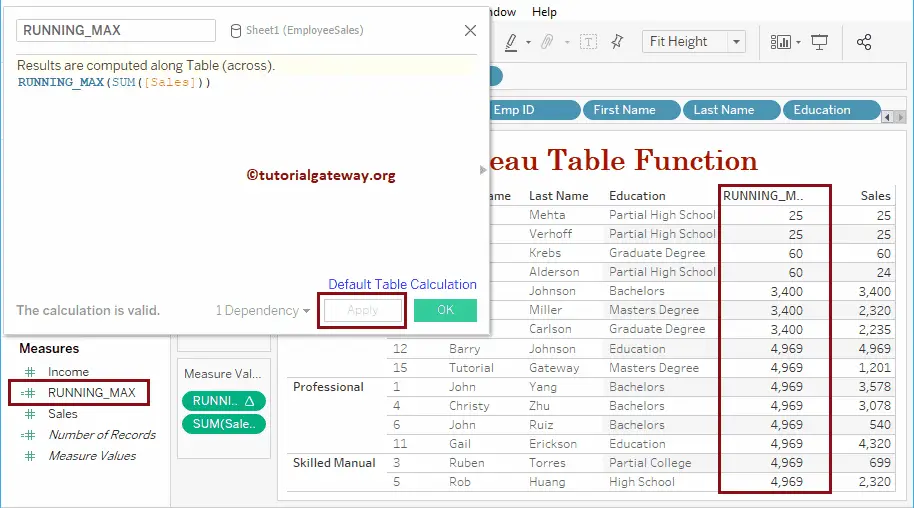
Tableau RUNNING_MAX
The RUNNING_MAX function returns the maximum running value in a table, and the syntax of this RUNNING_MAX is:
RUNNING_MAX(Expression)
Returns the maximum running value in a Sales column.
RUNNING_MAX(SUM([Sales]))
Let me add this RUNNING_MAX field to the Measures shelf.
RUNNING_MIN
The Tableau RUNNING_MIN function will return the running minimum value, and the syntax of Table RUNNING_Min is:
RUNNING_MIN(Expression)
Returns the minimum running amount in a Sales column.
RUNNING_MIN(SUM([Sales]))
Let’s add the RUNNING_MIN field to the Measures shelf.
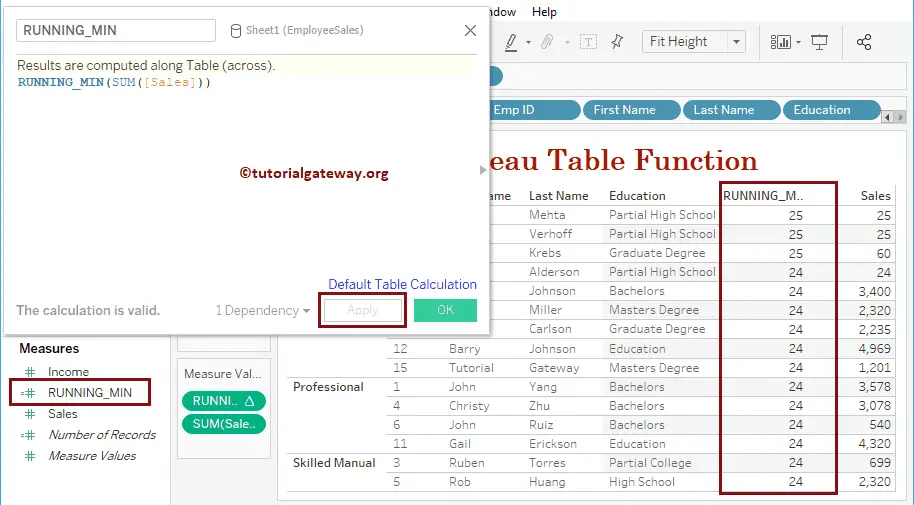
Tableau RUNNING_SUM
The Table RUNNING_SUM function will calculate the running total, and the syntax of this RUNNING_SUM is:
RUNNING_SUM(Expression)
Returns the running total of a Sales column.
RUNNING_SUM(SUM([Sales]))
Let’s add the RUNNING_SUM field to the Measures shelf.
Third record: (50 + 60) = 110
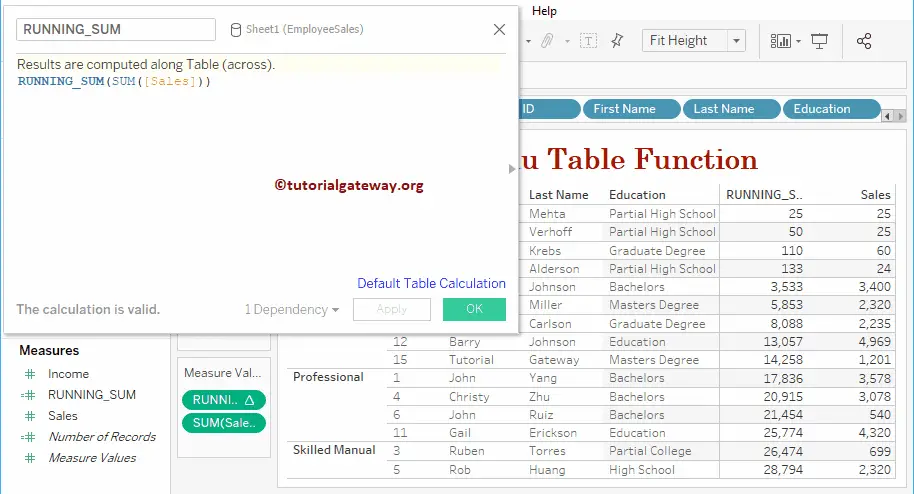
Tableau SIZE
The Tableau SIZE function returns total records in a table or pane, and the syntax of this SIZE is:
SIZE()
Let me add this SIZE field to the Measures shelf. As you can see, we have changed the default calculation to display the size based on the Occupation

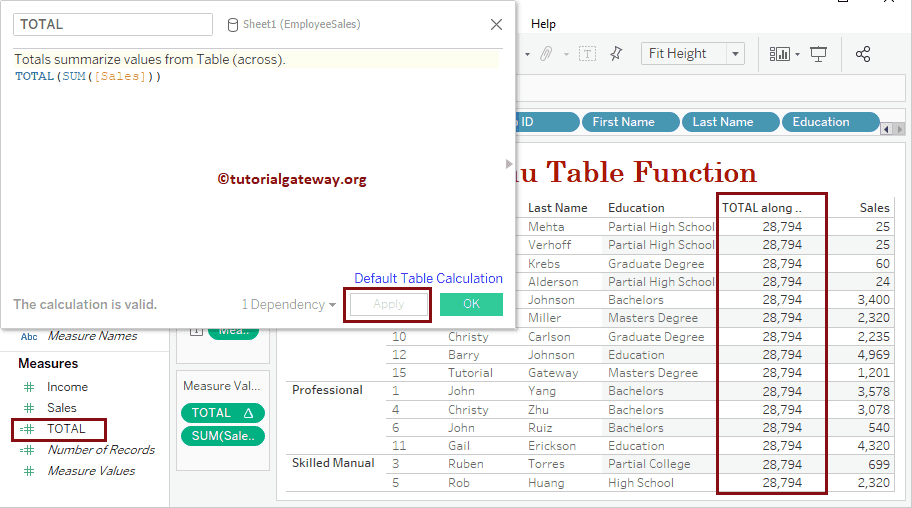
TOTAL
The Tableau TOTAL function will return the complete total in a window, and the syntax of this Total is:
TOTAL(Expression)
Returns the total sales amount in this table. i.e., 25 + 25 + 60 + 24 +….. + 2320
TOTAL(SUM([Sales]))
Let me add this TOTAL Function field to the Measures shelf.
This time we are computing using Occupation. It means the total function will sum based on occupation.
First set: 25 + 25 + 60 + 24 = 133

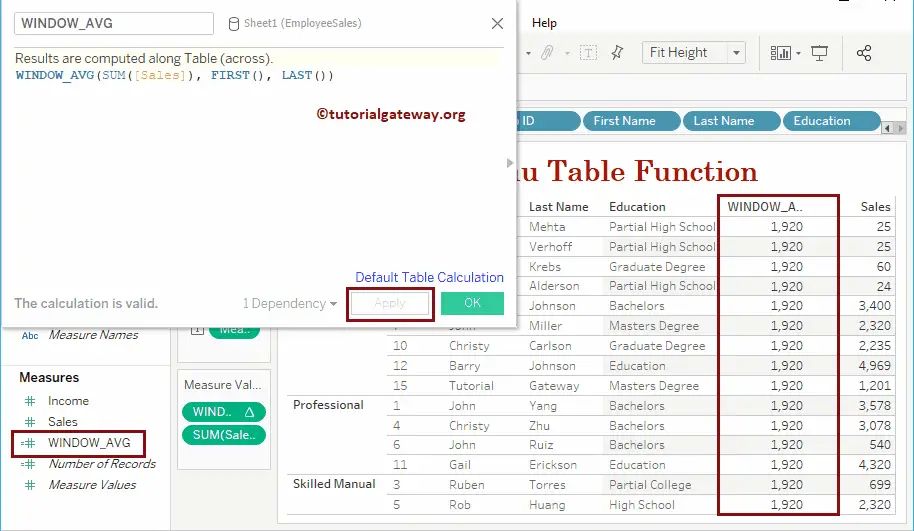
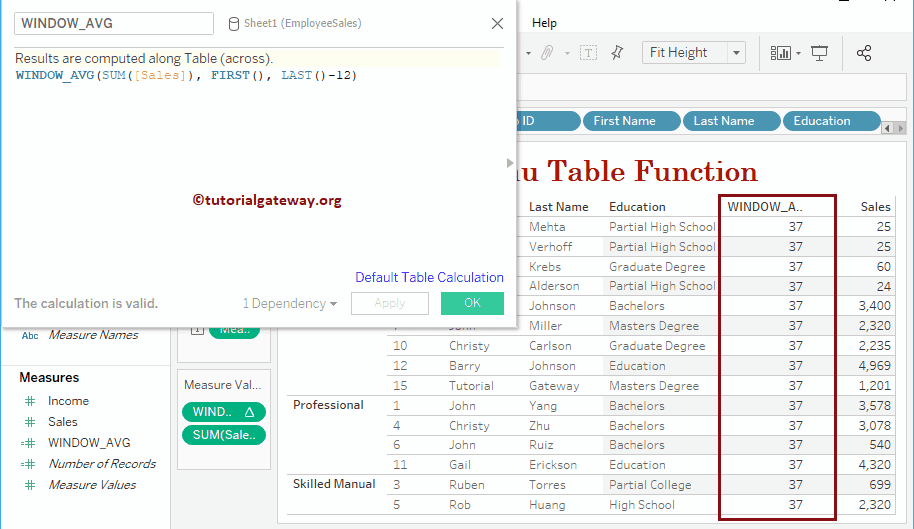
Tableau WINDOW_AVG
The WINDOW_AVG function will calculate the average of the data in a table, and the syntax of this WINDOW_AVG is:
WINDOW_AVG(Expression, start_point, end_point)
The below WINDOW_AVG function calculates the average of Total Sales.
WINDOW_AVG(SUM([Sales]), FIRST(), LAST())
Let me add this WINDOW_AVG field to the Measures shelf.
Here, the Sum of 15 records is 28, 794.
Average = 28,794/15 = 1919.6 = 1920
This time, we are calculating the average from the first record to the last -12 (means 15 – 12). i.e., the first record to the third record
Window_Avg = 25 + 25 + 60 = 36.67 = 37
WINDOW_MEDIAN
The Tableau WINDOW_MEDIAN function will calculate the median in a table from the start point to the end. The syntax of this WINDOW_MEDIAN is:
WINDOW_MEDIAN(Expression, start_point, end_point)
Calculate the median of Total Sales.
WINDOW_MEDIAN(SUM([Sales]), FIRST(), LAST())
Let me add this WINDOW_MEDIAN field to the Measures shelf.
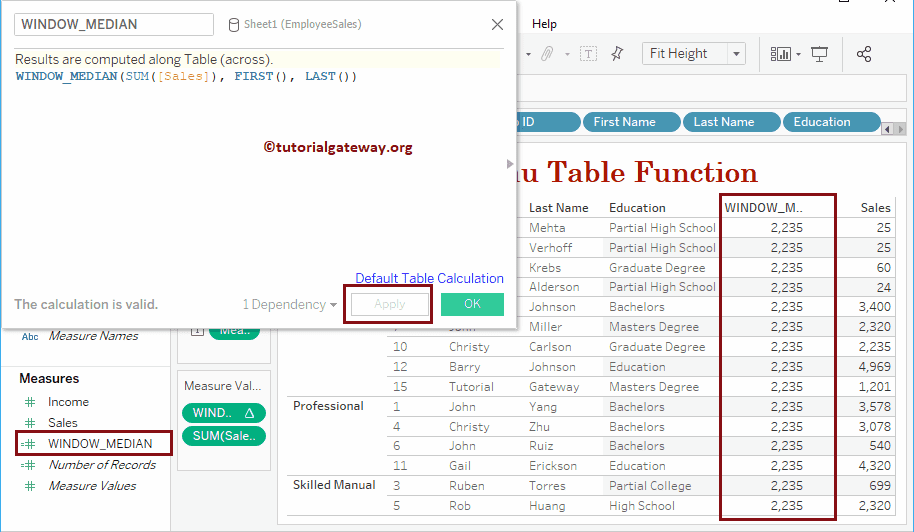
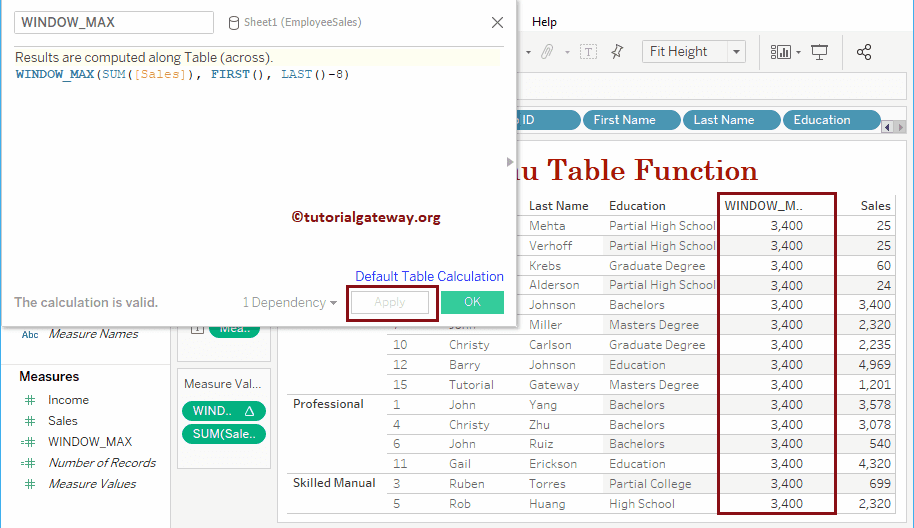
Tableau WINDOW_MAX
The WINDOW_MAX function returns the maximum value from the start point to the end in a table. The syntax of this WINDOW_MAX is:
WINDOW_MAX(Expression, start_point, end_point)
Finds the maximum value from the first record to the last – 8 (means, 15 – 8 = 7)
WINDOW_MAX(SUM([Sales]), FIRST(), LAST() - 8)
Let me add this WINDOW_MAX field to the Measures shelf.
WINDOW_MIN
The WINDOW_MIN function returns the Minimum value from the start point to the end of a table. The syntax of the WINDOW_MIN is:
WINDOW_MIN(Expression, start_point, end_point)
Finds the minimum value from the first record + 4 to the last record
WINDOW_MAX(SUM([Sales]), FIRST(), LAST() - 8)
Let me add this WINDOW_MIN field to the Measures shelf.
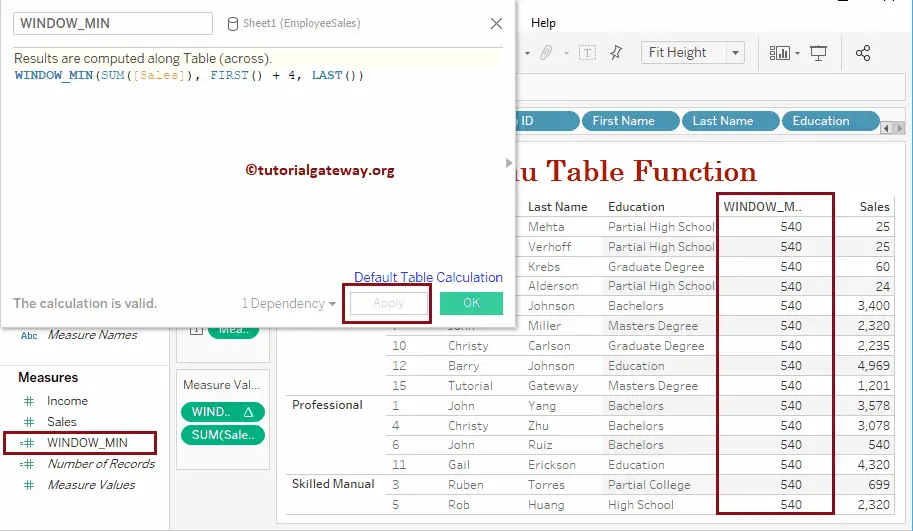
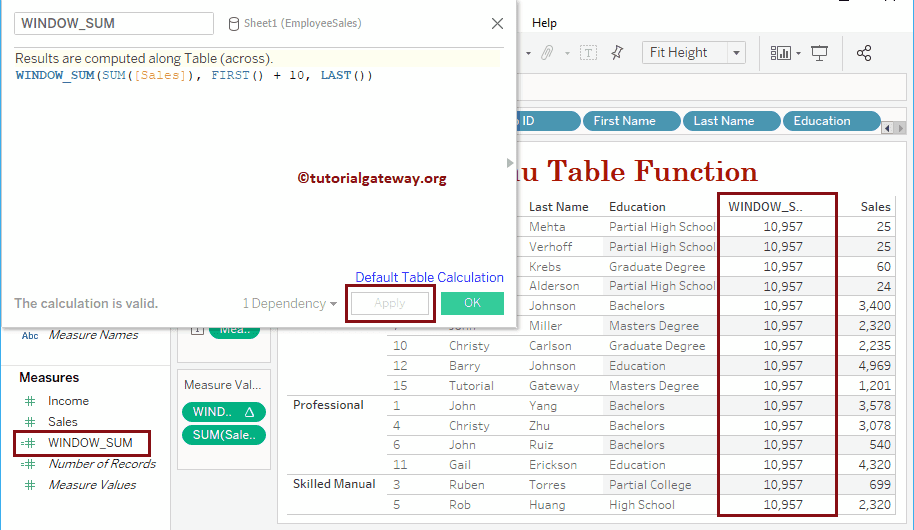
Tableau WINDOW_SUM
The WINDOW_SUM function calculates the sum from the start point to the endpoint in a table, and the syntax of this WINDOW_SUM is:
WINDOW_SUM(Expression, start_point, end_point)
Calculate the Total Sales from 11 to 15.
WINDOW_SUM(SUM([Sales]), FIRST(), LAST())
Let me add this WINDOW_SUM field to the Measures shelf.
Sum from 11 to 15 = 3078 + 540 + 4320 + 699 + 2320 = 10957.
WINDOW_VAR
The WINDOW_VAR function returns the variance of the sample population from the start point to the endpoint in a table. The syntax of this WINDOW_VAR is:
WINDOW_VAR(Expression, start_point, end_point)
Calculate the variance from the current row to the previous row.
WINDOW_VAR(SUM([Sales]), FIRST(), 0)
Let me add this WINDOW_VAR field to the Measures shelf.
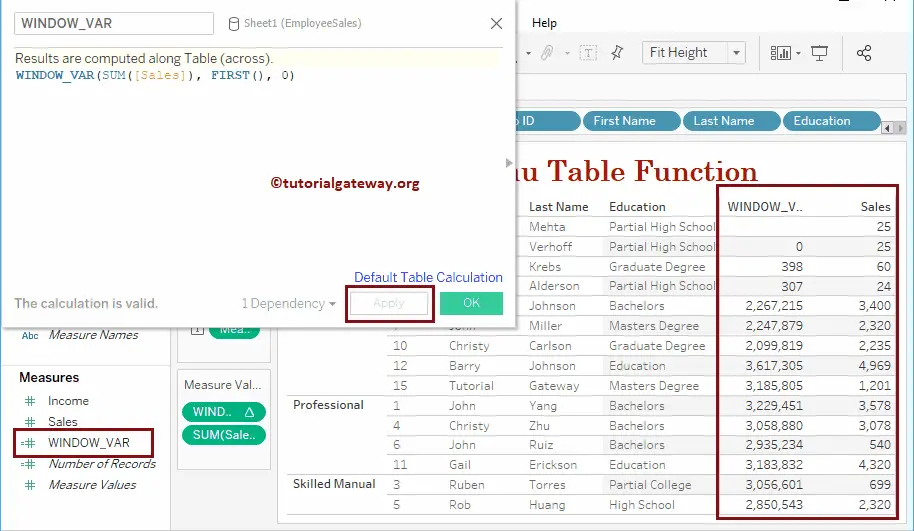
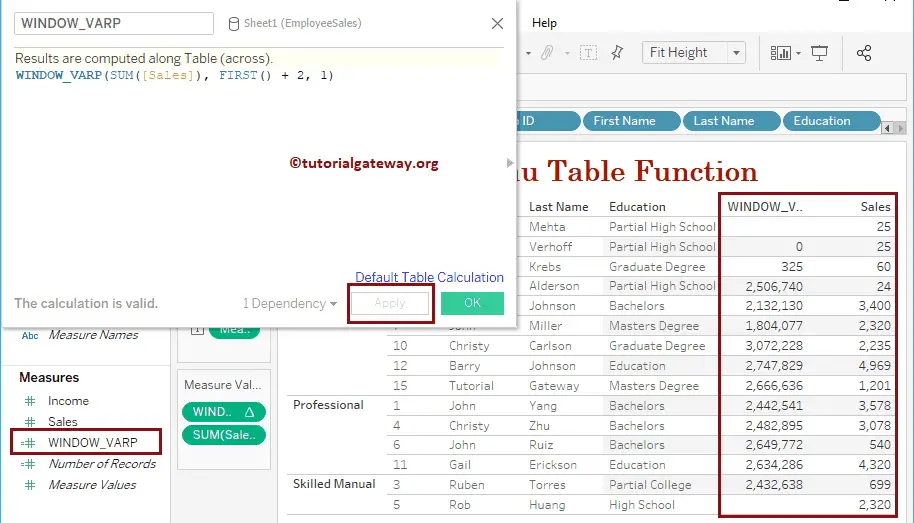
Tableau WINDOW_VARP
The WINDOW_VARP function returns the variance of the complete population in a table from the start point to the end point. The syntax of this WINDOW_VARP is:
WINDOW_VARP(Expression, start_point, end_point)
Calculate the variance from the third row to the previous row.
WINDOW_VARP(SUM([Sales]), FIRST()+ 2, 1)
Let me add this WINDOW_VARP field to the Measures shelf.
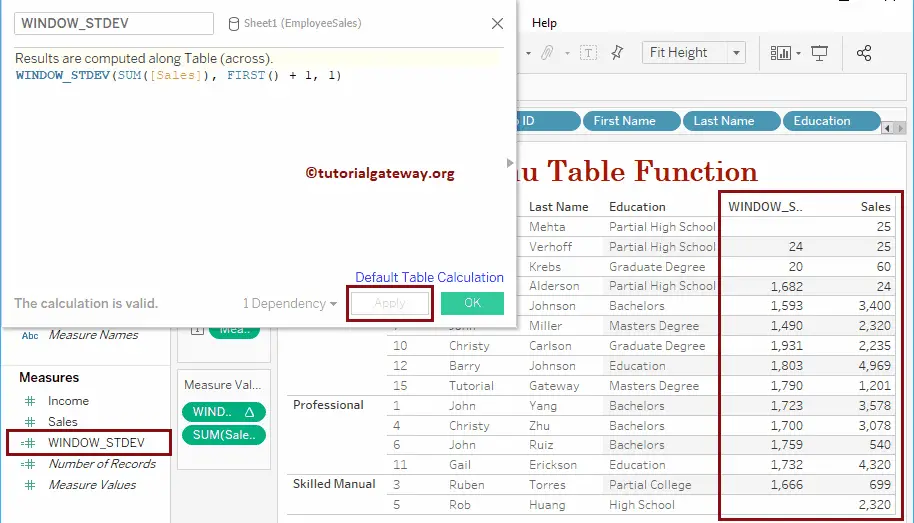
WINDOW_STDEV
The Tableau WINDOW_STDEV function returns the standard deviation of the sample population from the start point to the endpoint in a table. The syntax of this WINDOW_STDEV is:
WINDOW_STDEV(Expression, start_point, end_point)
Calculate the standard deviation from the second row to the current row.
WINDOW_STDEV(SUM([Sales]), FIRST()+ 1, 1)
Let me add this WINDOW_STDEV field to the Measures shelf.
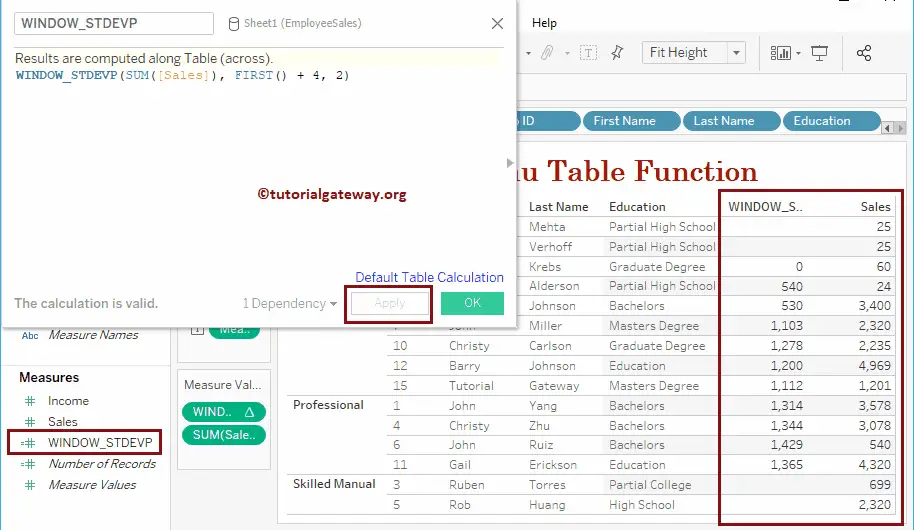
WINDOW_STDEVP
The WINDOW_STDEVP returns the standard deviation of the complete population from the start point to the endpoint in a table. The syntax of the Tableau WINDOW_STDEVP Function is:
WINDOW_STDEVP(Expression, start_point, end_point)
Calculates the standard deviation of the complete population.
WINDOW_STDEVP(SUM([Sales]), FIRST()+ 4, 2)
Let me add this WINDOW_STDEVP field to the Measures shelf.
WINDOW_PERCENTILE
The Tableau WINDOW_PERCENTILE function returns the specified percentile from the start point to the endpoint in a table. The syntax of the WINDOW_PERCENTILE is:
WINDOW_PERCENTILE(Expression, percentile, start_point, end_point)
Calculate the 25% percentile from the previous two rows to the current row.
WINDOW_STDEVP(SUM([Sales]), FIRST()+ 4, 2)
Let me add this WINDOW_PERCENTILE field to the Measures shelf.
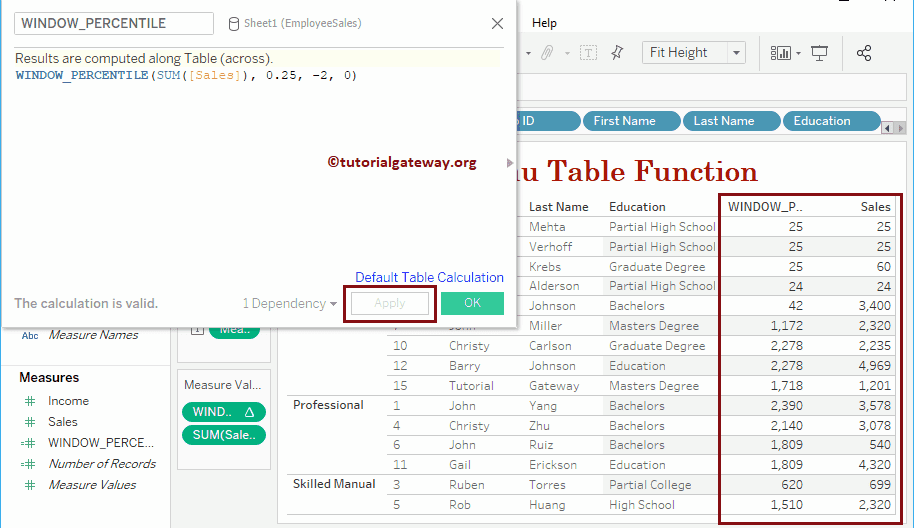
Tableau WINDOW_CORR
The WINDOW_CORR function returns the correlation between two measures from the start point to the endpoint in a table. The syntax of the WINDOW_CORR is:
WINDOW_CORR(Expression1, Expression2, start_point, end_point)
Finds the correlation between total cost and sales amount from the previous three rows to the current row.
WINDOW_CORR(SUM([Total Cost]), SUM([SalesAmount]), -3, 2)
Let me add this WINDOW_CORR field to the Measures shelf.

WINDOW_COVAR
The Tableau WINDOW_COVAR function returns the covariance of the sample population from the start point to the endpoint in a table. The syntax of the WINDOW_COVAR is:
WINDOW_COVAR(Expression1, Expression2, start_point, end_point)
It finds the sample covariance between total cost and sales amount from the previous three rows to the current row.
WINDOW_COVAR(SUM([Total Cost]), SUM([SalesAmount]), -3, 0)
Let me add this WINDOW_COVARP field to the Measures shelf.

WINDOW_COVARP
The WINDOW_COVARP function returns the total population covariance from the start point to the endpoint in a table. The syntax of the Tableau WINDOW_COVARP is:
WINDOW_COVARP(Expression1, Expression2, start_point, end_point)
It finds the population covariance between total cost and sales amount from the previous two rows to the current row.
WINDOW_COVARP(SUM([Total Cost]), SUM([SalesAmount]), -2, 0)
Let me add this WINDOW_COVARP field to the Measures shelf.
