This Tableau article explains creating a KPI or Key Performance Indicator using a window average with an example.
To demonstrate the Tableau KPI using the window average, we used the Sample Superstore Excel sheet. Please visit the Excel Source article to understand the Data Source.
Tableau KPI using window average
Drag and drop the Sales Measure to the Columns shelf, Product Category, and Subcategory dimensions to the Rows Shelf. By default, it will create a Side-by-Side Horizontal Bar Chart. If not, change the Marks type from Automatic to Bar. Next, add the Data labels by clicking the T button in the toolbar. For the remaining charts in Tableau, please click here.
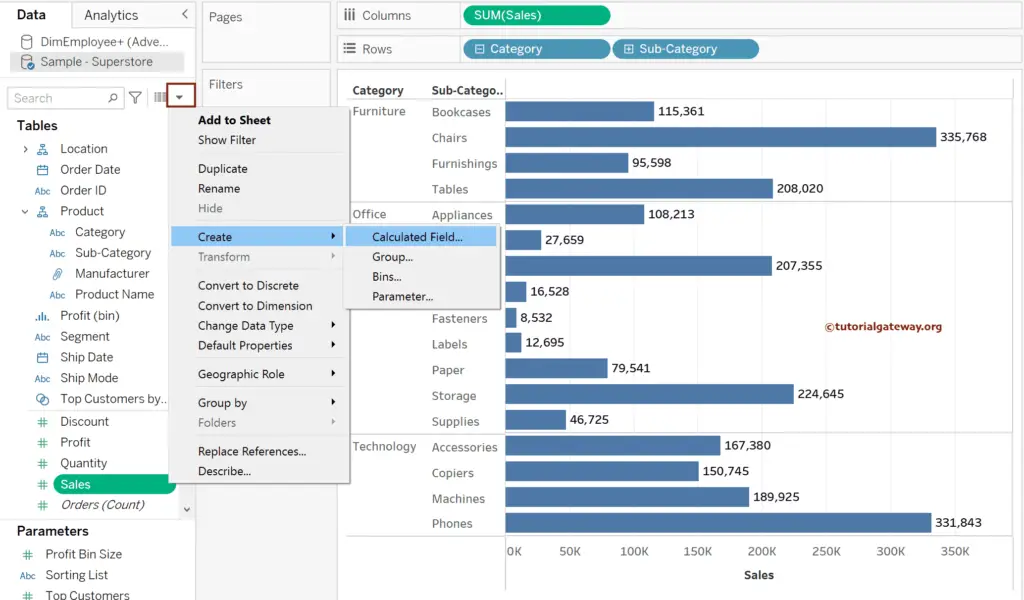
First, we must create a calculated field for writing an expression for the KPI. So, click the down arrow (marked red), select Create, and choose the Calculated Field.. option.
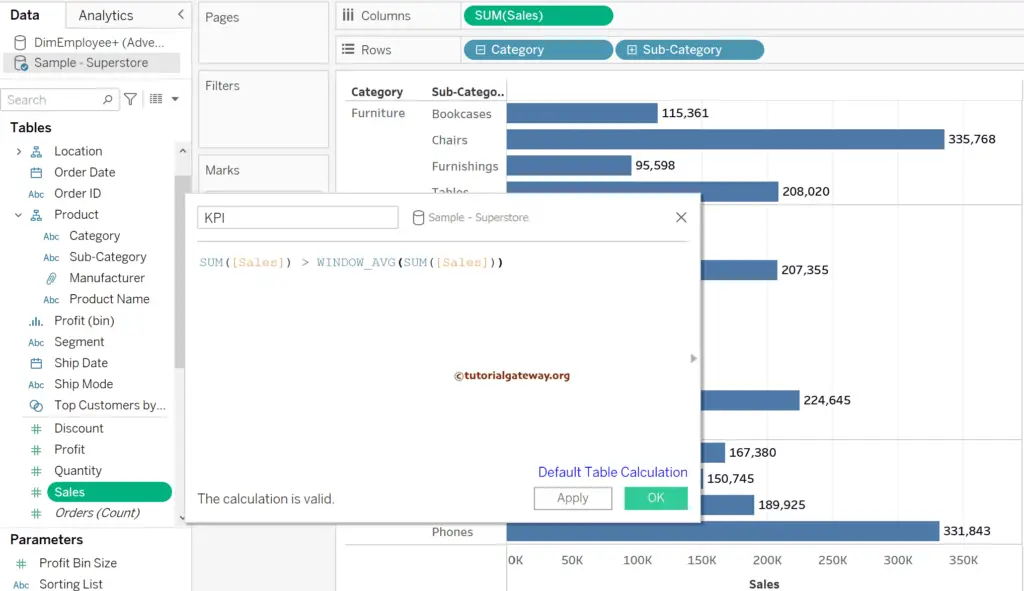
The following expression checks whether the Sum of the Sales is greater than the window average and returns a boolean True or False. The WINDOW_AVG() function returns the average of the whole bar chart. For all the built-in functions >> Click Here!
SUM([Sales]) > WINDOW_AVG(SUM([Sales]))
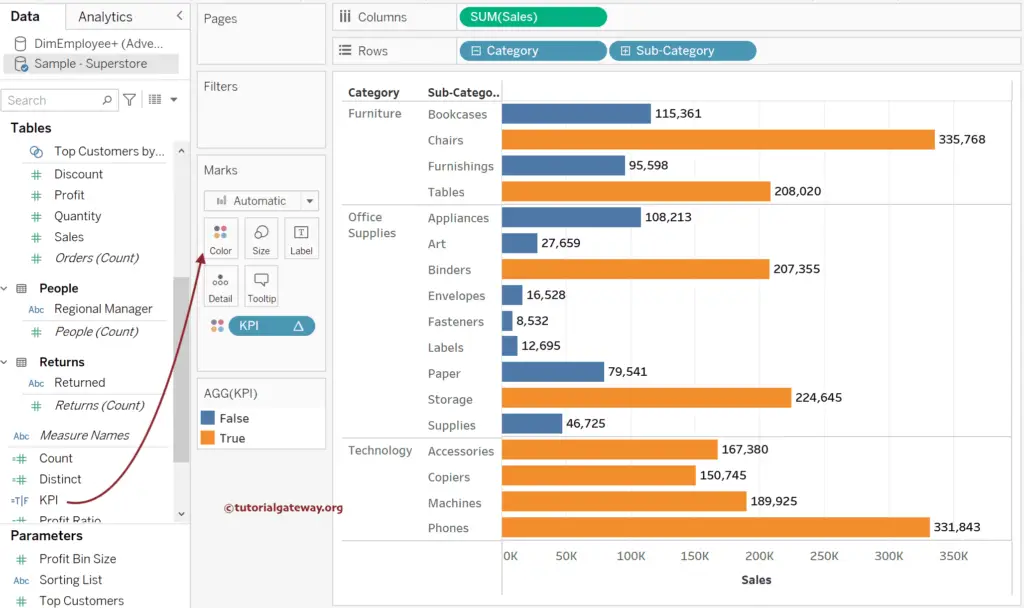
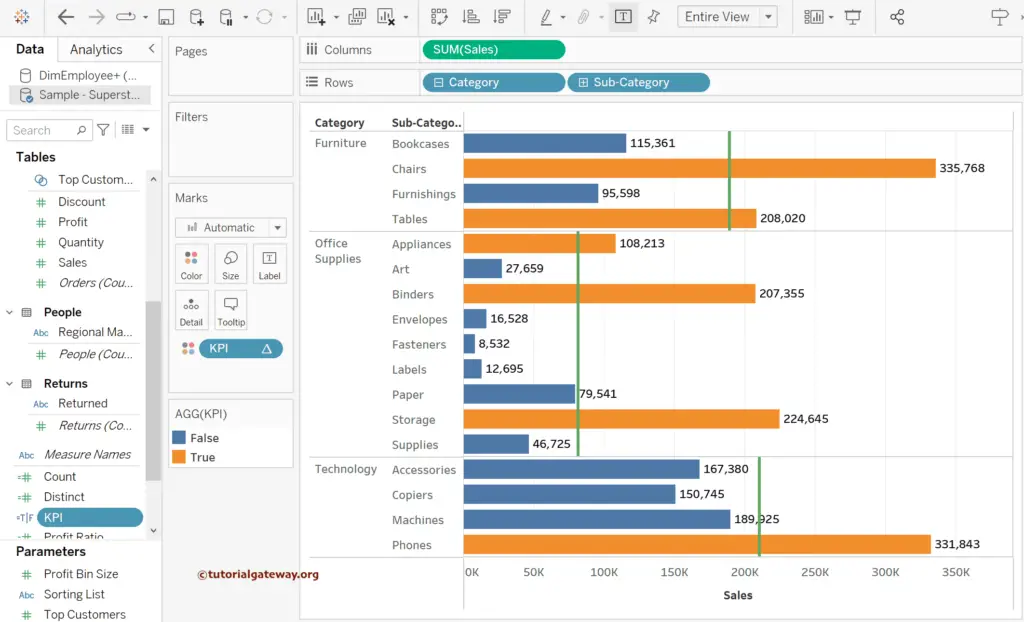
Please add the newly created Tableau KPI calculated field using the window average (WINDOW_AVG()) to the Color shelf to use as the color indicator. If you observe the bar chart, the subcategories with orange color bars have sales greater than the average sales of total product subcategories.
To avoid confusion, let me add the reference line so that you can see the WINDOW_AVG() value. To do so, right-click the Sales Axis and choose the Add Reference Lines Option.
Please change the scope to per pane, value as SUM(Sales), and format the line as a solid green color.
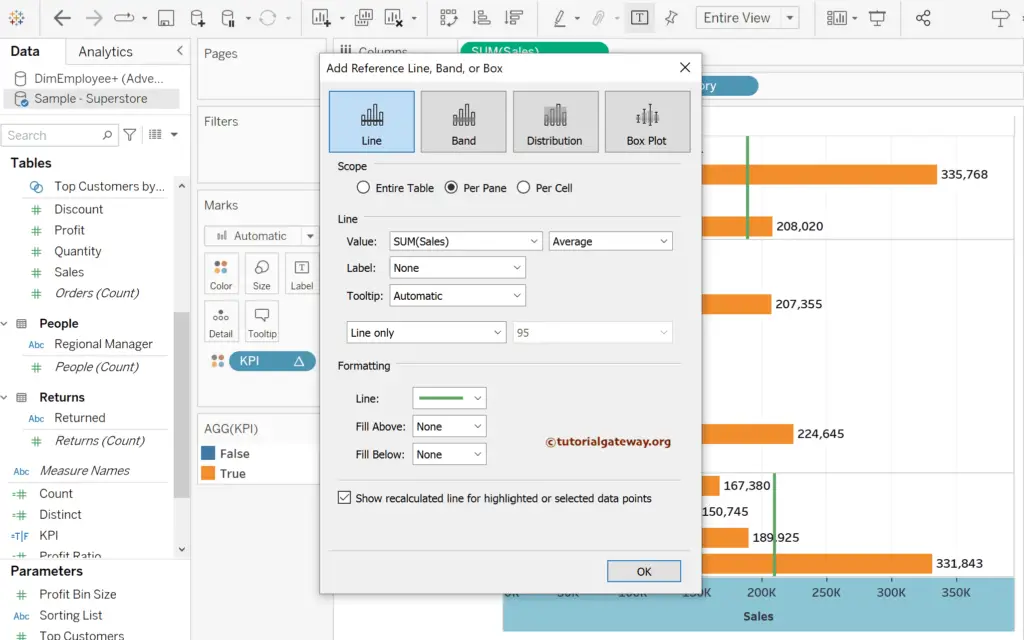
If you observe the chart, there is no match between the KPI produced orange color and the green reference line. Tableau KPI calculates the window average for the complete table or subcategories, and the reference line calculates the average of subcategories within each category.
Please change the calculated field calculation. To do so, click the down arrow beside the KPI within the Marks shelf and change the Compute using from Table(Down) to Pane(Down).
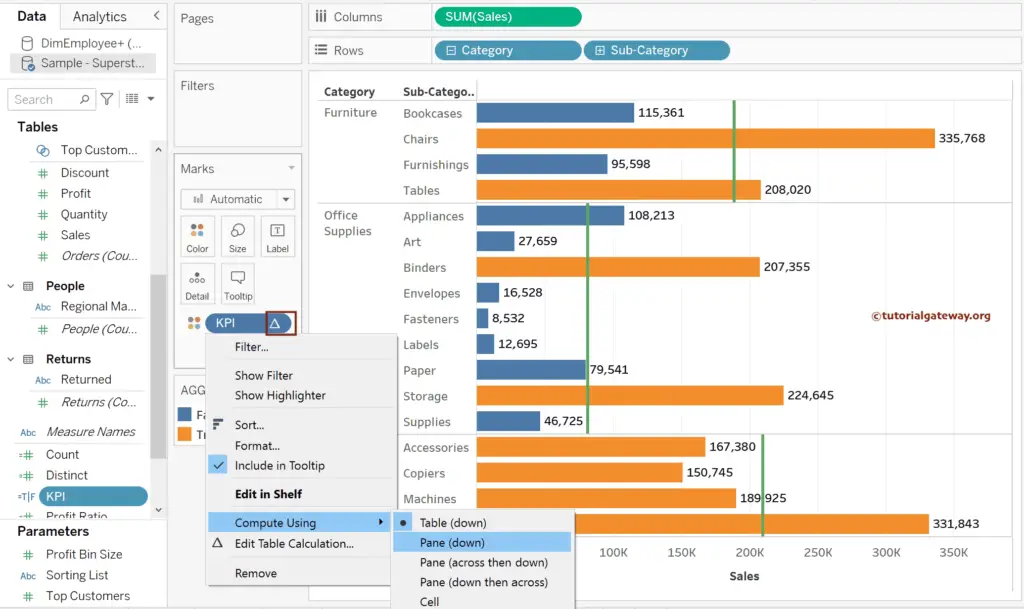
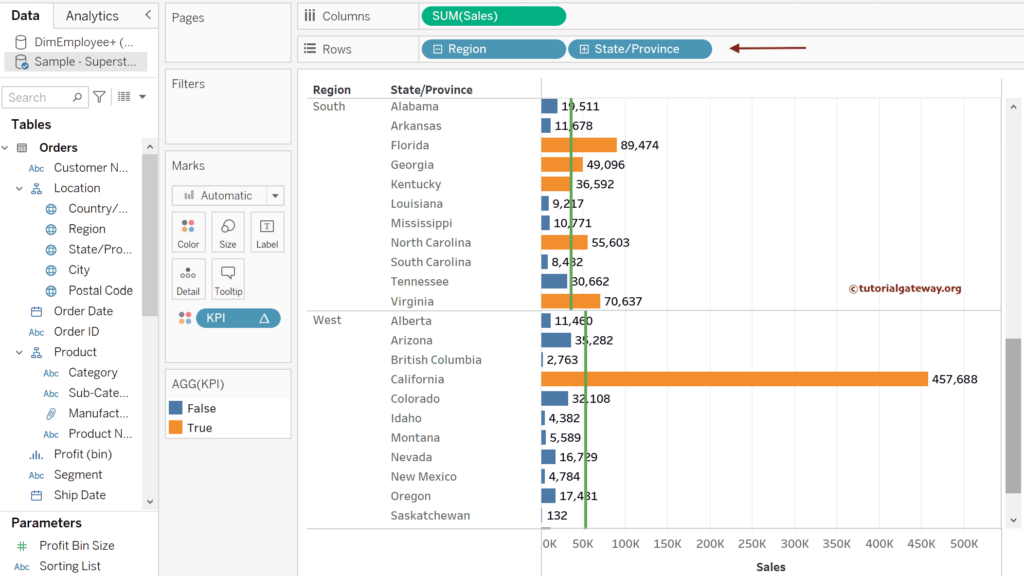
Now, you can see the common result of the Tableau KPI using window average and reference lines.
Please replace the product Category and Subcategory dimensions in the Rows Shelf with Region and State to see the sales KPI by geography.
