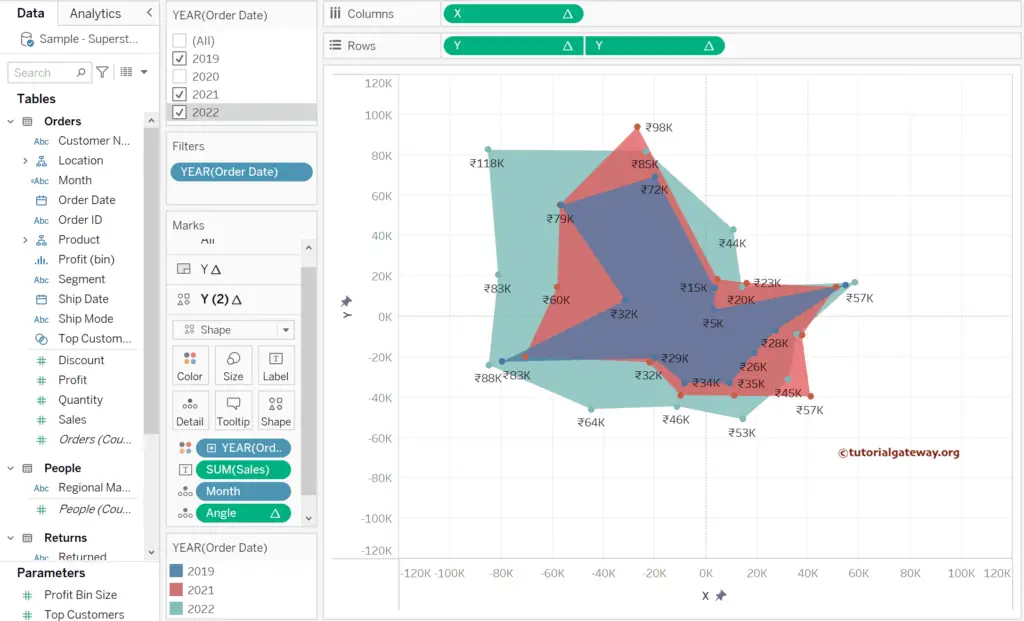
Tableau Radar Chart is helpful to show which measure value is high or low and helps to see the performance of the key categories or state sales. A radar Chart uses the center as the string point and draws the measure values using a certain angle. This article will show you how to use the calculated fields to create a Radar Chart in Tableau with an example.
To demonstrate this Tableau Radar Chart example, we used the Sample Superstore Excel sheet. Please visit the Excel Source article to understand the Data Source.
There is no direct way to create a Tableau Radar Chart in Tableau, so we have to use the multiple calculated fields. In this example, we use the month names from the order date as the radar outer points; let me use the Analysis Tab to create a calculated field.
How to create a Tableau Radar Chart?
The below expression uses the DATENAME function to extract the Months from the order date. Please refer to the Aggregate, Date, and Math function articles to understand the available Functions.
DATENAME('month', [Order Date])
Next, we need the Angle representing the Tableau radar chart angle for each month from the (0, 0) axis point. The expression below uses the RUNNING_SUM function to perform window-based calculations. Here, PI() denotes 180 degrees, and we need 360 degrees to build the radar chart, so we multiplied it by two. Because there are 12 months, we are diving it 12. If you want 6 points, replace 12 by 6.
RUNNING_SUM(2 * PI()/ 12)
Once we had the Angle, the next big step was creating the X and Y axes. For this, create two more calculated fields with the following expressions.
X
SUM([Sales]) * COS([Angle])
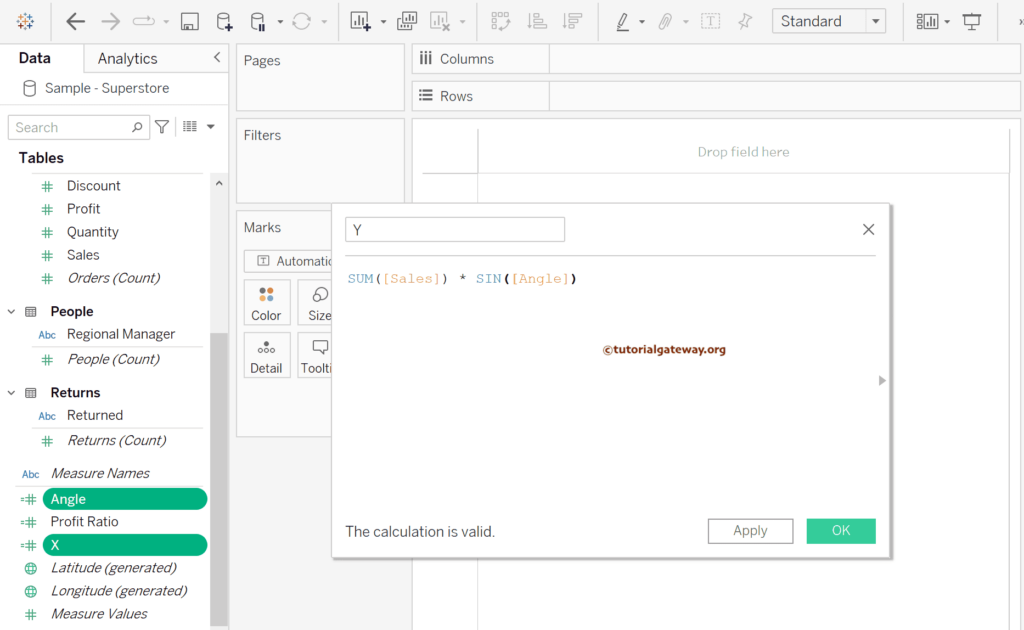
Y
SUM([Sales]) * SIN([Angle])
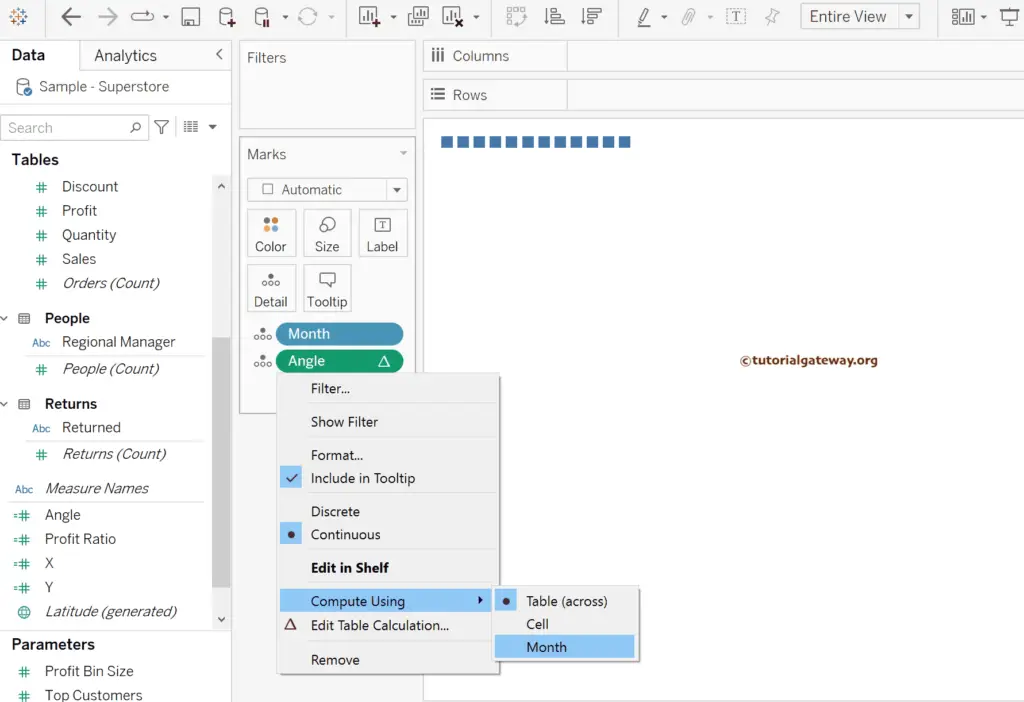
Drag and drop the newly created calculated fields Month and Angle to the Details Shelf. Next, change the Angle field table calculation Compute using option from the Table across to the Month. For the remaining charts in Tableau, please click here.
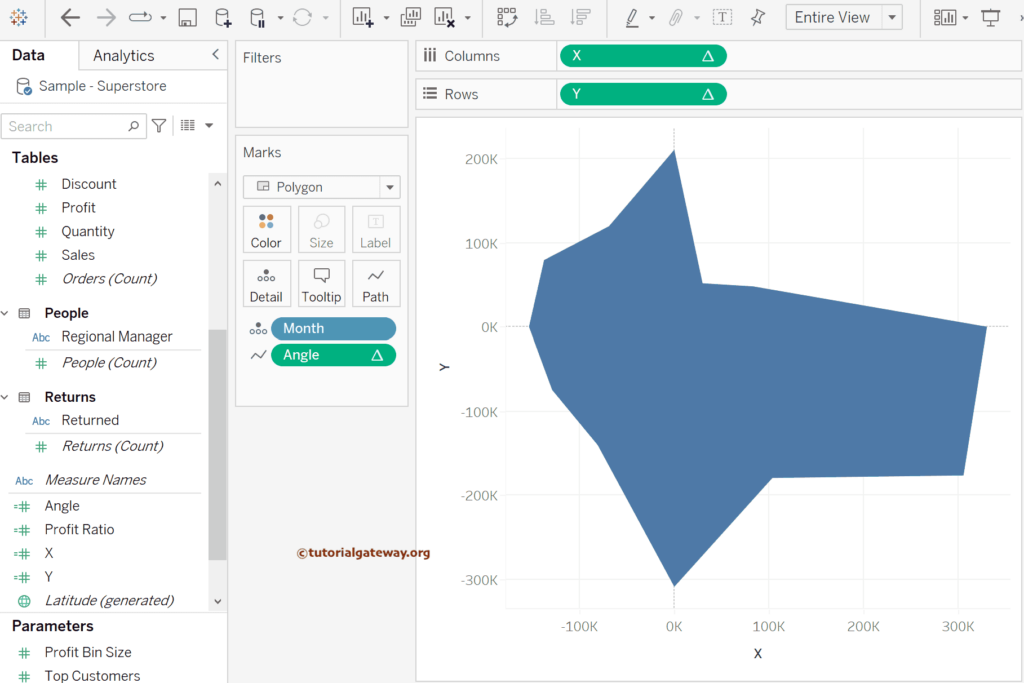
Next, drag and drop the X calculated field to the Columns shelf and Y to the Rows shelf.
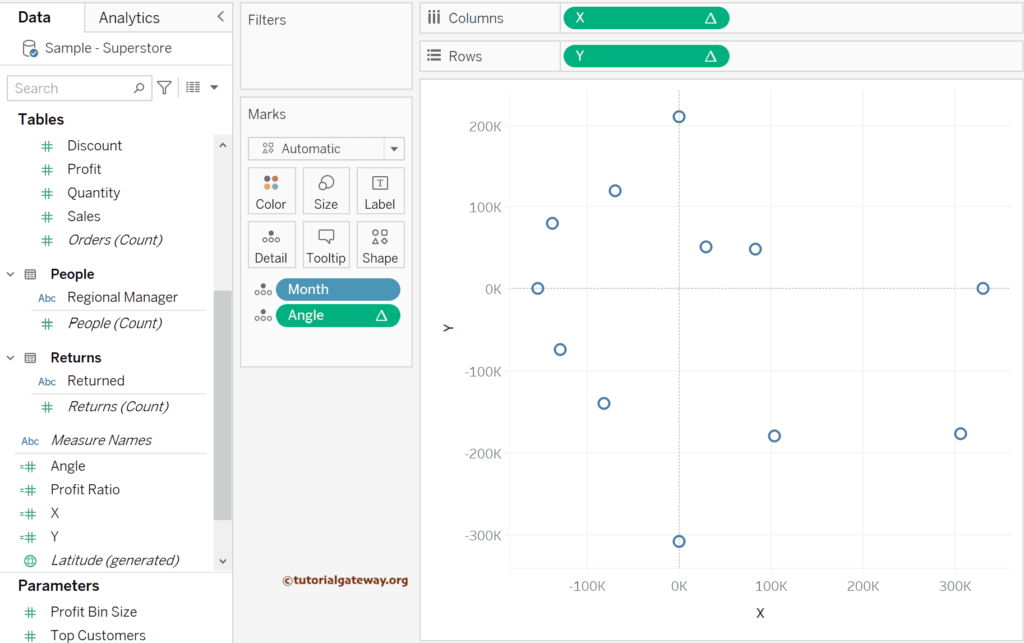
If you observe the above screenshot, it has the 0, 0 axes with 12 points. Each point has a particular angle, and the circle represents the endpoint.
Our job is to create a Radar chart, so please change the Tableau Mark type from Automatic to Polygon. Next, drag the Angle field from the Details shelf to the Path Shelf to see the actual chart.
Let me add the Order Date to the Color Shelf to see the Tableau Radar Chart for each Year. We have also added it to the Filters shelf to allow users to choose their desired years.
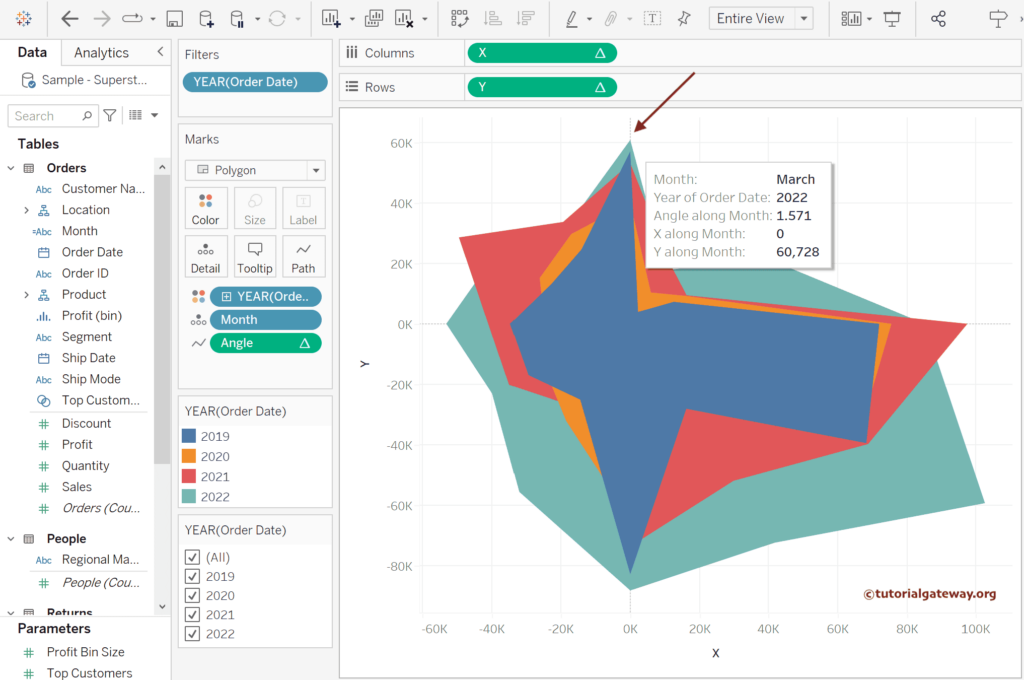
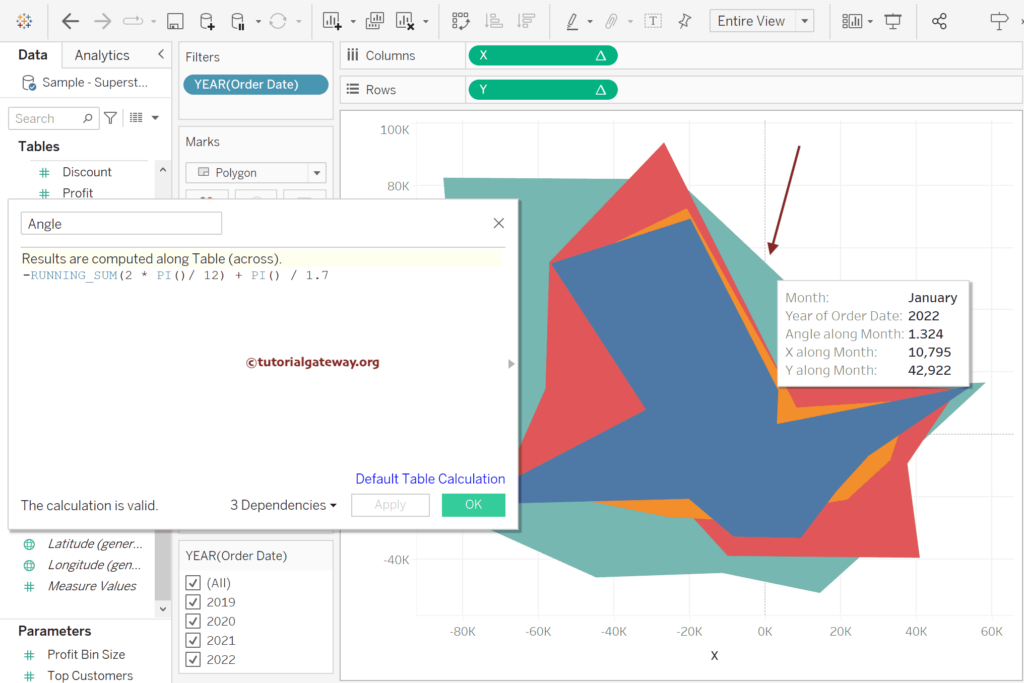
Although it looks perfect, if you see the months, at 0, 0 axis point, it starts with March Instead of January. So, let me edit the Angle calculated field and write the expression below.
-RUNNING_SUM(2 * PI()/ 12) + PI() / 1.7
Once you hit the apply button, you can see the Radar chart starts with January month.
How do you add Data points to the Radar Chart?
The above Tableau image looks like the Radar chart with a proper starting point. However, the chart looks brilliant if you can show the interaction points and proper Y-Axis alignment. So, add the Angle to the Details shelf, right-click the Y-Axis, and choose the Edit Axis option. As the data is between -120,000 and 120,000, we used them as the fixed range of the Y-Axis. Please change them as per the requirement.
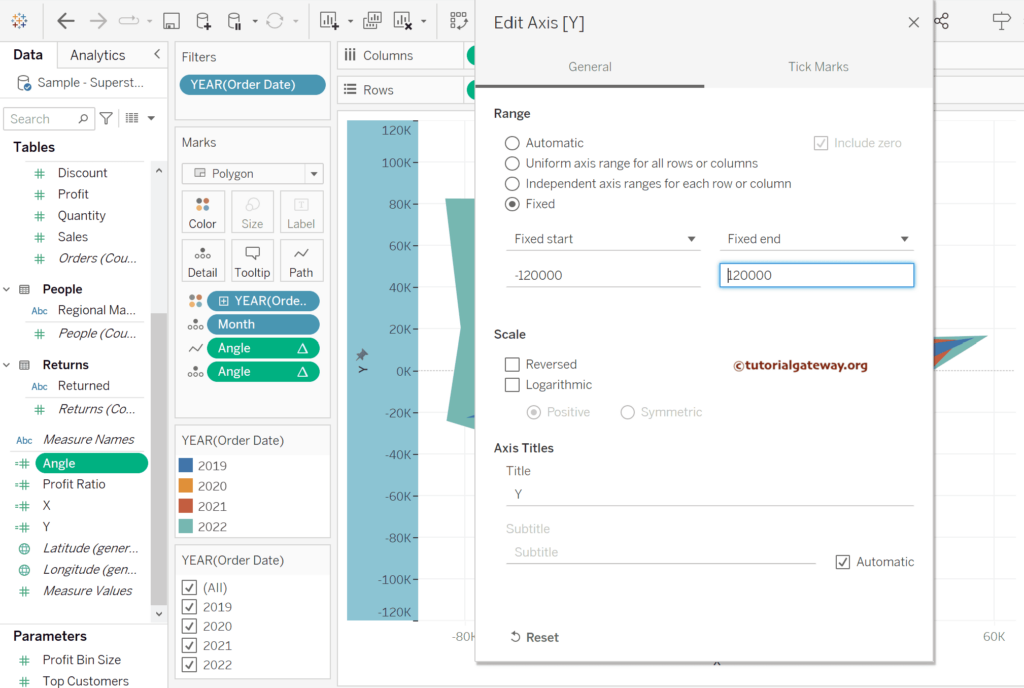
Drag and drop the Y calculated field to the Rows shelf again, change the Marks type to shape, and choose the required shape. Let’s choose the star as the shape of the intersection point. Next, click the down arrow beside the Y and choose the Dual Axis option.
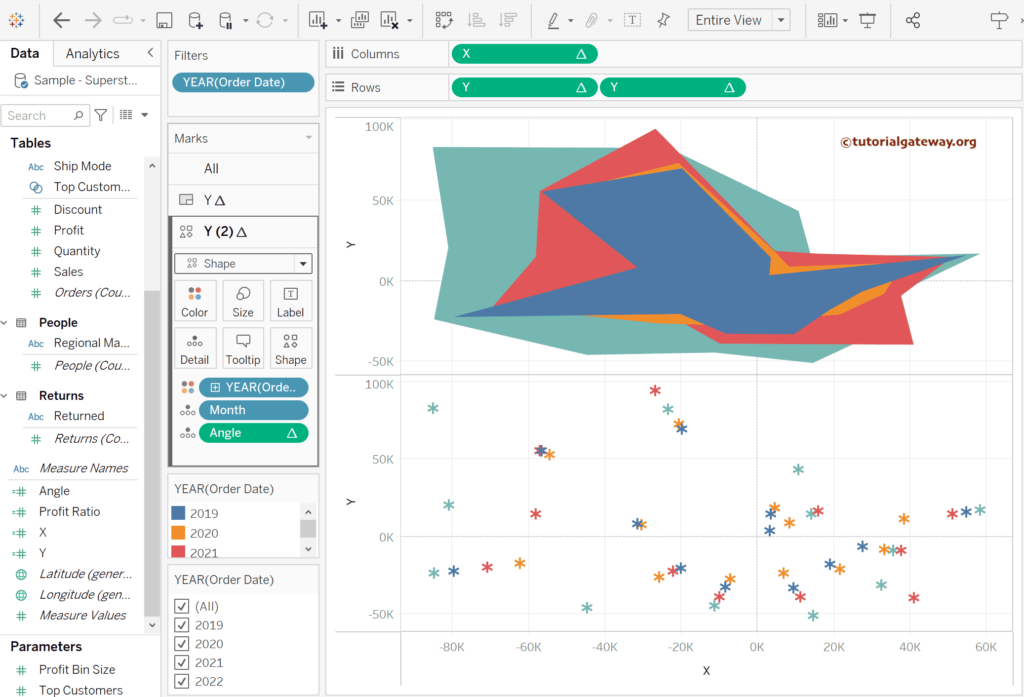
Next, right-click the right-side Y-Axis, choose Synchronize the Axis, and uncheck the Show Header option.
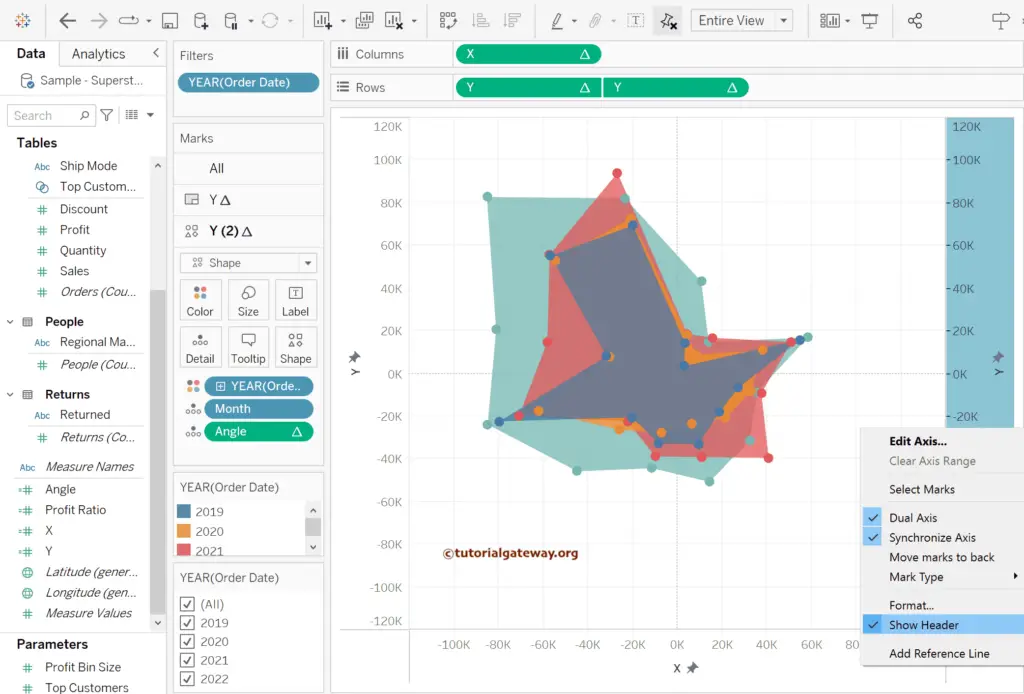
The below screenshot shows the perfect Radar chart.
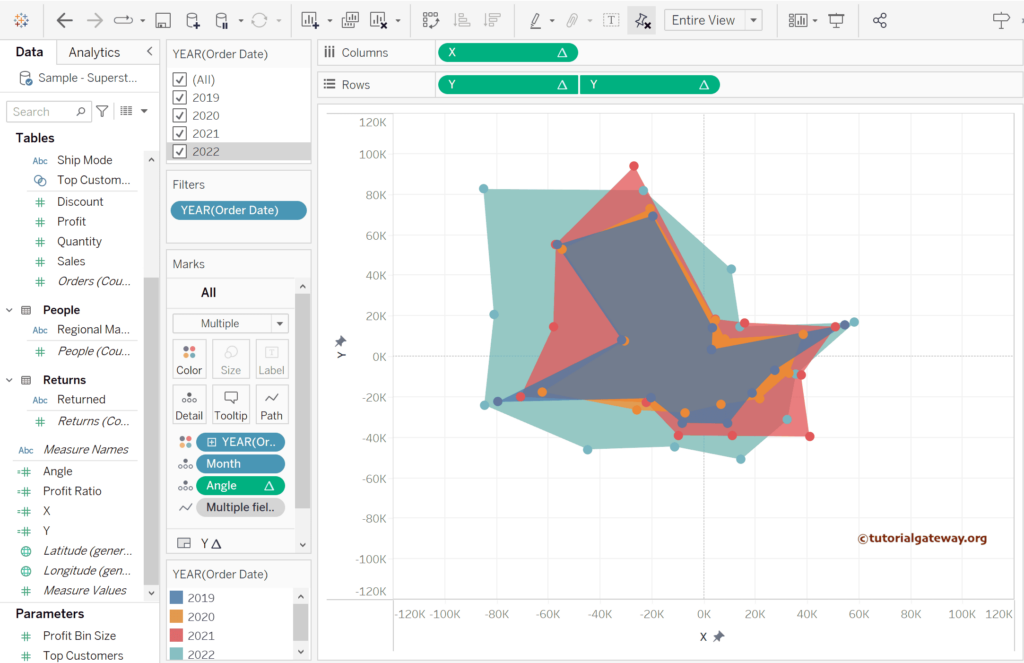
Add Filters to the Tableau Radar Chart
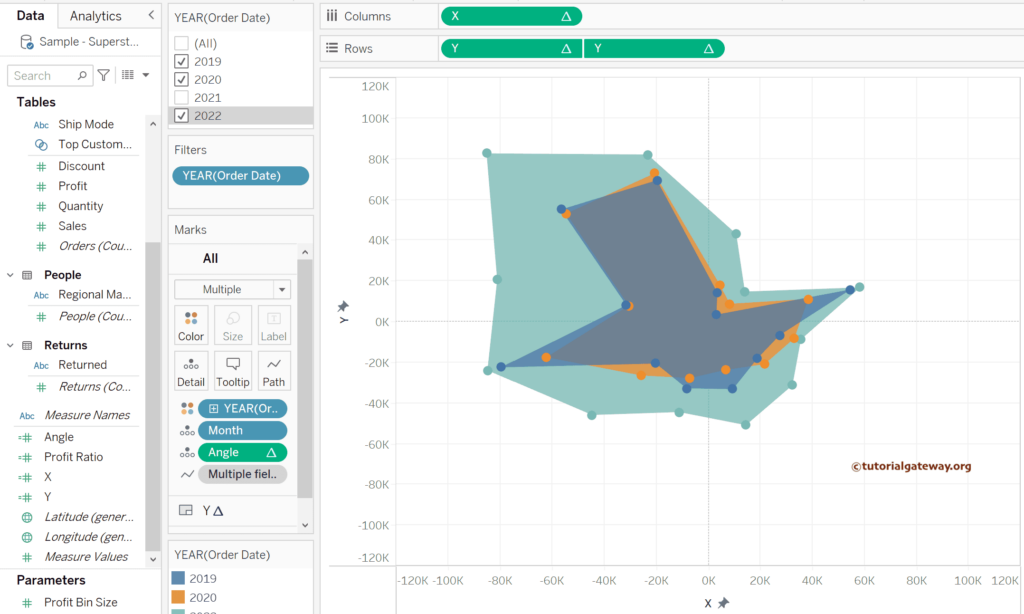
Let me apply the filters on the radar chart by unchecking the 2021 year. It will show the radar chart for 12 months for 2019, 2020, and 2022.
Add Data Labels
Drag and drop the SUM(Sales) to the secondary Y calculated field (Y(2)) Label shelf to add the data labels to the Tableau Radar chart.
