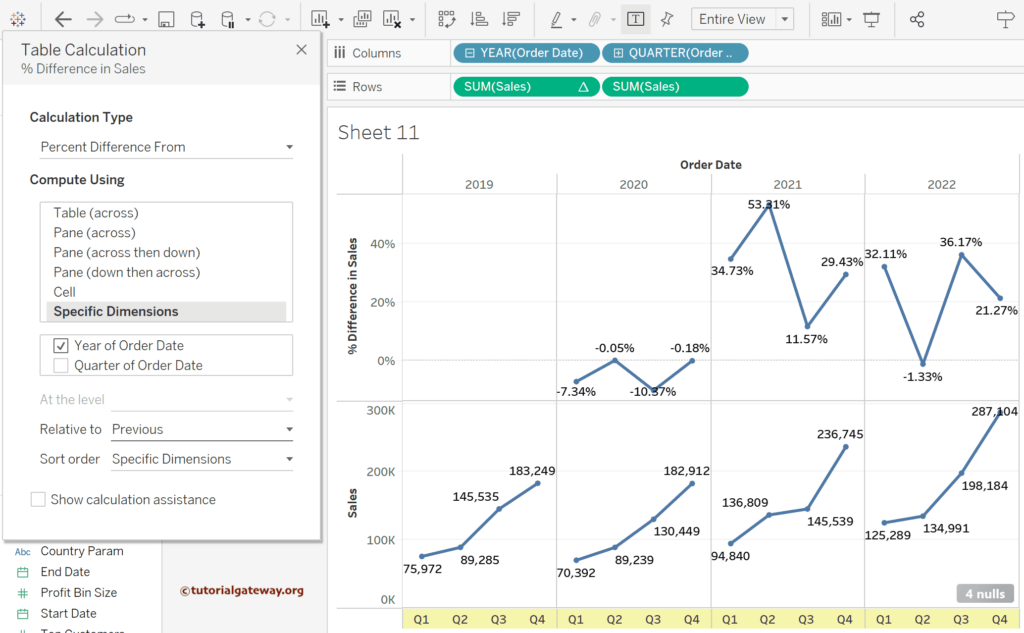
This Tableau Table Calculation article explains how to calculate the percentage difference between the previous year and this year. The percentage difference table calculation helps to understand the total percentage of sales’ downfall or upward trends.
To demonstrate the Tableau percentage difference calculation, we used the Sample Superstore Excel sheet. Please visit the Excel Source article to understand the Data Source.
Tableau Percentage Difference Calculation
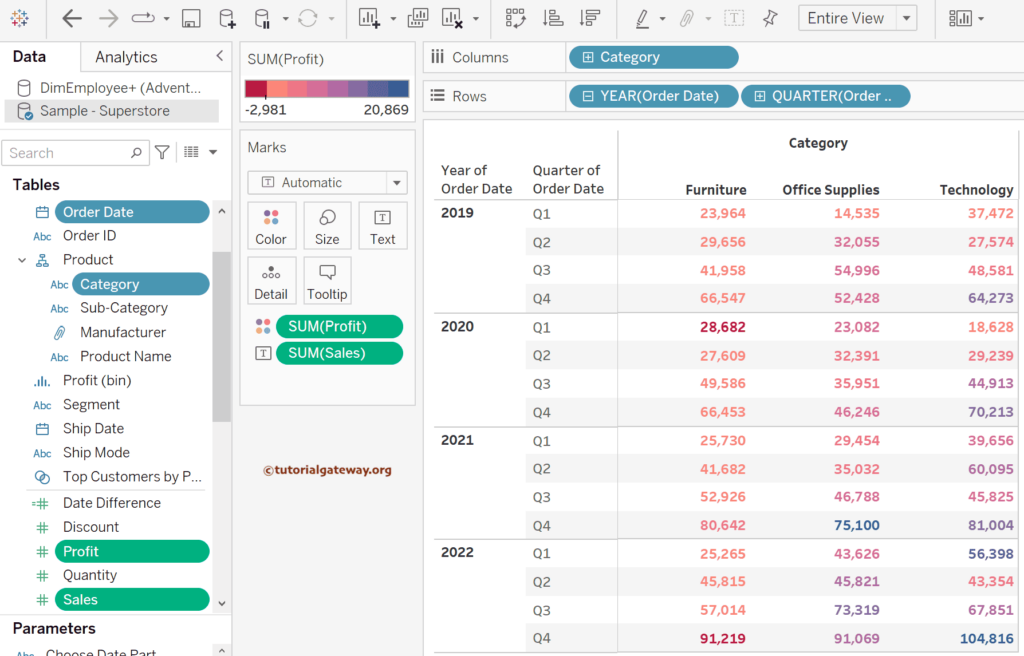
For this Tableau Percentage Difference Calculation, drag and drop the Category to the Columns shelf and Order Date to the Rows Shelf. Please expand the Order Date to show Year and Quarter sales. By default, it creates a Table report. If not, change the Mark type from Automatic to Text.
Next, add the Sales Measure to the Text shelf and the Profit measure to the Color Shelf. It means the color of each sales value depends on the profit. Please use the Edit Color option to change the Table color palette per the requirement. For the remaining charts in Tableau, please click here.
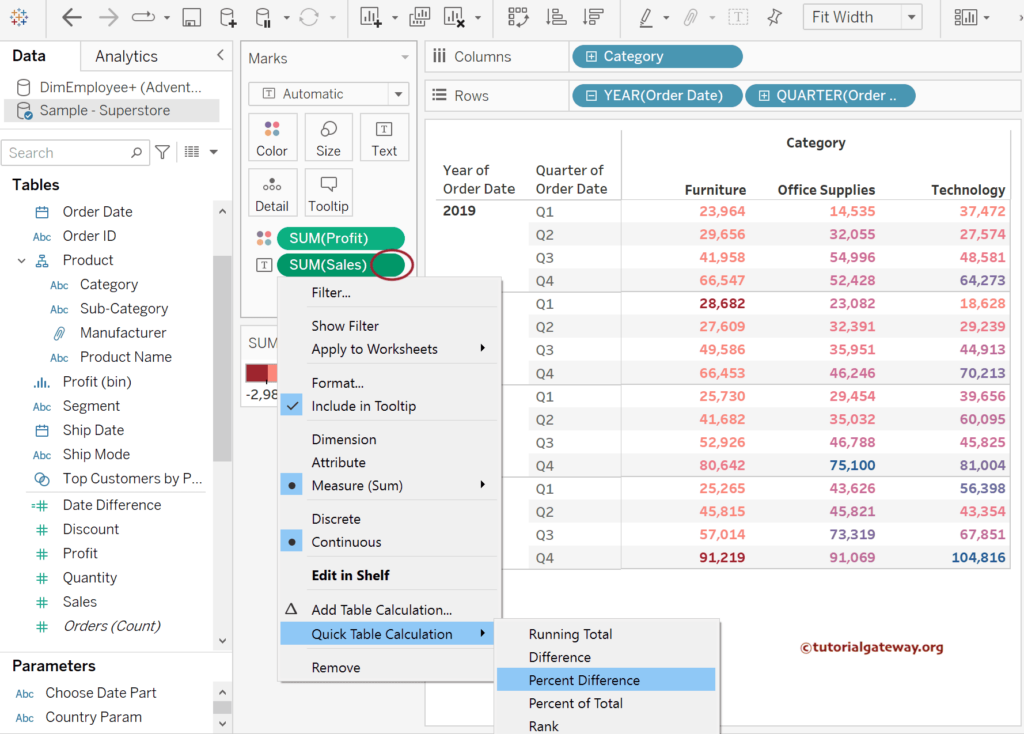
In this example, our goal is to calculate the percentage of difference. Tableau Desktop provides the Quick Table Calculation option with a predefined option called percentage difference.
Click the down arrow beside the SUM(Sales) in the Marks shelf, choose Quick Table Calculation, and select the Percentage Difference.
As you might need clarification with the Percentage of Difference Values, let me add the actual SUM(Sales) field to the Tableau table report so that you can compare the original value against the percentage of difference. To do so, double-click the Sales Measure to add to the Report. Next, remove the profit and add the Measure Names to the Color Shelf.
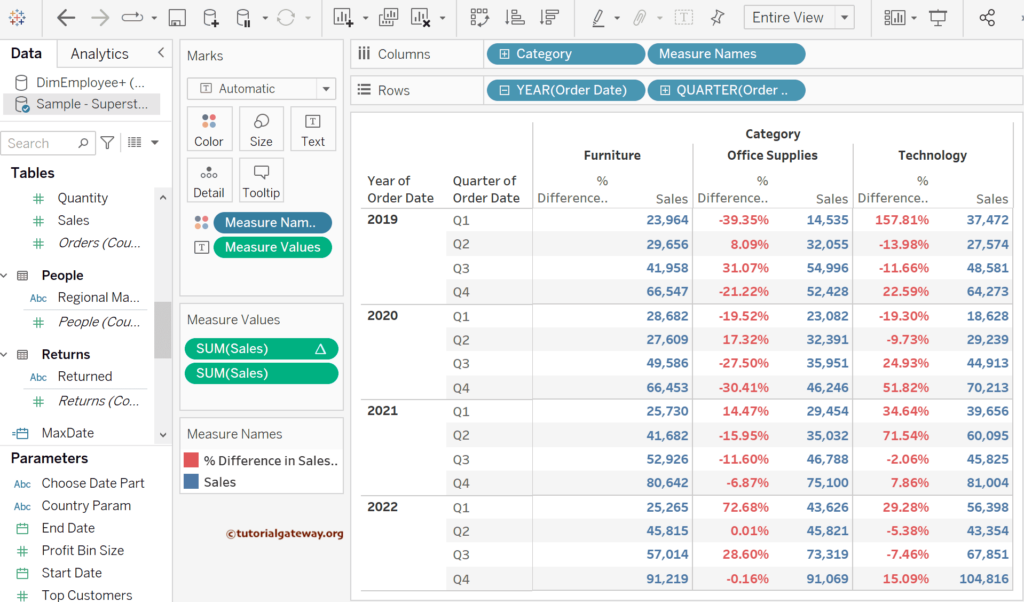
If you observe the Furniture category, there are no values for the percentage difference because there is no previous value to compare. To explain it, let us take the 2019 Q1 office supplies category: 23964 (Furniture) – 9429.834 (Office Supplies) = -39.35% difference. For more calculations >> Click Here.
The Tableau percentage difference calculation is computed using the Table (across) by default. However, you can change it as per the requirement. To do so, click the down arrow beside the SUM(Sales) table calculation, choose the Compute Using option, and select the Table (down). To explain the Table down, let me take the first two quarters of the 2019 Furniture sales: 23964 (Q1) + 5692 (23.75%) = 29656.
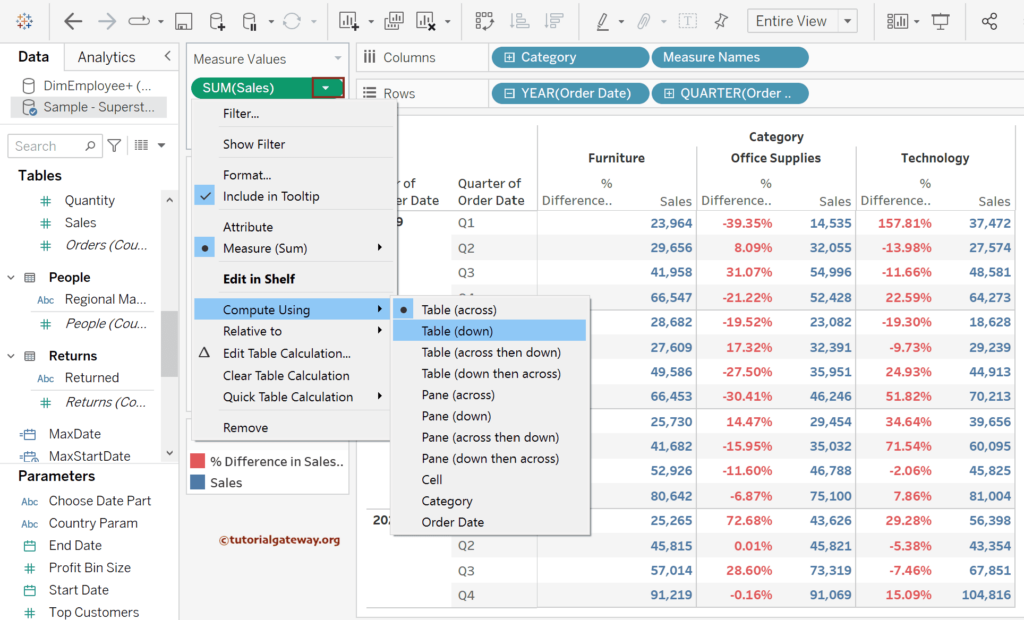
Apart from the approach mentioned above, there is another way to change the way the Table calculation has to happen. To do so, To do so, click the down arrow beside the SUM(Sales) and choose the Edit Table Calculation option.
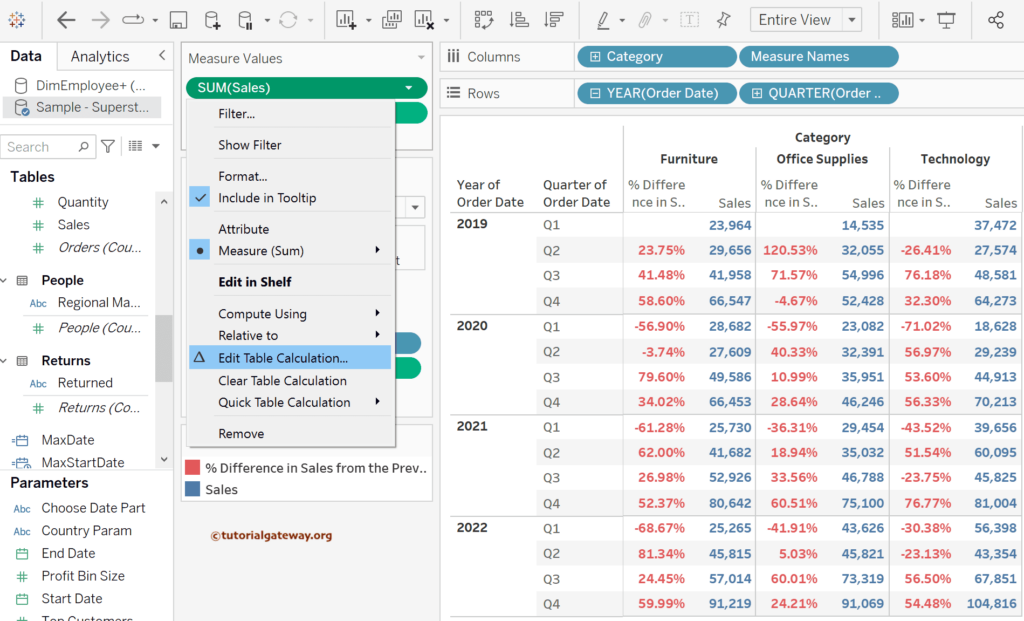
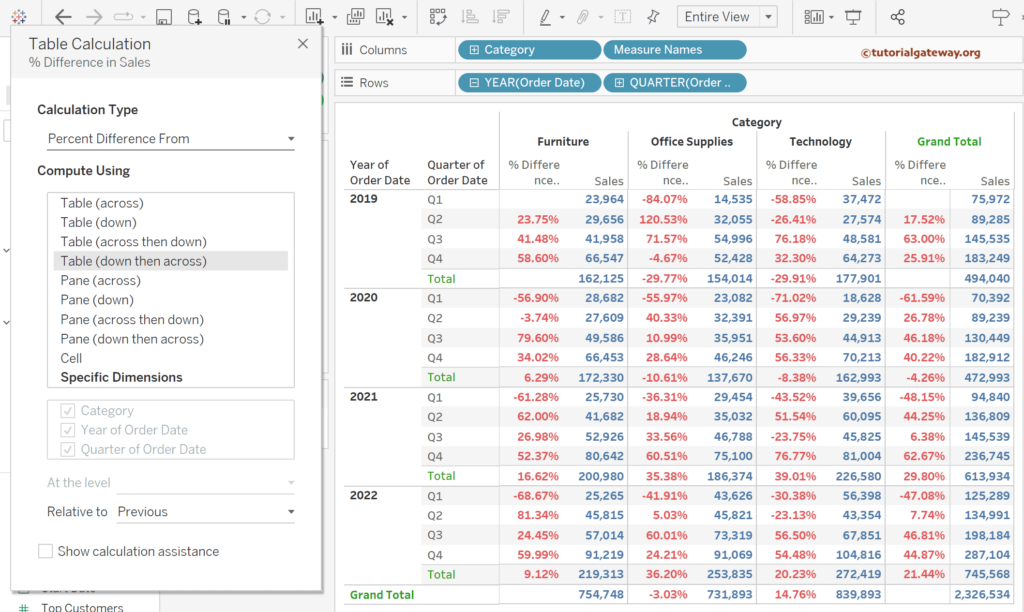
It opens the following window: the most powerful and efficient way to work.
Let me choose the Table down and then across. Tableau performs the percentage difference calculation for all the quarters in the Furniture category. It goes to the next category, i.e., Office Supplies. For instance, let’s take the 2022 Q4 of Furniture and the 2019 Q1 of office Supplies: 91219(2002 Q4 Furniture) – 14535 (2019 Q1 office Supplies) = -84.07% (76687.8133).
If you choose the Specific Dimension option and choose a category, it calculates the percentage of difference based on category. It produces the same result as the Table across.
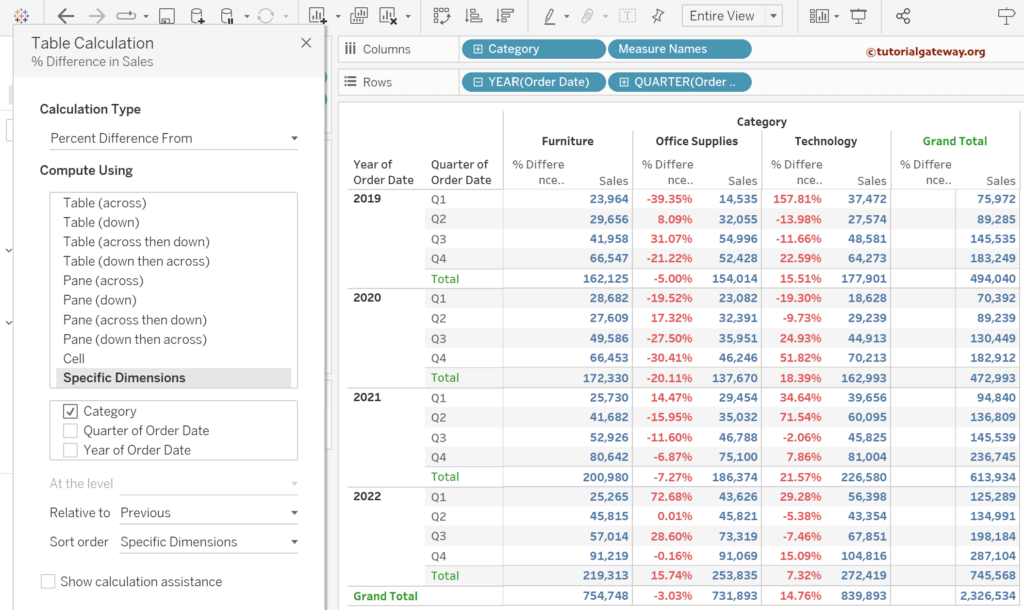
Suppose you see the Relative to option in all the above examples. In that case, it considers the Previous value as the reference point for the calculation. However, you can change it as per the requirement. To demonstrate the same, we change the Tableau percentage difference calculation based on the year of the order date and the reference value of the last (instead of the previous).
As it takes a year, there is the noblest value for 2022 (the last), and there are 0’s for this year. If you look at the 2019 Q1 Furniture percentage difference, -5.15%. 25265 (2022 Q1) – 5.15% (1301) = 23964 (2019 Q1).
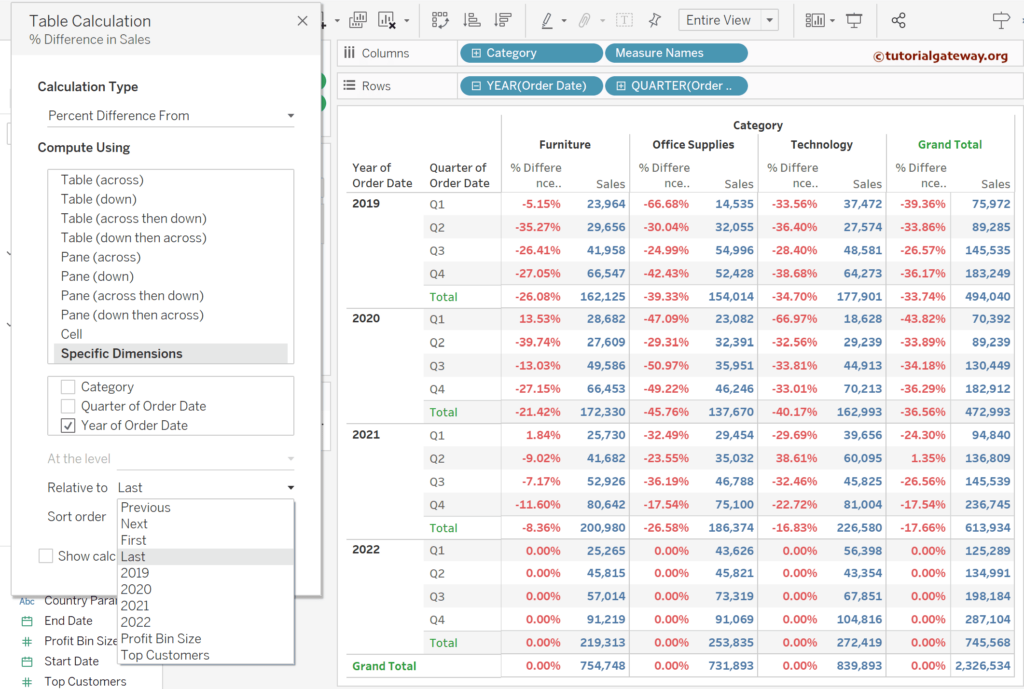
Tableau percentage difference calculation on Charts
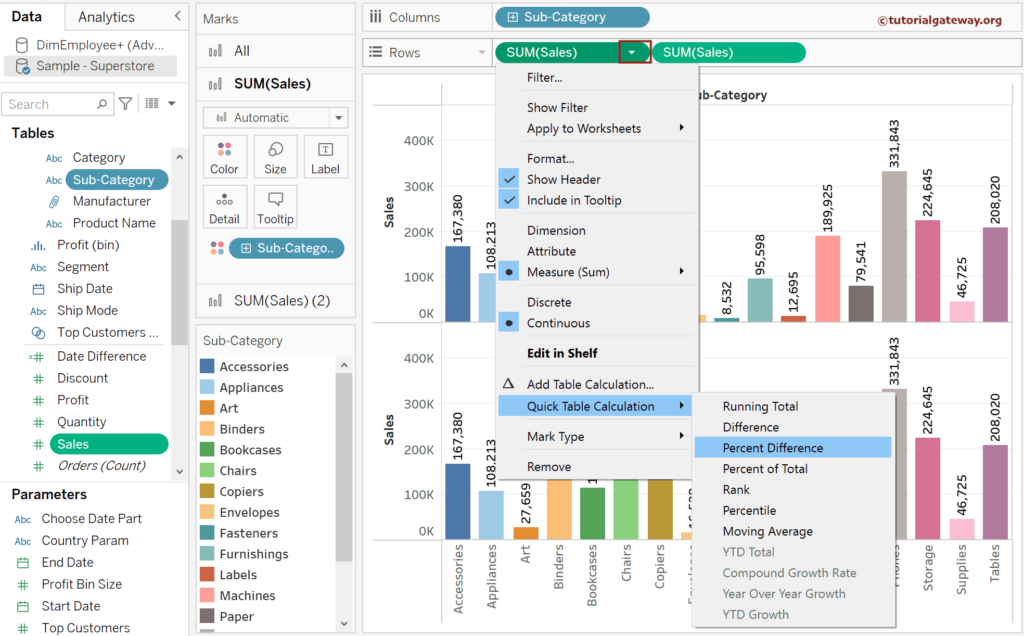
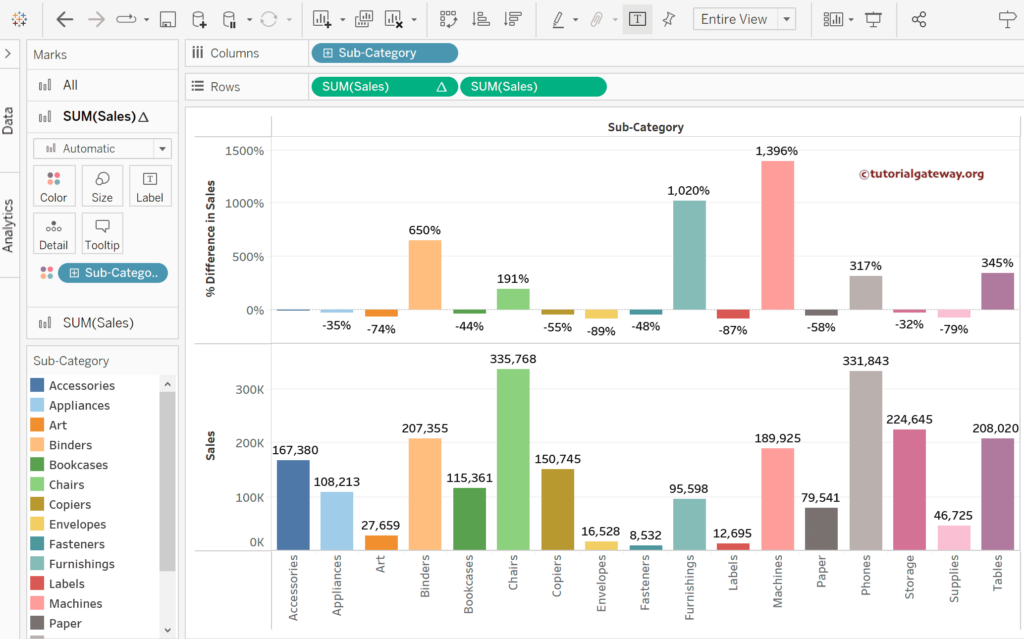
To demonstrate this, drag and drop the Sub-Category to the Columns shelf and Sales Measure to the Rows Shelf multiple times. Please add a Sub-Category to the color shelf and click the T button toad data labels. Next, click the down arrow beside the first SUM(Sales), choose Quick Table Calculation, and select the Percentage Difference.
The Tableau chart below shows the proper comparison of the actual sub-category sales against the percentage difference. You can easily make the decisions by seeing the negative and positive bars.
If you change the Bar Chart to a Line chart using the Marks type, the trend lines show more information. 1 Null will be shown. We chose the Show Data at Default Position option
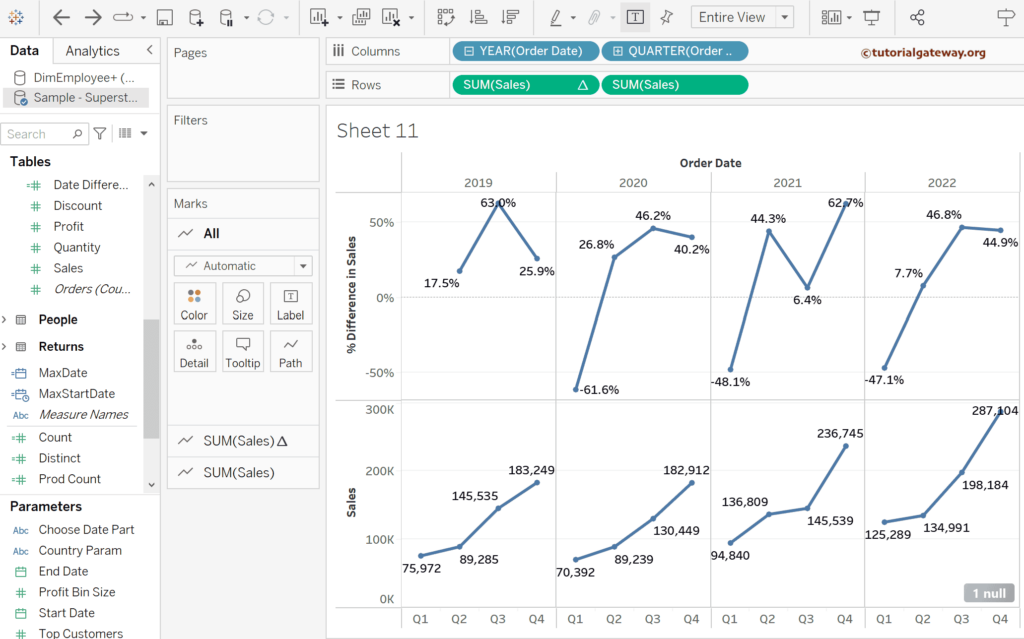
Even in the charts, you can modify the percentage calculation process from Table across (default) to your required dimension.
