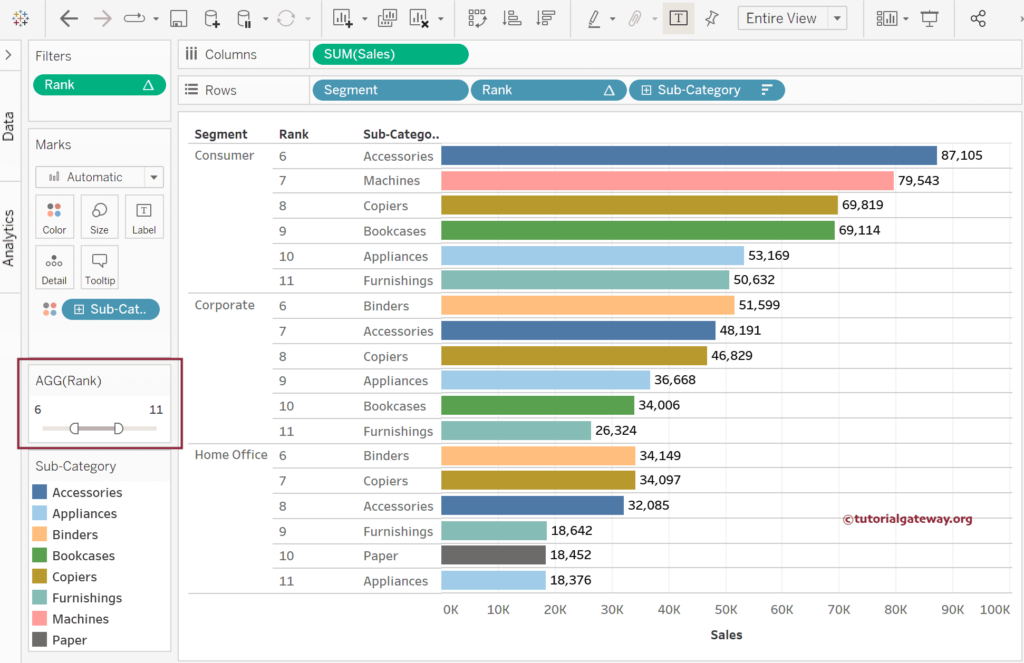
This article shows how to use this Tableau INDEX function to find the TOP N (3, 5, or 10) records, products, cities, or customers. It also covers the dynamic filter option to allow users to determine the TOP N value.
The Tableau INDEX function is one of the Table functions that returns the numbers from 1 to N, where 1 is the first table record, and N is the last. It is beneficial to display the Serial numbers, Rank, and top n rows.
The syntax of the Tableau INDEX function is as shown below.
INDEX()
To demonstrate this Tableau INDEX function to find the TOP N records, we used the below report using the Sample Superstore Excel Source. Drag and drop the Segment and Sub-Category into the Rows shelf to create the same. Next, add Sales to the Columns shelf and change the Mark type to Bar. Add Sub-Category to the Color shelf and click the T button to add the Data labels.
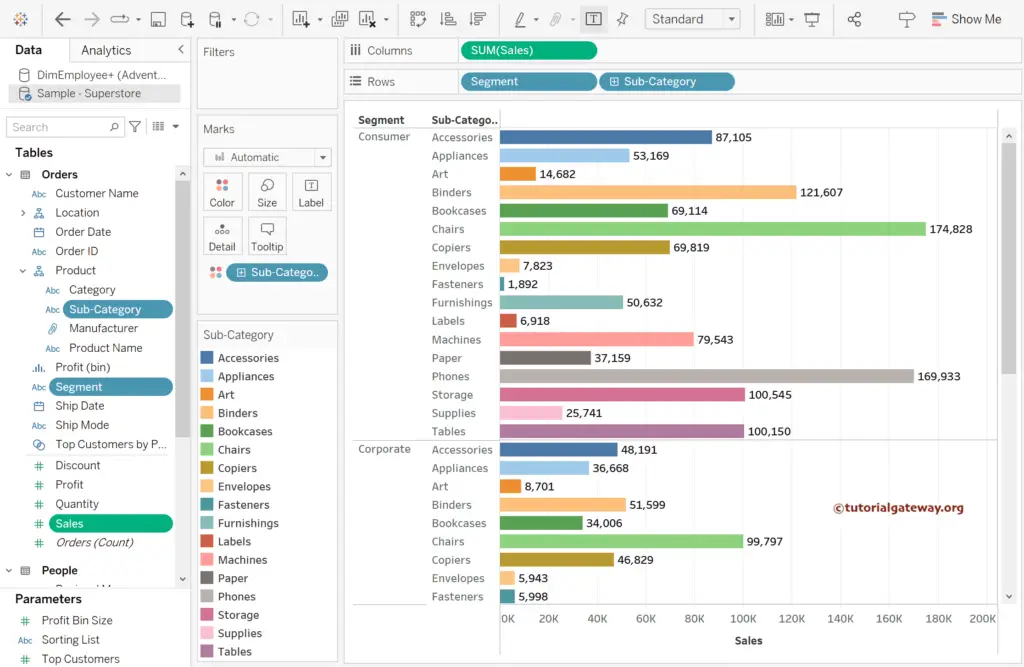
Tableau INDEX function to find the TOP N records Example
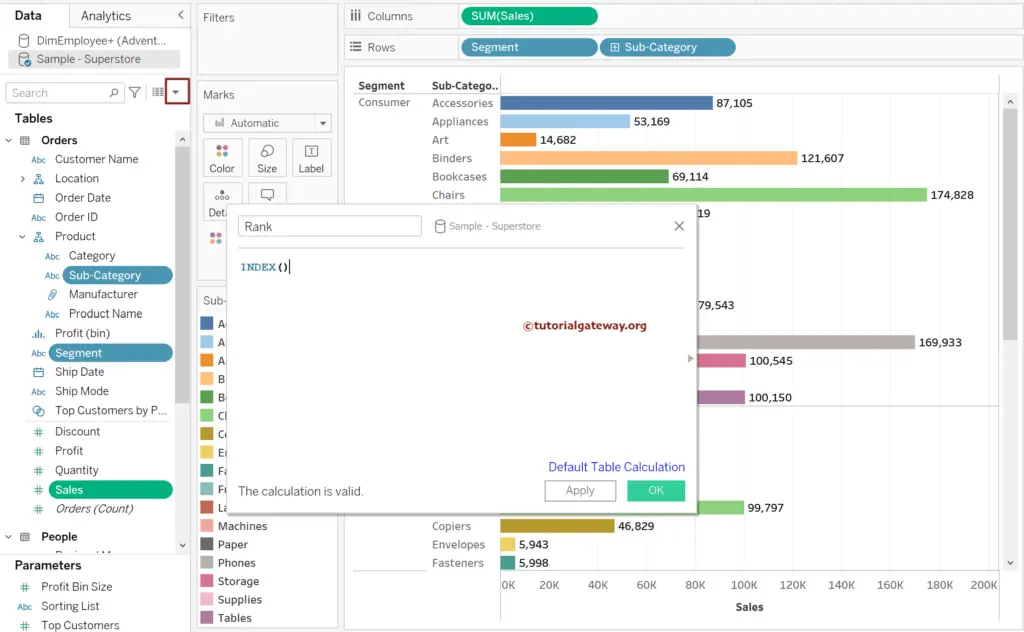
You must create a calculated field to write the built-in INDEX() function. Please click the marked-down arrow or go to the Analysis Tab to choose Create a calculated field option.
Here, we will write the following expression to display the numbers from 1 to N so that we can rearrange them for the final result. For the Bar Chart and remaining charts and supporting functions >> Click Here.
INDEX()
Please add the newly created Rank calculated field to the Columns shelf to see the output. By default, it returns sequential numbers from 1 to maximum row value. However, we expect the Tableau INDEX function to display the TOP N subcategories (records), so we must edit the calculation process.
To do so, within the Columns Shelf, click the Down arrow beside the Rank calculated field and choose the Edit Table Calculation Option.
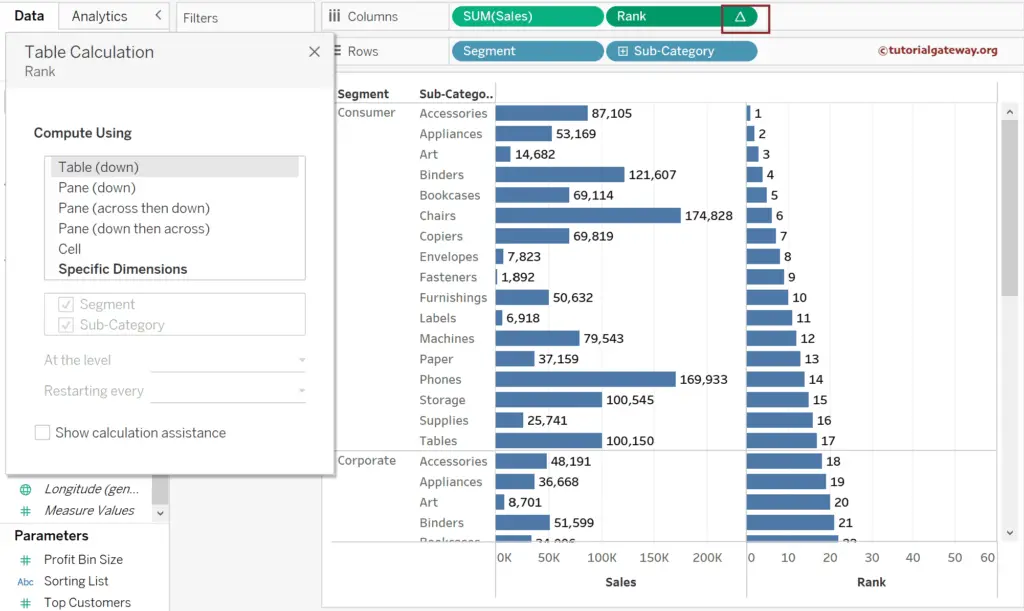
Please select the Specific Dimension option and use the Mouse to rearrange the Segment and Sub-Category fields, as shown below. It will open the following window, and you can see, by default, it is computing using Table (down). Please use this window to change the compute using option.
Please change the Table Function Compute using option to Specific Dimensions and follow the ordering of the Rows shelf.
- Restarting every: Segment.
- Sort Order: Choose custom sort, select Sales Measure with aggregate sum, and choose Descending order.
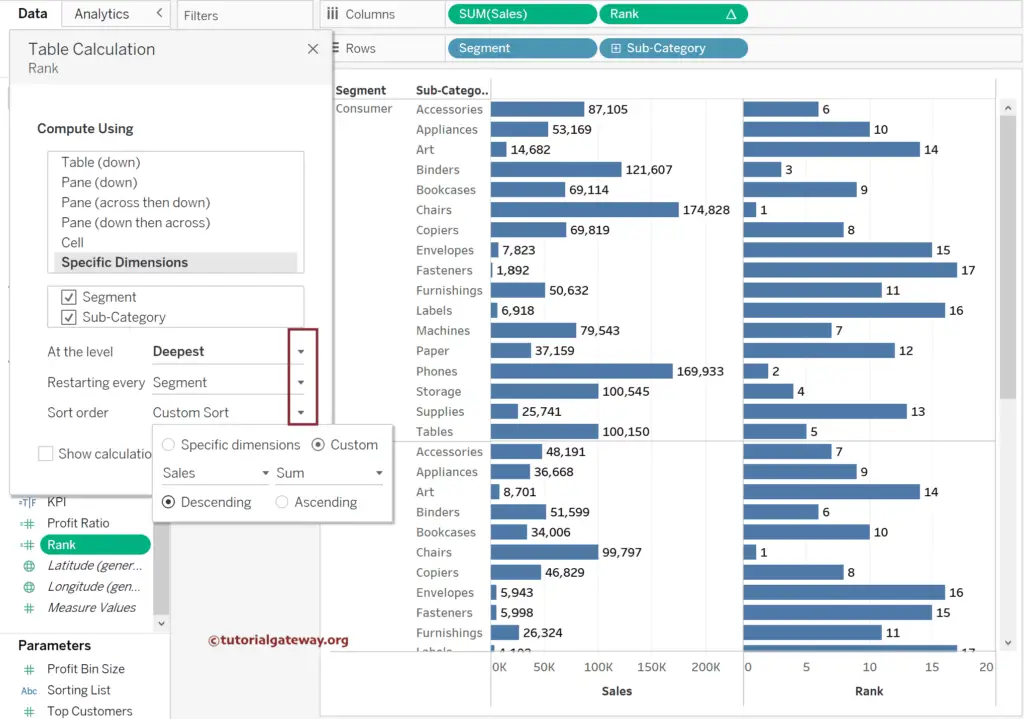
Next, change the Sort order to descending order using the toolbar. The Tableau INDEX function now provides ranks from 1 to N for each Product subcategory within the segments, so it’s easy to find and display TOP N records.
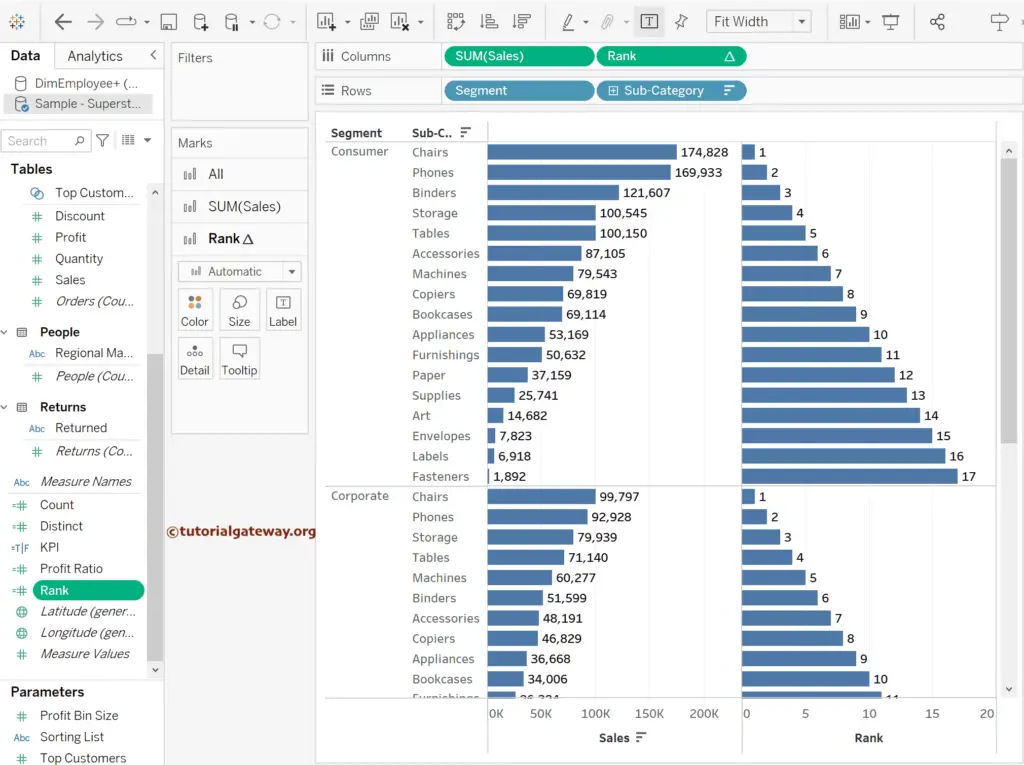
Tableau INDEX function to find the TOP N records using Filters
Use Control or Command to hold the Rank calculated field and drop to the Rows Shelf. Next, please change it to Discrete and place it between the Segment and Sub-category. Next, drag and drop the Rank field from the Columns Shelf to the Filters Shelf. It will open the following window to choose the range of values. Select 5 to see the Top 5 product subcategories within each segment.
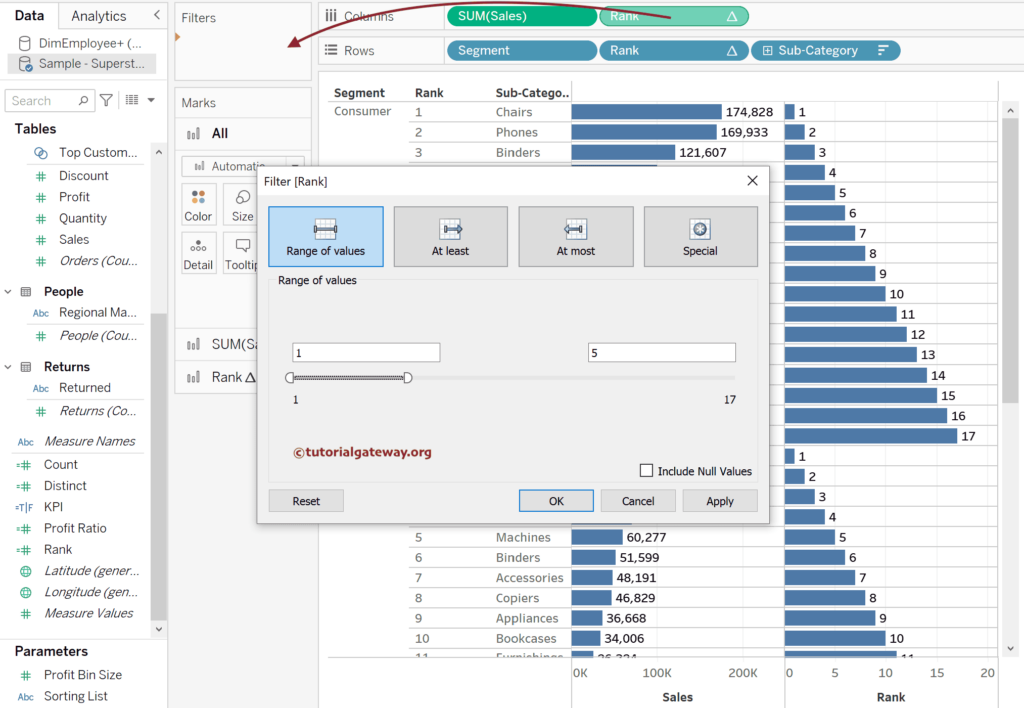
Please check the Tableau image below for the TOP 5 products. How about giving control to users to choose the N value? To do so, within the Filters Shelf, click the down arrow beside the Rank field and choose the Show Filter option.
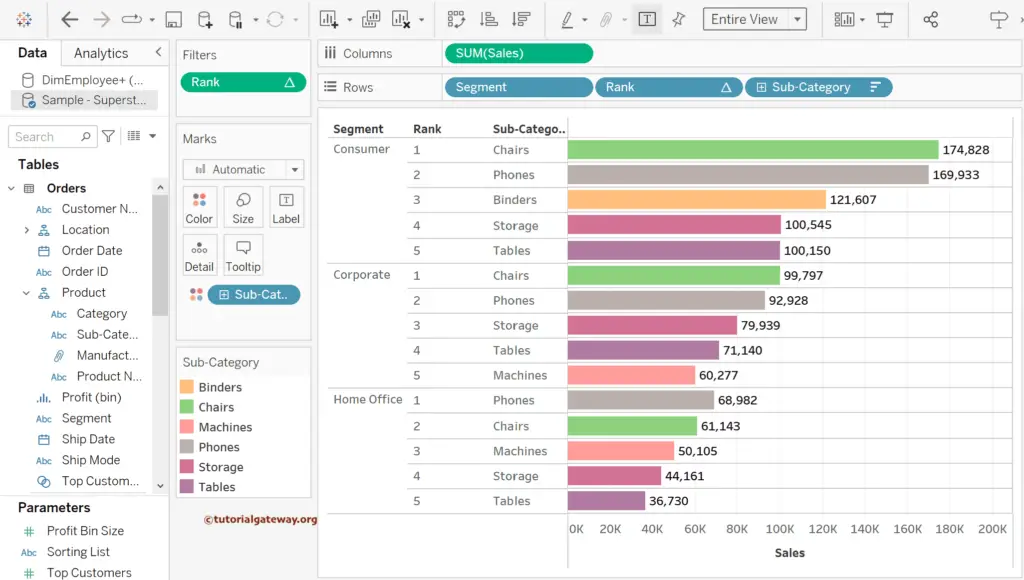
Now, you can see the top 8 records.
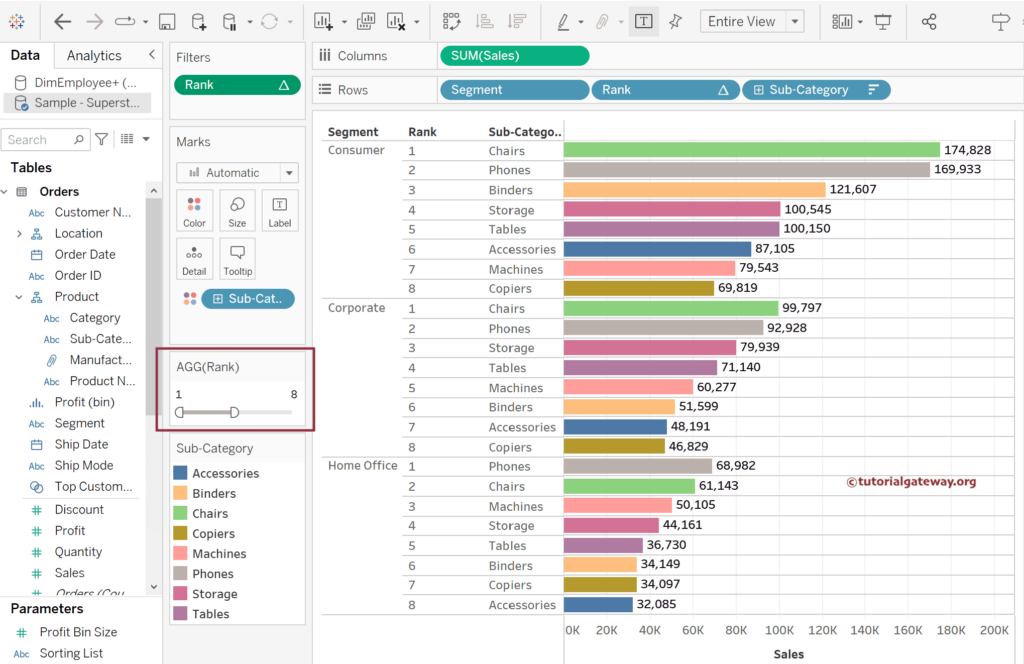
You can even select the random first and last values.
