The Power BI Stacked Bar Chart is useful for comparing multiple dimensions against a single measure. Let me show you how to create a Stacked Bar Chart with examples.
For this Power BI Stacked Bar Chart demonstration, we will use the SQL Data Source that we created in our previous article. So, Please refer to the Connect Power BI to SQL Server and the List of Charts article to understand the Power BI Data Source.
How to Create a Power BI Stacked Bar Chart
To create a Stacked Bar Chart, first Drag and Drop the Sales Amount from the Fields section to the Canvas region. It automatically creates a Column Chart.
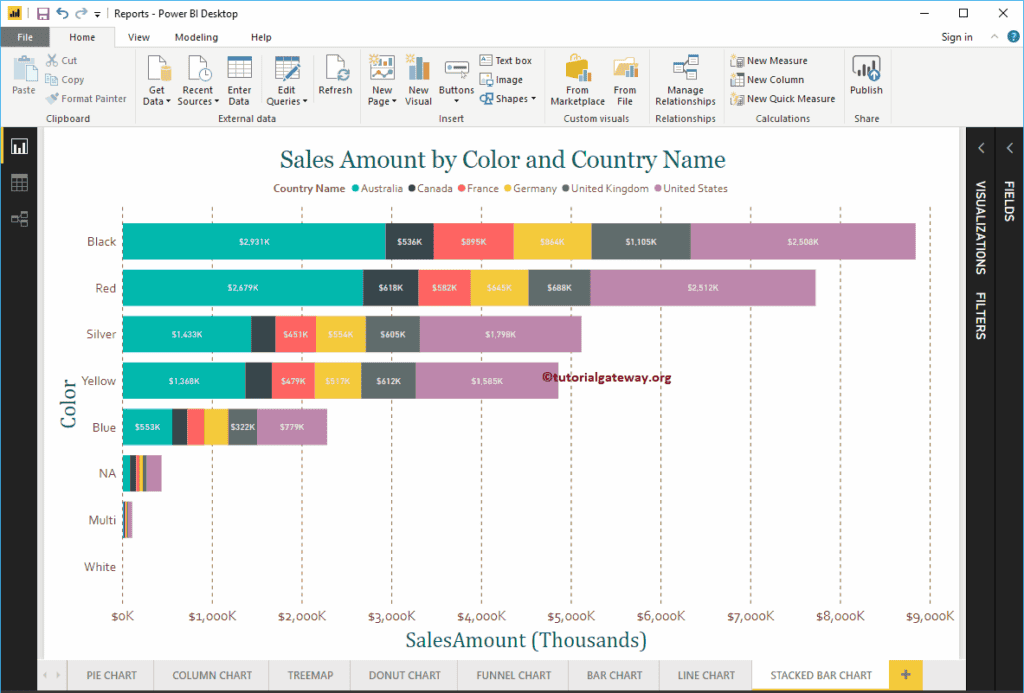
By clicking the Stacked Bar Chart under the Visualization section, it automatically converts the Column Chart into a Stacked Bar Chart, as shown in the screenshot below. Next, let me add Color to the Axis section to create a Bar chart that shows the Sales Amounts by Color.
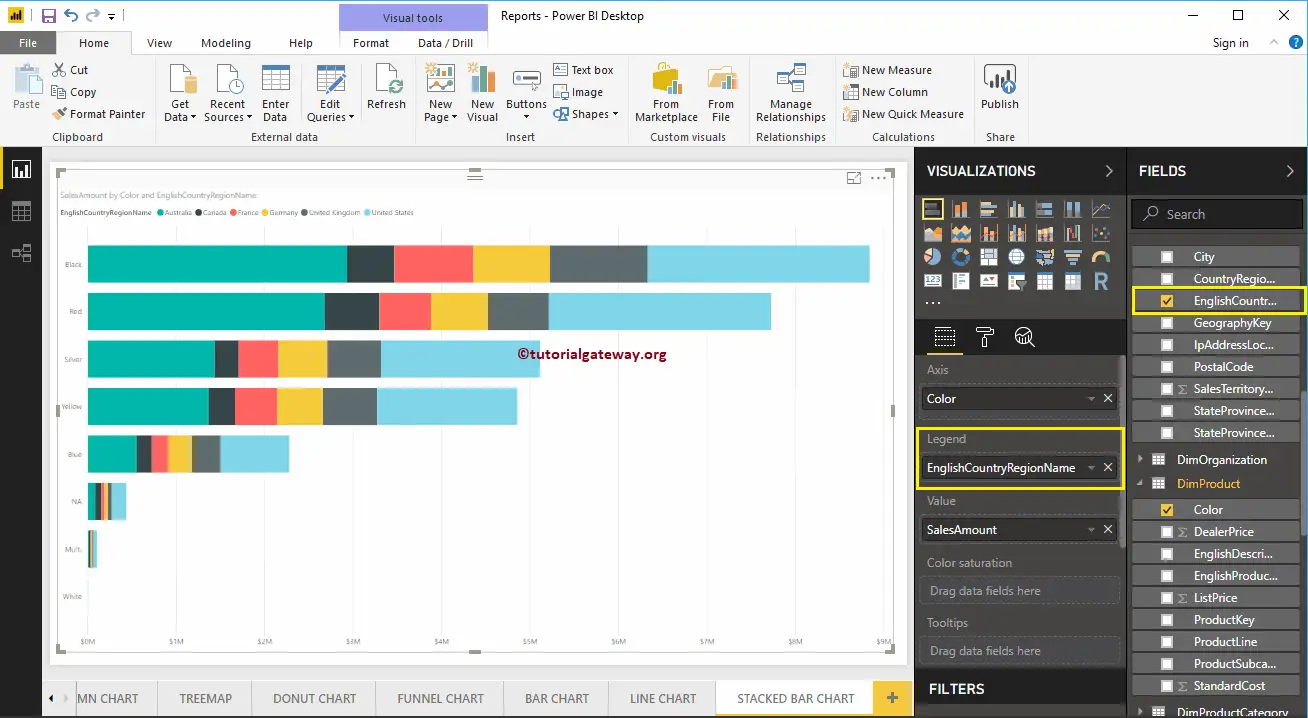
Next, we add the English Country Region Name to the Legend section to convert it into the Stacked Bar Chart.
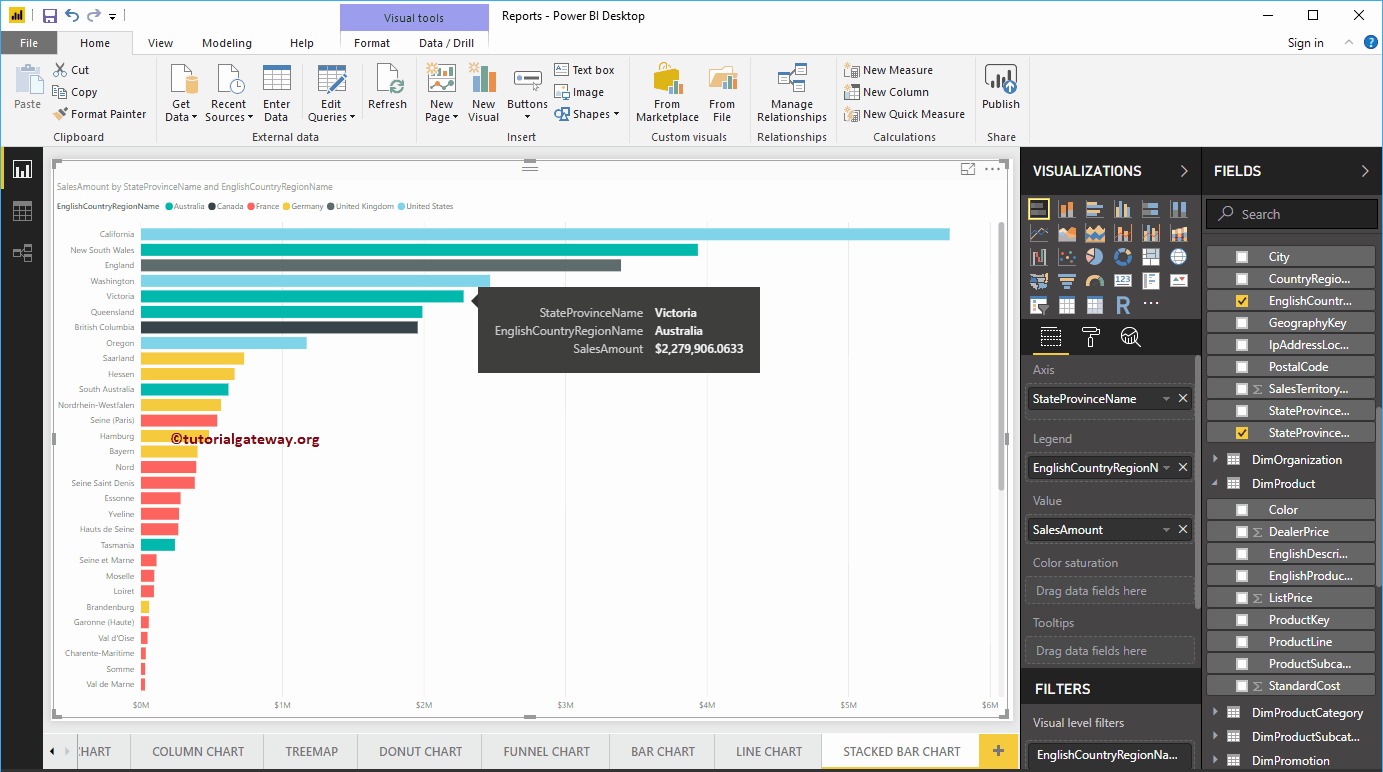
This time, we added the State Province Name to the Axis and the Country to the Legend. From the screenshot below, you can see that the Country Name is acting as the Bar Color. It is because you can’t group the Country Names inside a State ( State Name Inherited from Country). Please remember this while you are working with a stacked bar chart.
Hover over any stacked bar showing the Tool-tip of the State Name, Country, and Sales Amount.
Create a Power BI Stacked Bar Chart Approach 2
First, click on the Stacked Bar Chart under the Visualization section. It automatically creates a Stacked Bar Chart with dummy data, as shown in the screenshot below.
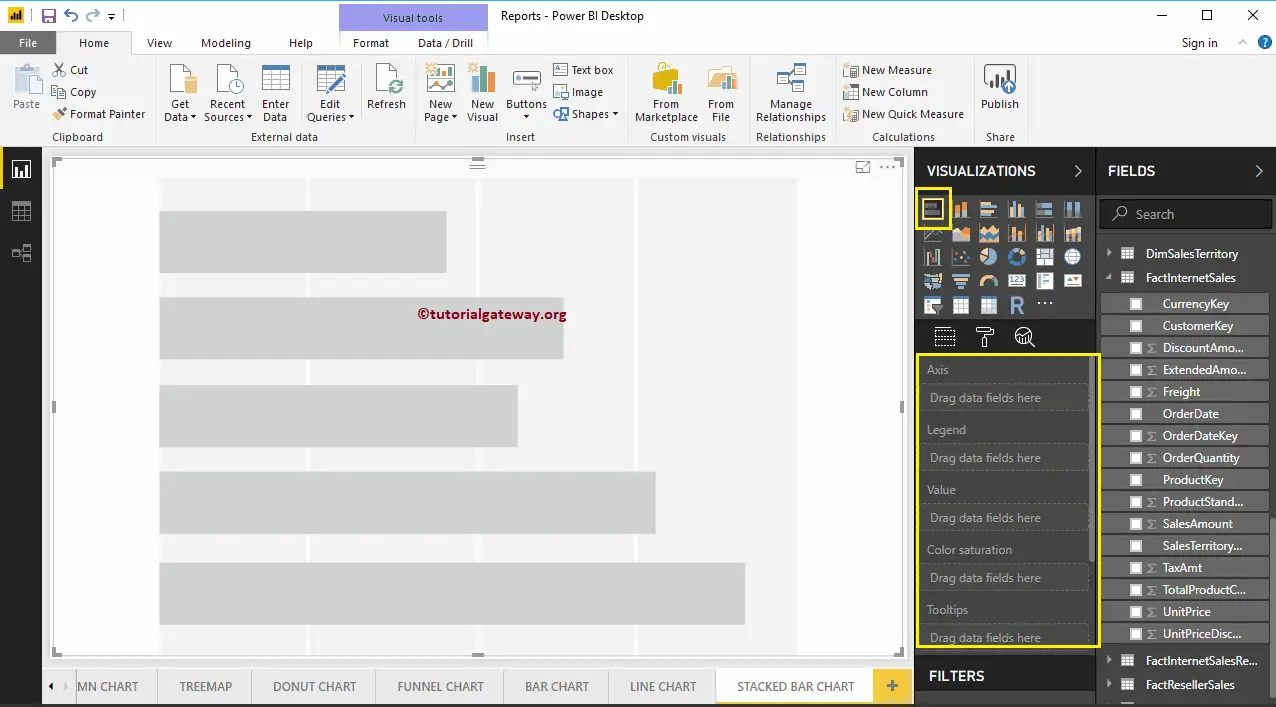
In order to add data to the Power BI Stacked Bar Chart, we have to add the required fields:
- Axis: Please specify the Column that represents the Horizontal Bars.
- Legend: Specify the Column to divide the Horizontal Bars.
- Values: Any Numeric value, such as sales amount, Total Sales, etc.
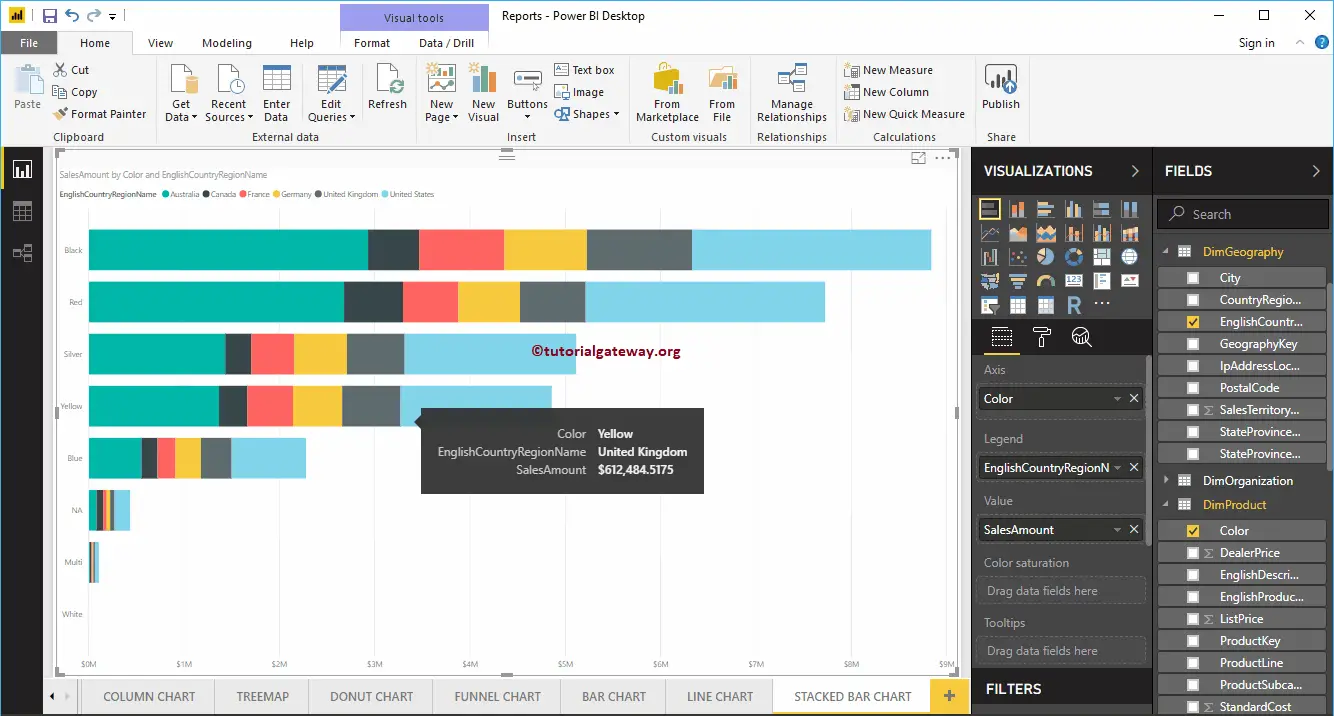
Let me drag the Sales Amount from the Fields section to the Values field and the Color field to the Axis Section. Next, add the English Country Region Name from the DimGeography table to the Legend section. You can do this by dragging Country to the Legend section or simply checkmark the English Country Region Name column.
Now you can see a Stacked Bar Chart representing Sales by Color, further divided by Country Name. Hovering over any portion on a bar shows the Tool-tip of Color, Country, and its Sales Amount.
Let me do some quick formatting to this Stacked Bar Chart
NOTE: I suggest you refer to the Format Stacked Bar Chart article to understand the steps involved in formatting the Stacked Bar Colors, Chart Title, Data Color, Background Color, Axis Colors, Axis font style, and colors, etc.