The Power BI MAX function is a DAX aggregate function used to find and return the largest value in a given column or between two given scalar expressions. This article explains how the DAX MAX function compares the two expressions or all column values and returns the largest value.
The syntax of the Power BI DAX MAX function is as shown below:
MAX(ColumnName)

MAX(Expression 1, Expression 2)
Apart from the above, the MAX function also works on string columns, using the alphabetical order to compare them and return the largest.
Power BI DAX MAX Function Example
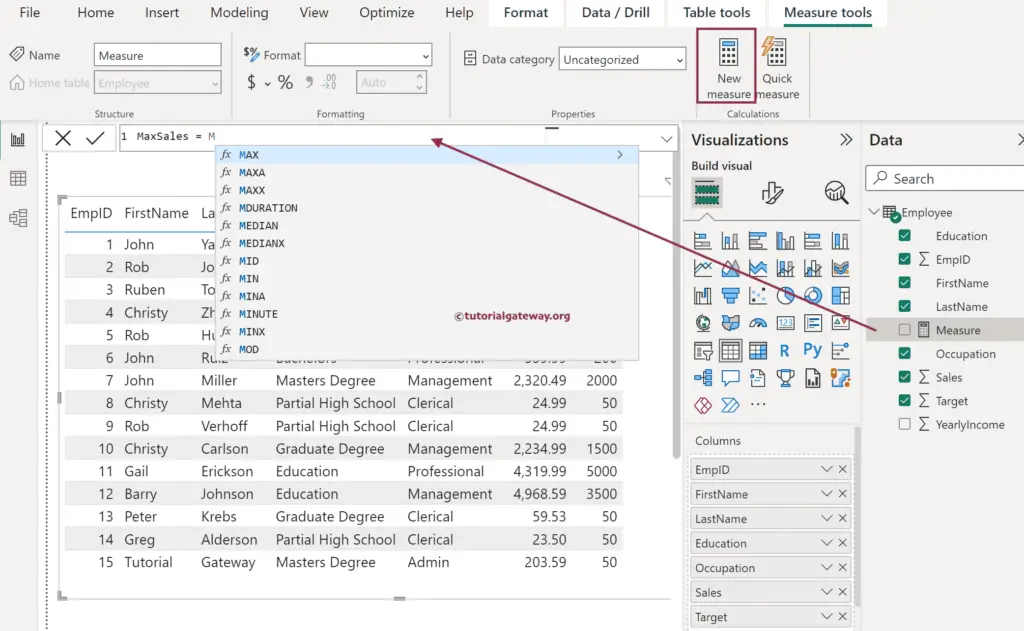
To create the same, click the New Measure button within the Home tab to write the expression and rename it per the needs. Let me name it the MaxSales and type M after the equals operator to see the suggestions.

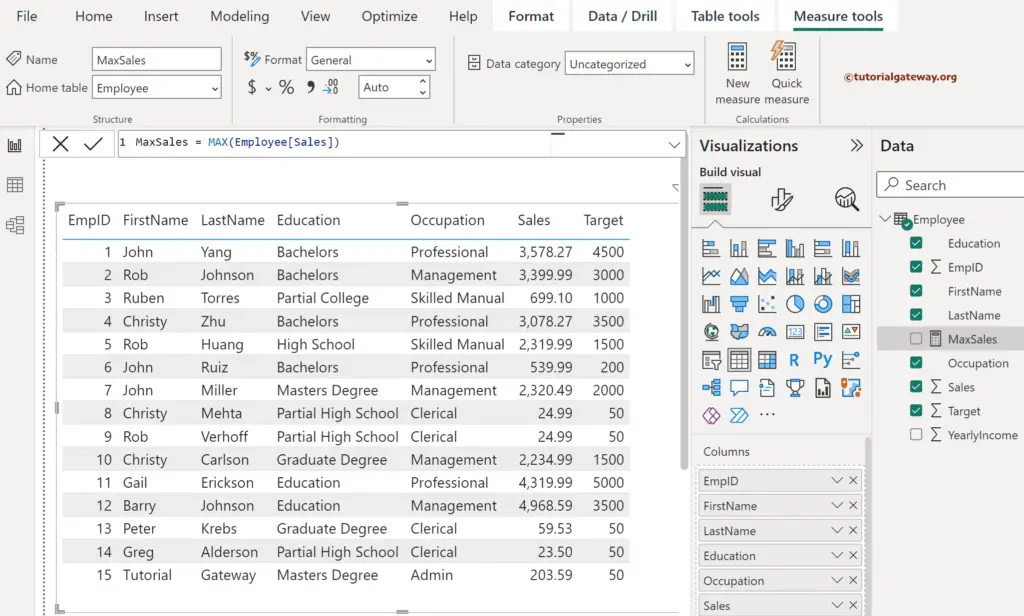
To demonstrate the DAX MAX() function, I use the Sales column from the Employee table to obtain the maximum sales. Please click the down arrow beside the numeric fields and Choose the Don’t Summarize option. The final expression (New Measure) generated by the desktop or written manually is.
MaxSales = MAX(Employee[Sales])

Let me create a card with the highest sale value and a Bar chart to show the maximum sales by the Employee Occupation result. Please refer to the Aggregate and DAX functions article for the remaining Power BI functions.

Power BI DAX MAX function with two arguments
As mentioned earlier, you can use the MAX function with two scalar expressions to find the maximum one. To demonstrate the same, let me create a new column. The calculated column helps work on the individual row levels. So, go to the Modeling, Home, or Column Tools Tab and click the New Column button.
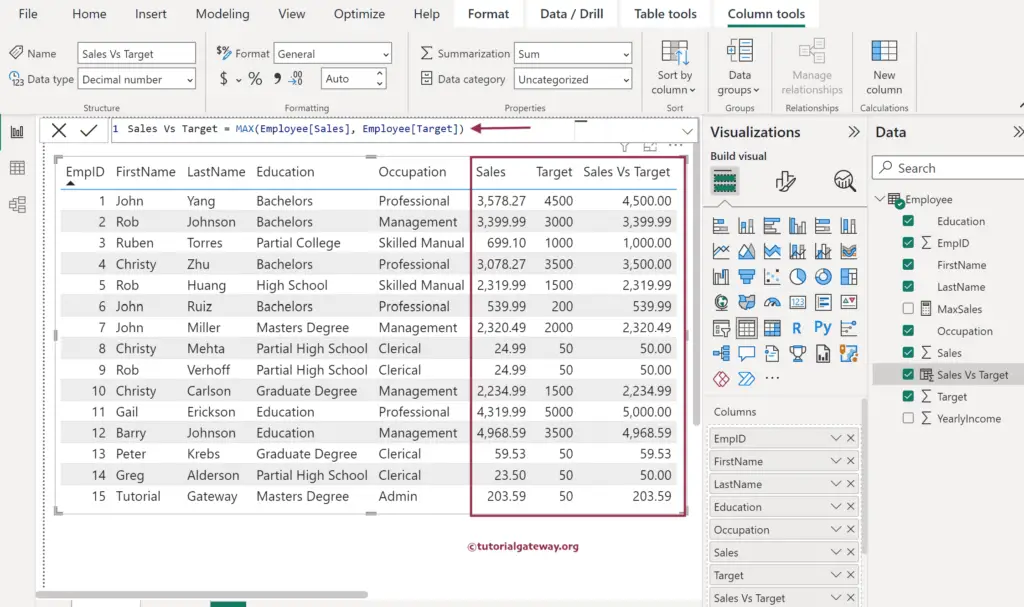
Let me create a Calculated column to use the MAX function to find the largest value between the actual sales and the Target value. Remember to click the confirm button. Please refer to the New Measure and New Column articles.
Sales Vs Target = MAX(Employee[Sales], Employee[Target])

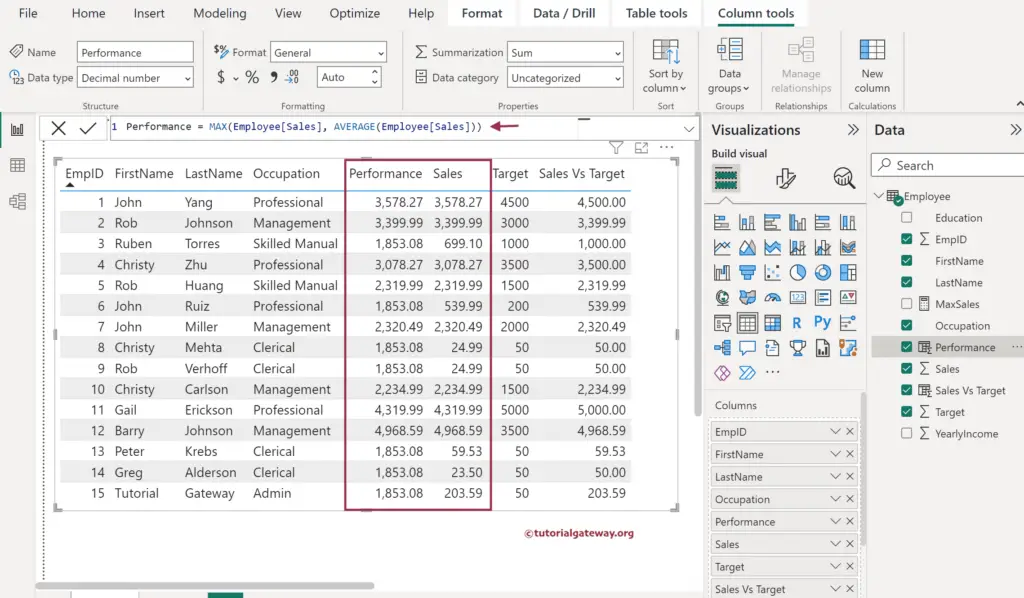
The DAX MAX expression below (New Column) compares each Sales row against the sales average. It returns the highest among the actual sales and their average. If you notice the performance column, you can see multiple 1853.08 values because it is average. The sales for that particular row are less than average.
Performance = MAX(Employee[Sales], AVERAGE(Employee[Sales]))

