This Tableau article explains how to make dynamic KPI or Key Performance Indicators with parameter or Filter actions with an example. Instead of fixing the KPI value, users can enter their own value and play with different ranges to see the opportunities.
To demonstrate the Tableau KPI with dynamic parameter value, we used the DimGeography, DimProduct, and FactInternetSales tables from the AdventureWorksDW database. Please visit the SQL Source and SQL Tutorial article to understand the Data Source.
To fulfill this requirement, we need a Tableau parameter for dynamic KPI values and a calculated field to incorporate the parameter inside a report.
Tableau KPI with parameter on Bar chart
Drag and drop the Sales Amount Measure to the Columns shelf and the English Country Region Name dimension to the Rows Shelf. By default, it will create a Horizontal Bar Chart. If not, change the Marks type from Automatic to Bar. Next, click the T button in the toolbar to add the Data labels. For the remaining charts in Tableau, please click here.
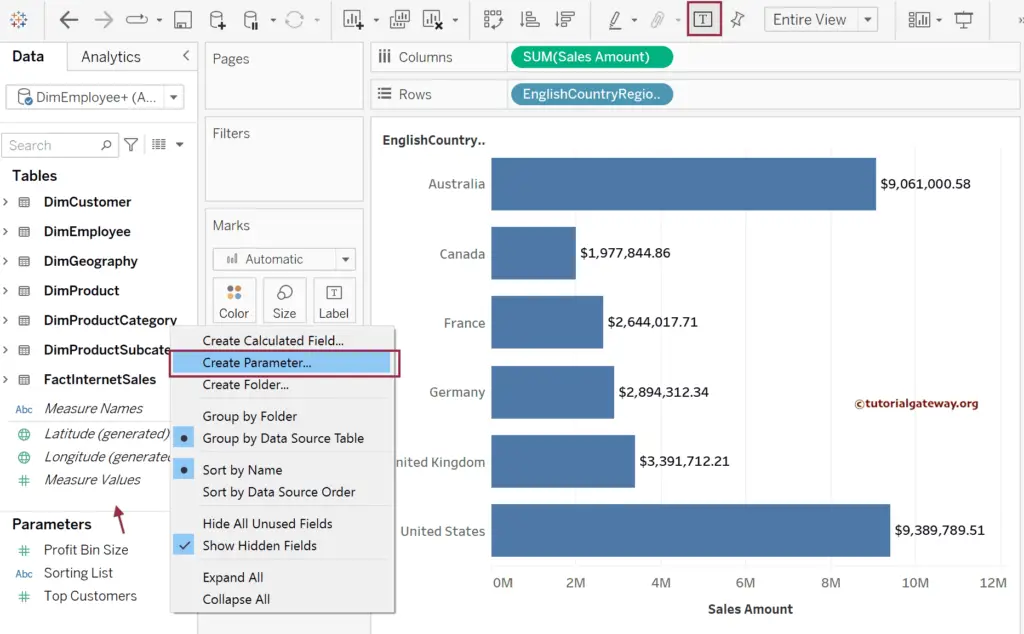
In this Tableau example, we must create a parameter and use it as the KPI. So, click the empty space below the Measure Values and choose the Create Parameter option from the context menu.
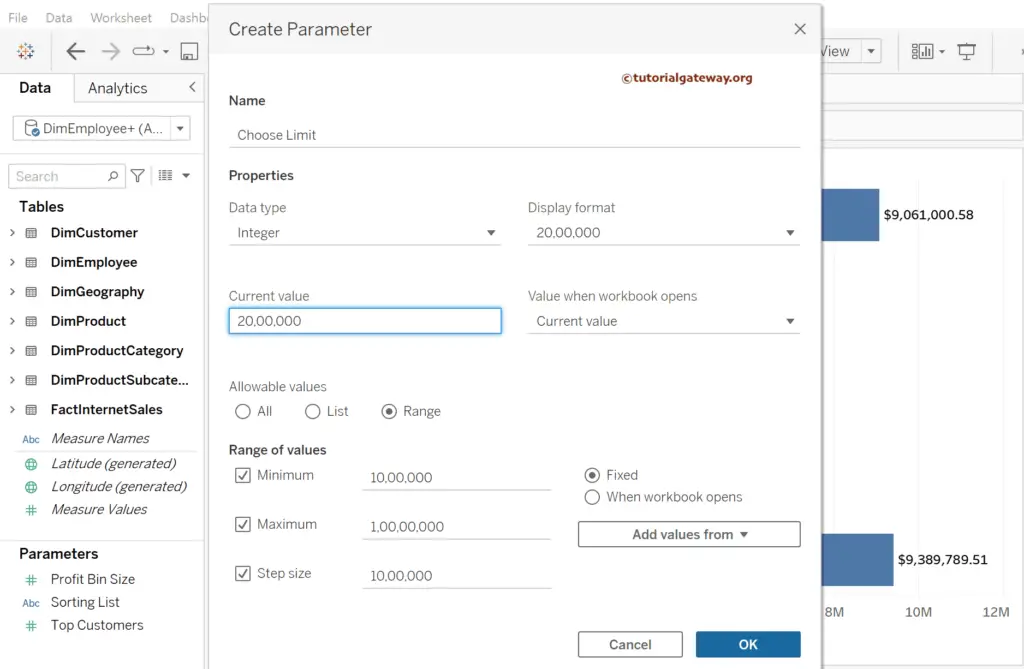
Please use this window to configure the KPI values. First, change the Data type to integer and set the Allowable values to Range. Next, set the Minimum, Maximum, and Step sizes. For the demonstration purpose, let me set the values as follows:
- Minimum = 10,00,000
- Maximum = 1,00,00,000
- Step size = 10,00,000
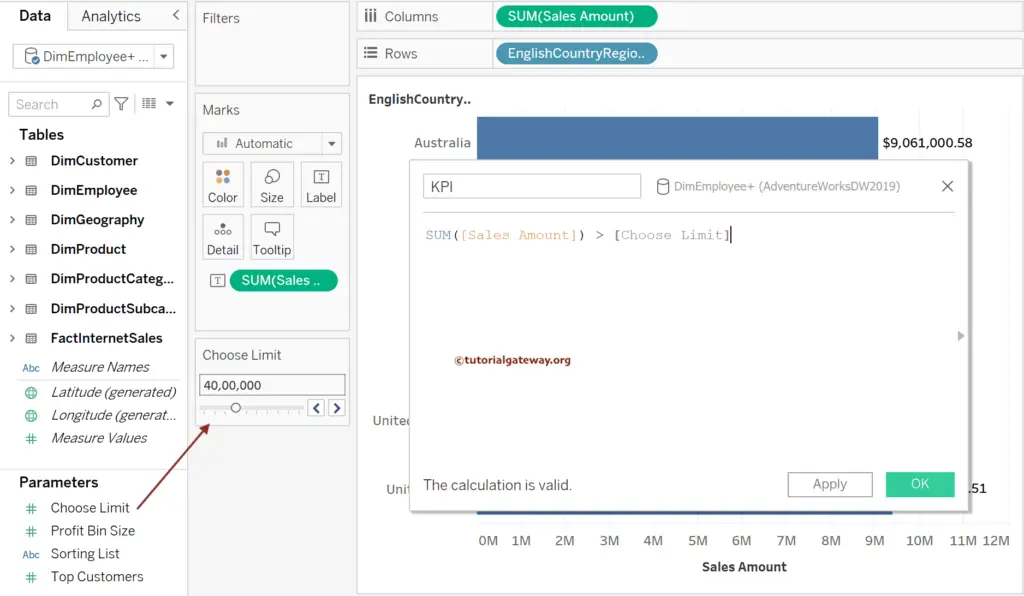
Right-click on the newly created parameter, i.e., Choose Limit. Next, select the Show Parameter option to set the Tableau report KPI limit. However, we need a calculated field to utilize the parameter within the report. So, go to the Analysis Menu and select the Create Calculated Field.. option to write the below expression.
The following expression checks whether the Sum of the Sales Amount is greater than the parameter value and returns a boolean True or False.
SUM([Sales Amount]) > [Choose Limit]
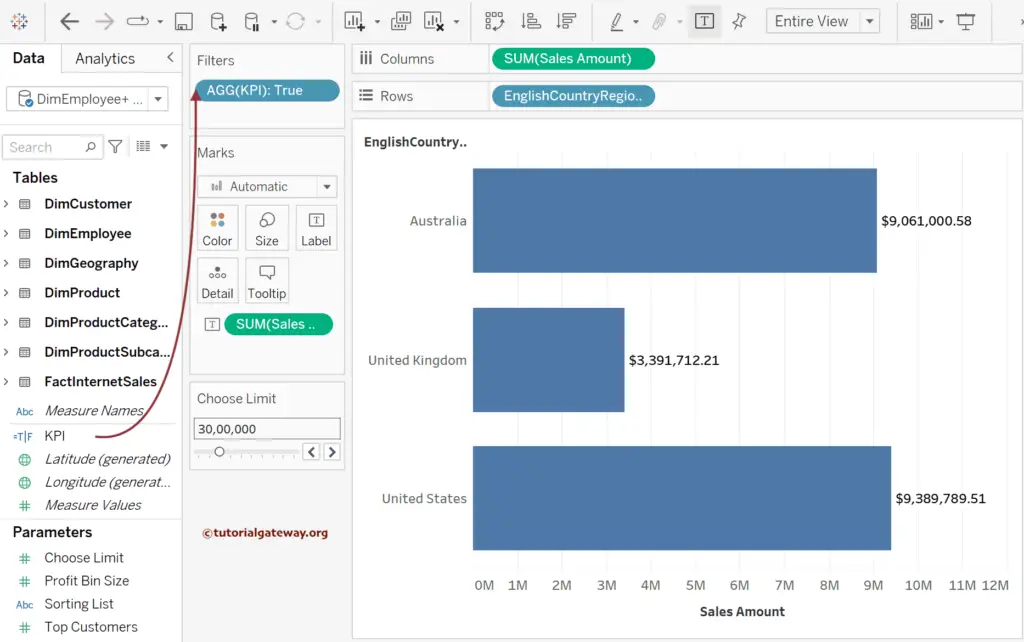
Please add the Tableau KPI calculated field with the parameter to the Filters shelf because we want to display the countries whose sales meet the key performance indicators mark. A pop-up window will open when you add this calculated field to the Filters shelf because it is Boolean Expression. Within the window, you have to checkmark either True or False. Let me select the True.
From the screenshot below, the bar chart displays three countries because their sales are above 30,00,000.
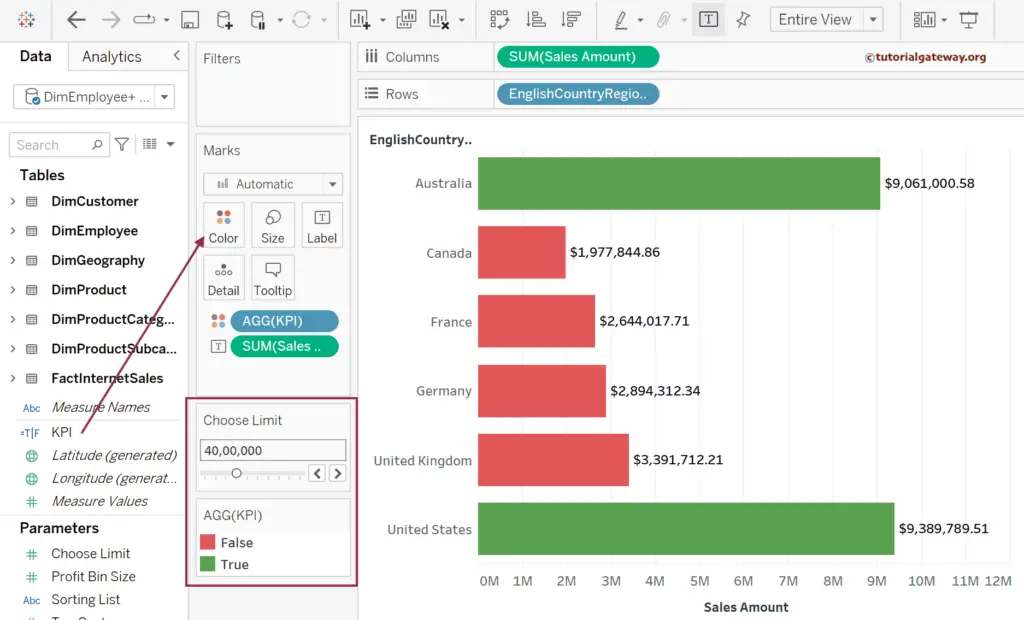
Filtering the non-performing items from the report may be a bad idea in some cases. In that case, we can use them as the color indicator. To do so, remove the KPI from the Filters shelf and add it to the Color Shelf.
If you observe the bar chart, greens are performing well, and there should be a sense of opportunity in red countries.
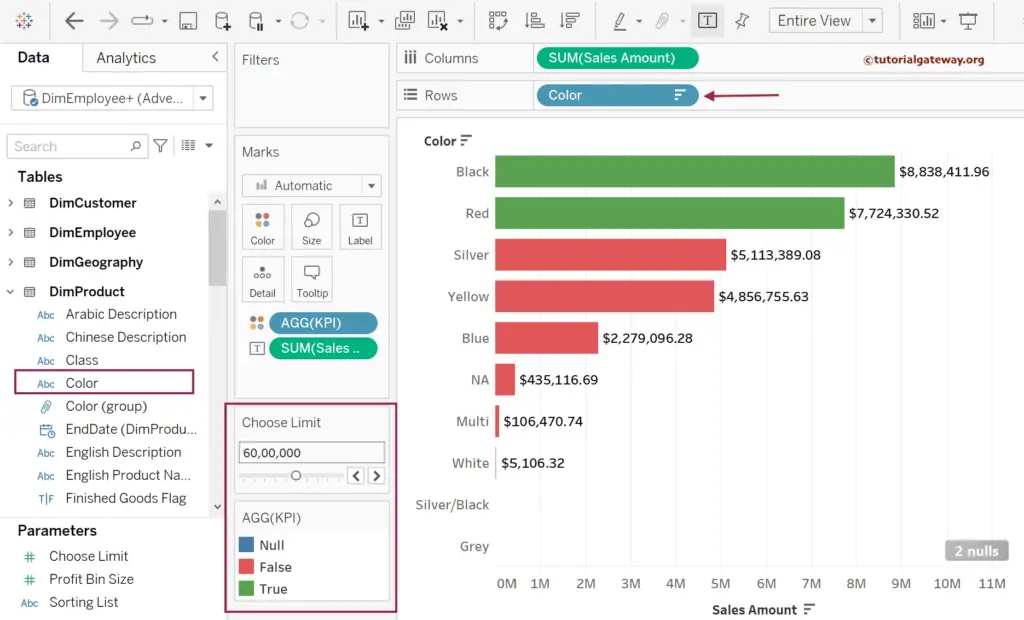
Similarly, suppose you replace the English Country Region Name with the product color dimension. In that case, you can use the KPI for product colors.
