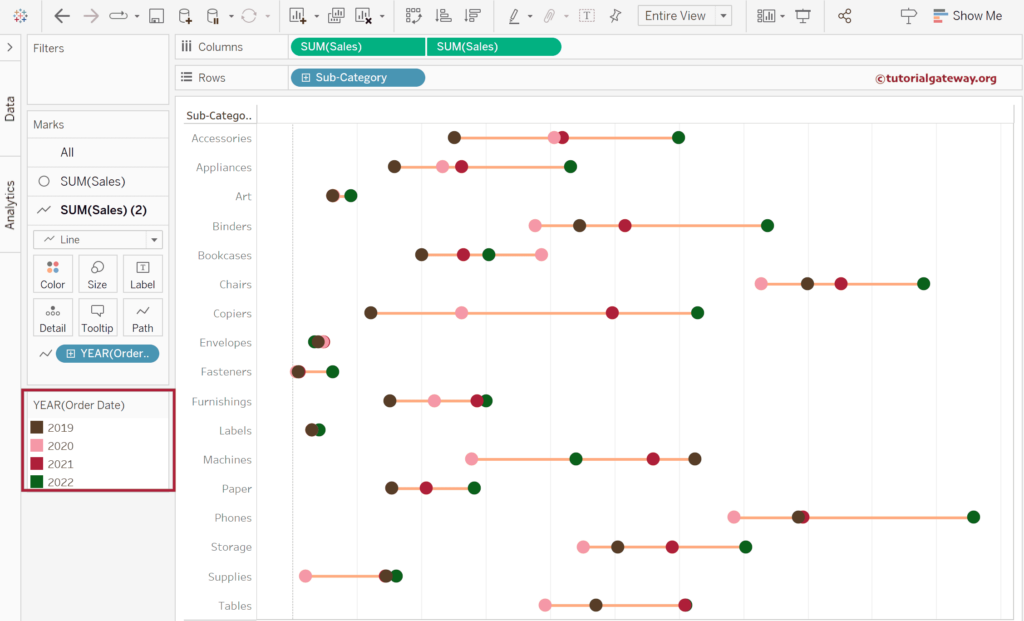
Tableau Dot Plot represents the individual data points in the graph where each dot represents the value. It is beneficial to show the multiple data points for each category to analyze the range or change. This article shows how to create a Dot Plot and format the colors, size, etc.
We used the Sample Superstore Excel source to demonstrate the Tableau Dot Plot. Please visit the Excel Source article to understand the Tableau Data Source.
Create a Dot Plot in Tableau
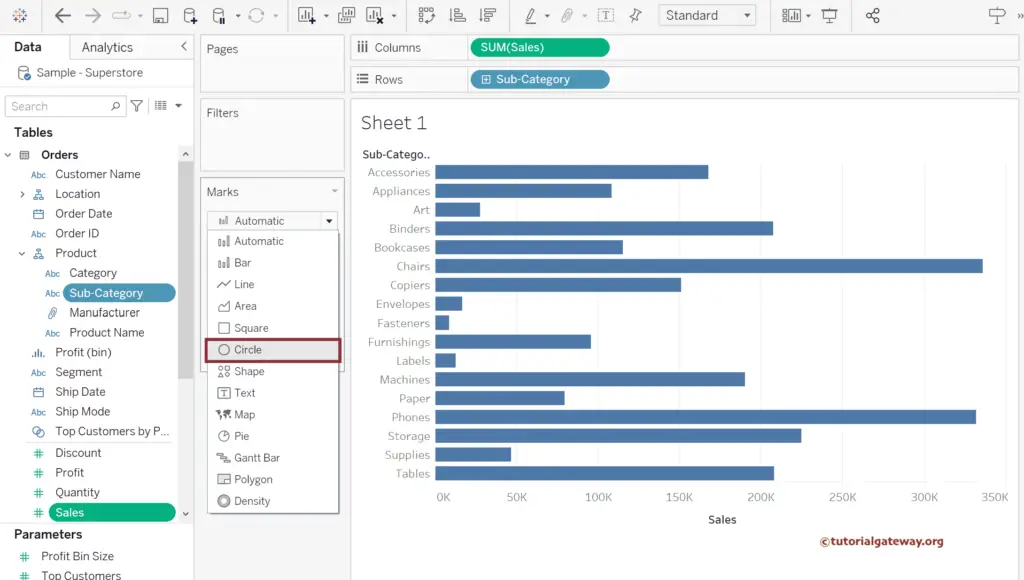
We need one Measure and dimension to create a Dot plot or chart. So, Drag and drop the Sales Measure to the Columns shelf and the Sub-Category dimension to the Rows Shelf. By default, Tableau has created a Bar Chart for you. So, please change the Marks from the default Automatic option to Circle.
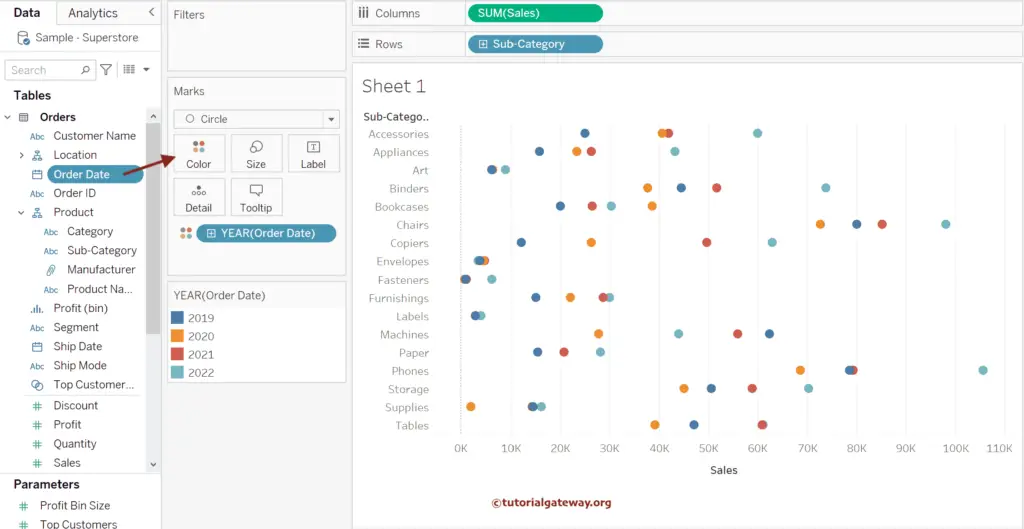
Instead of bars, Tableau will generate or plot simple circles or dots at the endpoint of each sub-category. Let me divide the Sales further by adding the Order Date to the Color Shelf. As there are four years in the Dataset, it shows four dots for each sub-category, and each color represents the respective Year.
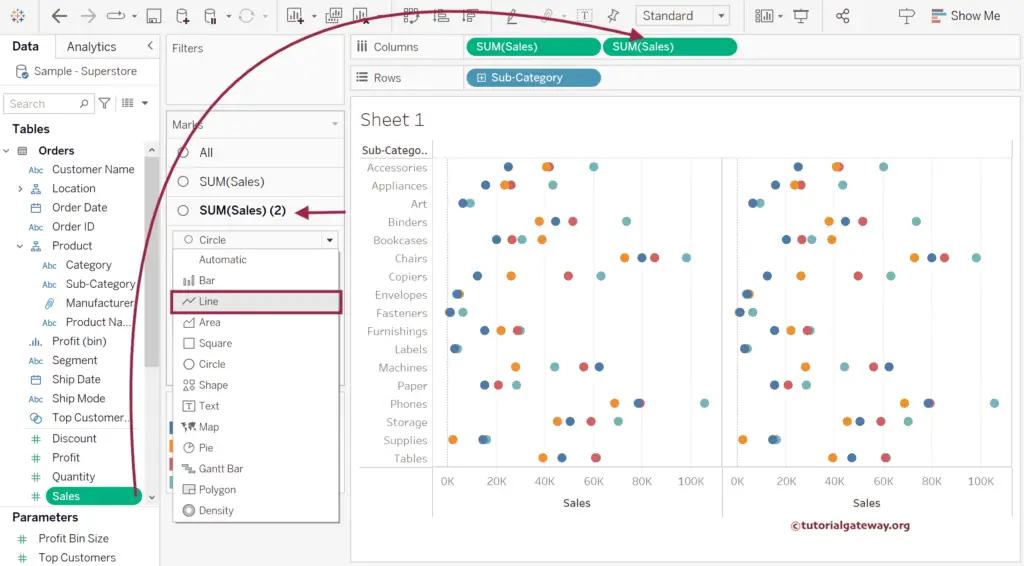
Drag the Sales Measure to the Columns shelf again to create a Dual Axis chart. Next, change the Marks type of the second axis (SUM(Sales)(2)) to Line. For more charts, Click Here.
As we must match the dots with the lines to create a Tableau dot plot, let me add the Order date to the SUM(Sales)(2) Path. By default, it will select and return the YEAR part of the date. However, in real-time, you can change as per the requirement.
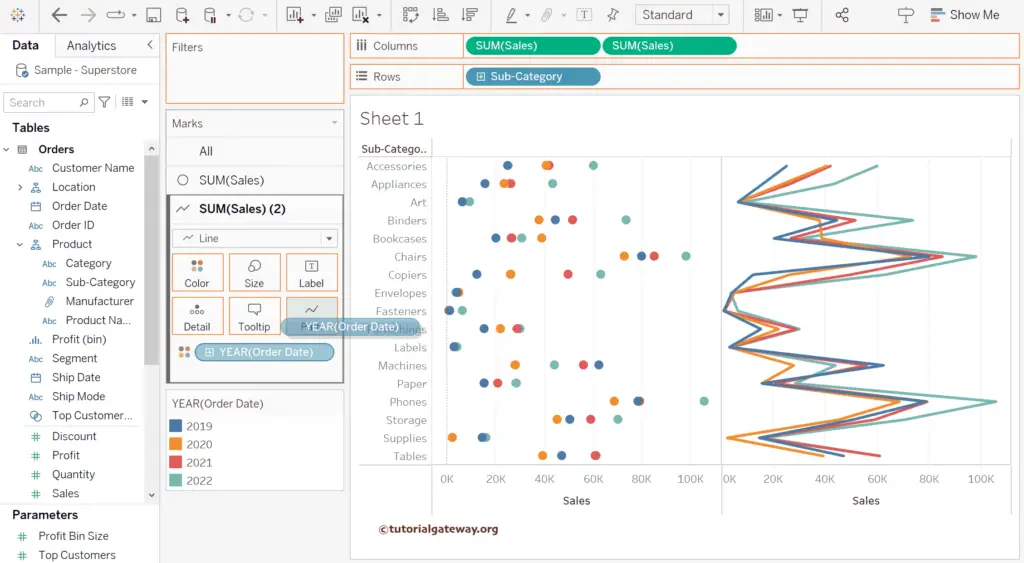
Please select and click the down arrow beside the second Measure and choose the Dual Axis option to generate the Dual Axis report.
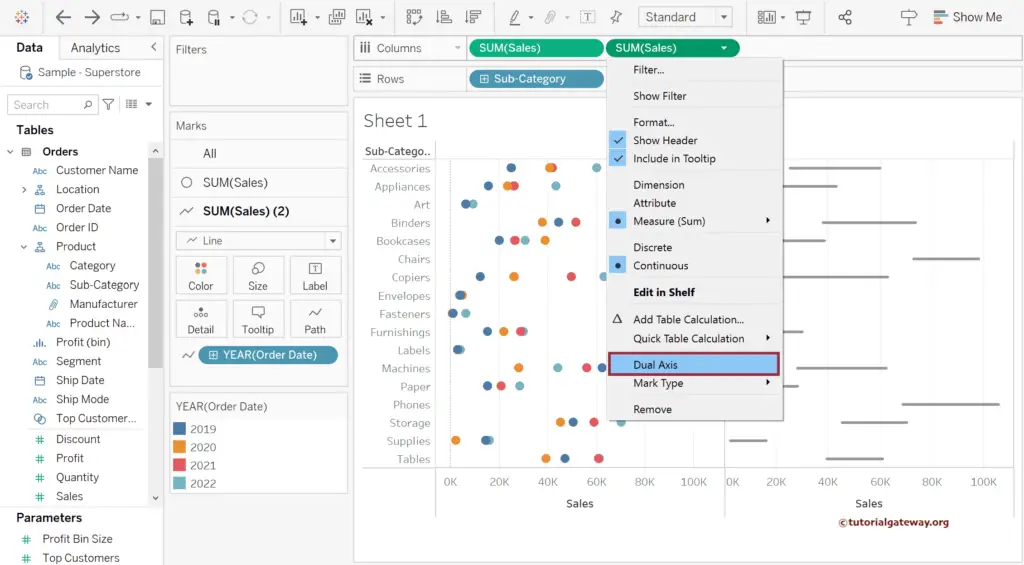
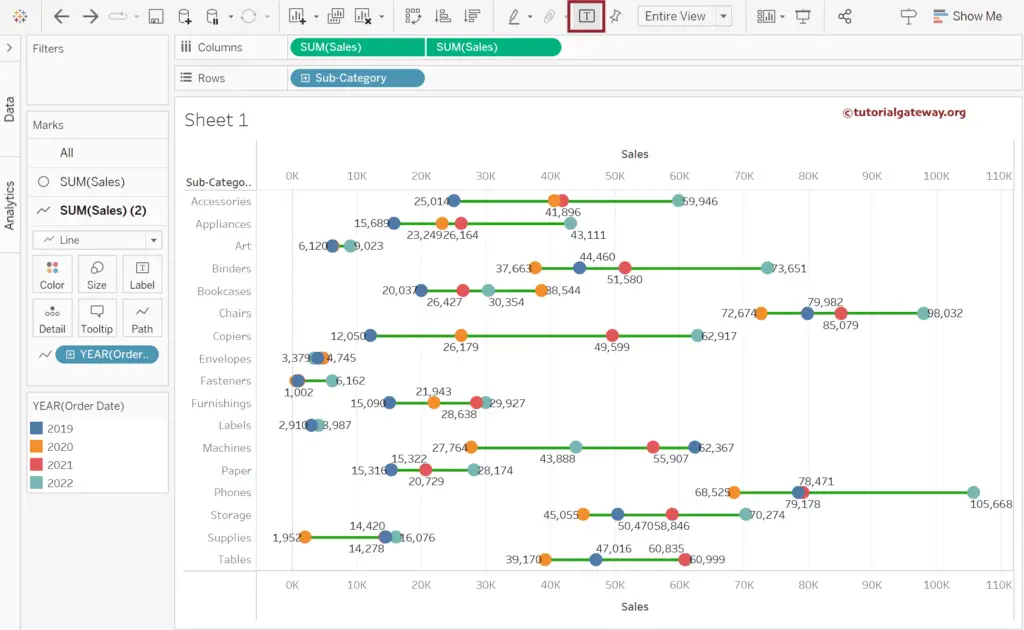
Now, you can see the Tableau Dot plot. Let me Synchronize the Axis by selecting any X-axis and choosing the below-shown option.
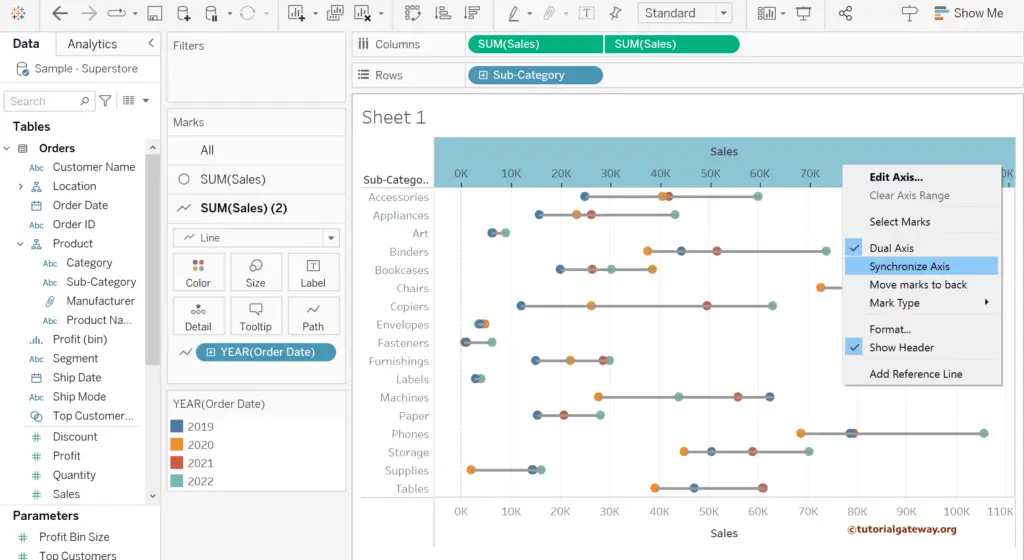
Formatting the Dot Plot
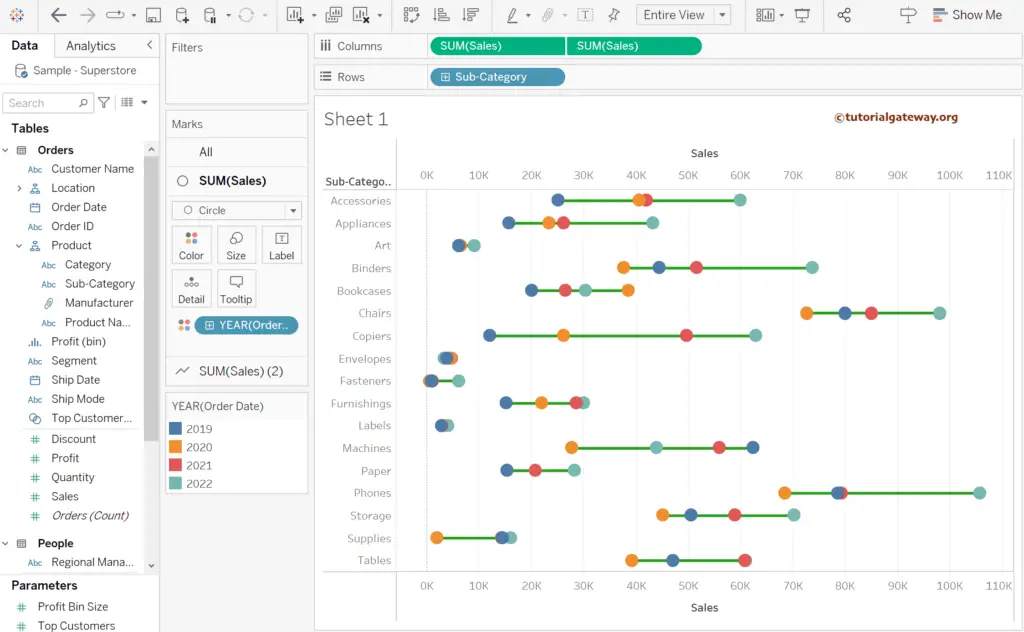
Let me increase the size of the dots using the Size shelf.
How do you add Data Labels to Tableau Dot Plot?
Please click the below-marked T button in the toolbar to show data labels. Otherwise, add Sales to the SUM(Sales) Labels shelf.
How to Change Dot Plot Colors?
As we have added the Year(Order date) as the Color option, you can click the individual Year from the marked section to change them. Otherwise, Click the Colors shelf and choose the Edit Colors option to change the complete Palette.
Now, you can see the colorful Tableau Dot plot.
