This Tableau article explains how to use dimensions as Parameter values (text) to filter or change reports with an example. Instead of using text to alter the report, we can completely change the dimensions in the ehRow or Columns shelf.
To demonstrate the Tableau Dimensions as a parameter to filter reports, we used the AdventureWorksDW database. Please visit the SQL Source and SQL Tutorial article to understand the Data Source.
To fulfill this requirement, we need a Tableau parameter to store the dimensions and a calculated field to call that parameter in the Rows shelf inside a report to filter.
Tableau Dimensions as a parameter to filter Bar Chart report
Drag and drop the Sales Amount Measure to the Columns shelf and the English Country Region Name dimension to the Rows Shelf. By default, it will create a Horizontal Bar Chart. If not, change the Marks type to Bar. Next, add the English Country Region Name to the Color shelf to add colors and click the T button in the toolbar to add the Data labels. For the remaining charts in Tableau, please visit the Tableau Charts article.
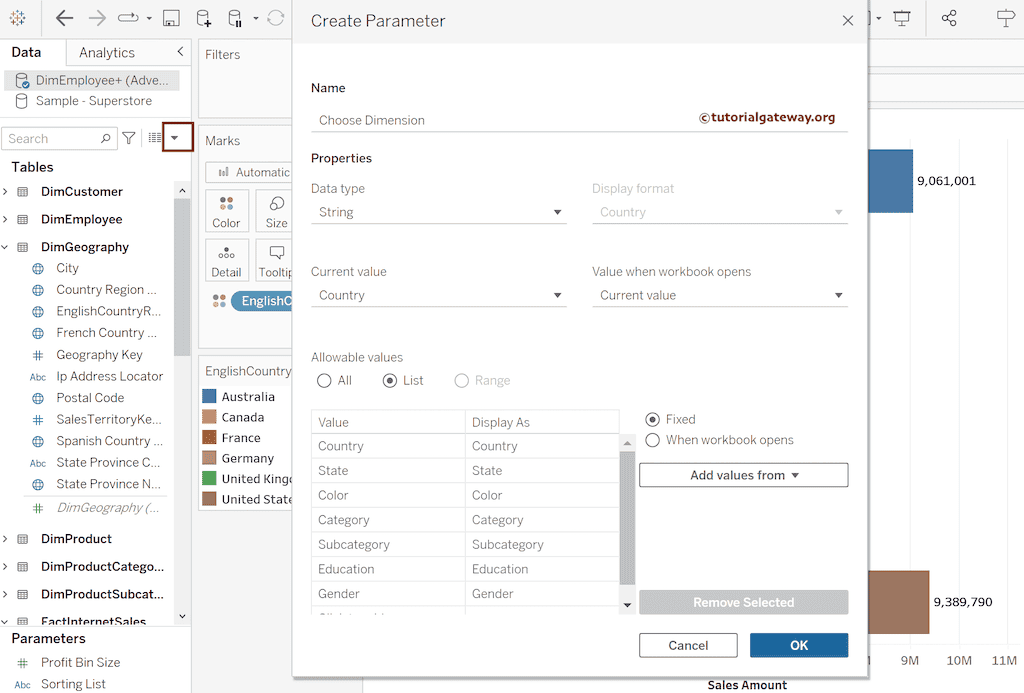
Next, we need a parameter to hold the required dimension names. So, click the down arrow (red marked) and choose the Create and Parameter option from the context menu to open the following window.
First, change the name to Choose Dimension, the Data type to String, and set the Allowable values to List Range. For the Tableau Parameter to Filter report demonstration purpose, let me add the Dimensions values as follows:
- Country
- State
- Color
- Category
- Subcategory
- Education
- Gender
All the above values are the string columns or dimensions from different tables joined by primary and foreign keys. In this Tableau Dimensions as a Parameter to Filter report example, our goal is that when the user selects any of the above values, the bar chart has to show the sales against that string column. For instance, Gender means the country name has to be replaced with gender and show the sales by gender (male and female).
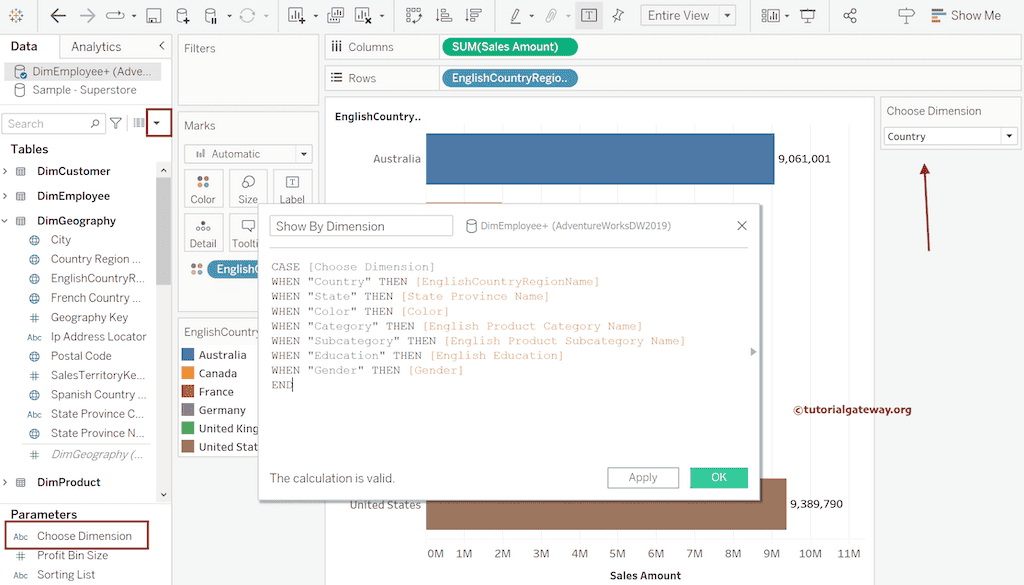
Right-click on the newly created Choose Dimension parameter, and select the Show Parameter option to see them. We need a calculated field to utilize this string parameter in the report. So, click the down arrow (red marked) and select the Create Calculated Field.. option to write the below expression.
The following Choose Dimension calculated field expression uses the CASE statement. It checks where the user selects the word Country, chooses the [EnglishCountryRegionName] column, and so on. Please be careful with the names; the text inside the double quotes has to match with parameter values, and the text after the THEN keyword should match with column names.
CASE [Choose Dimension]
WHEN "Country" THEN [EnglishCountryRegionName]
WHEN "State" THEN [State Province Name]
WHEN "Color" THEN [Color]
WHEN "Category" THEN [English Product Category Name]
WHEN "Subcategory" THEN [English Product Subcategory Name]
WHEN "Education" THEN [English Education]
WHEN "Gender" THEN [Gender]
END
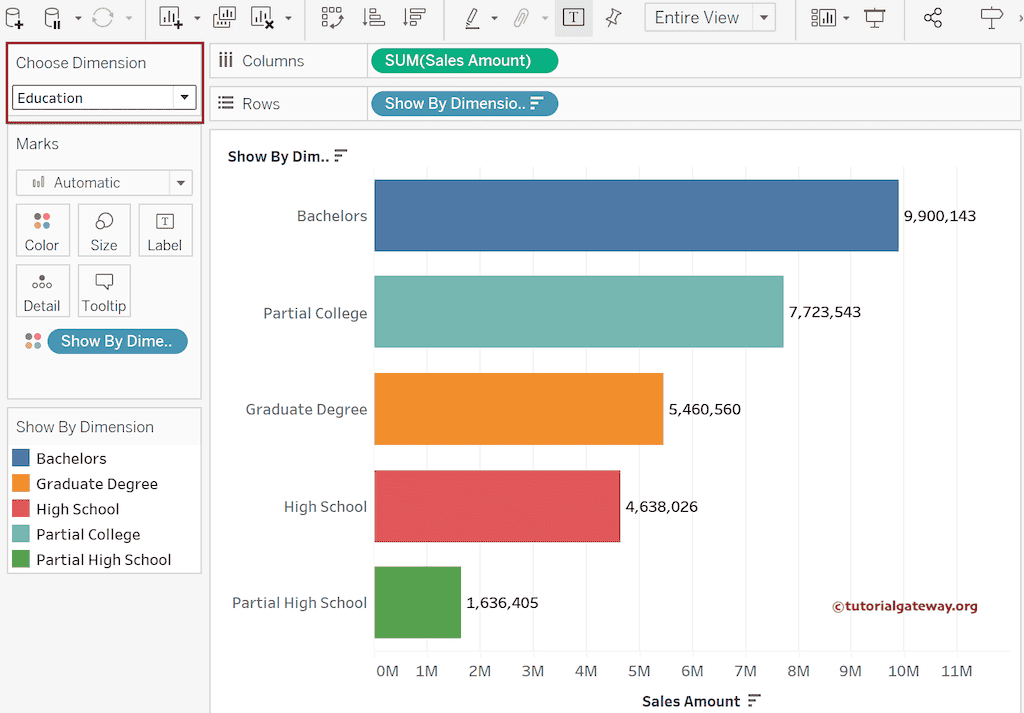
Please replace the EnglishCountryRegionName in the Row, and Color Shelf with the Choose Dimension calculated field. It shows the sales by country by default because it is the default parameter value. You can see the list of available Dimensions on the report’s right side of the Tableau report as the parameter values to filter.
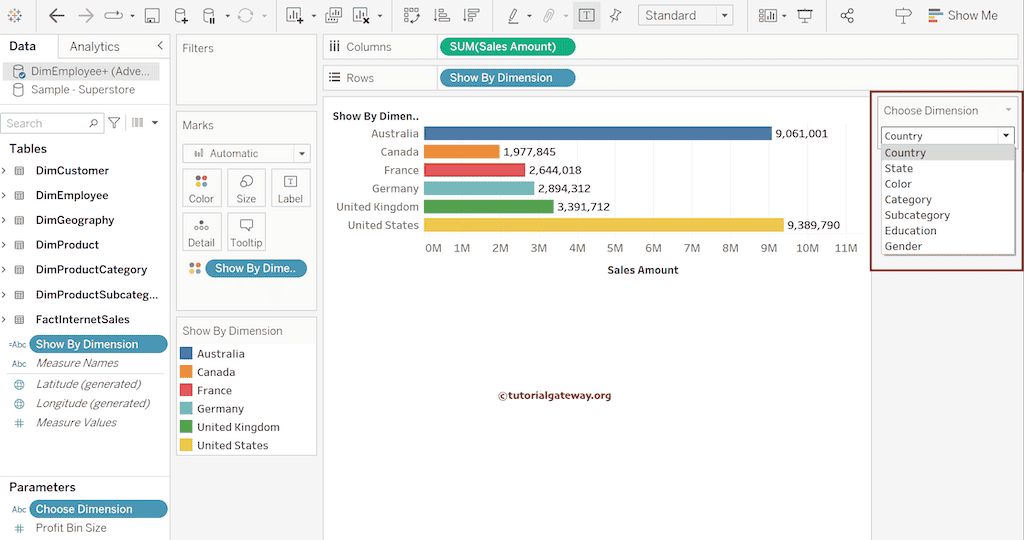
Let me choose the Color to see the sale by product color from the DimProduct table.

We will try one more dimension, i.e., Education, to see the sum of sales amount by education.