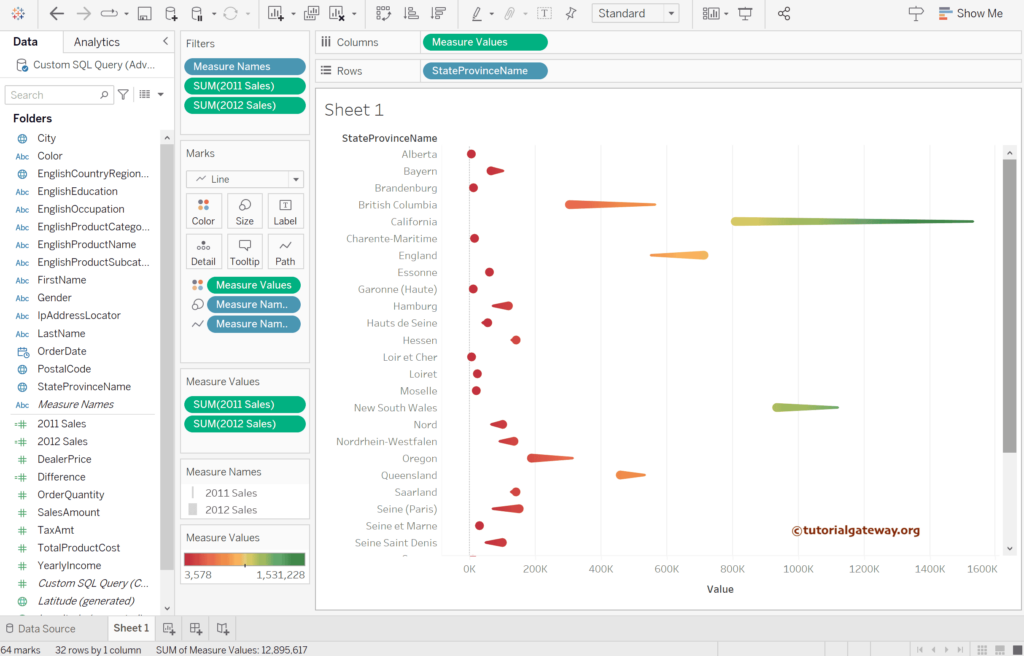
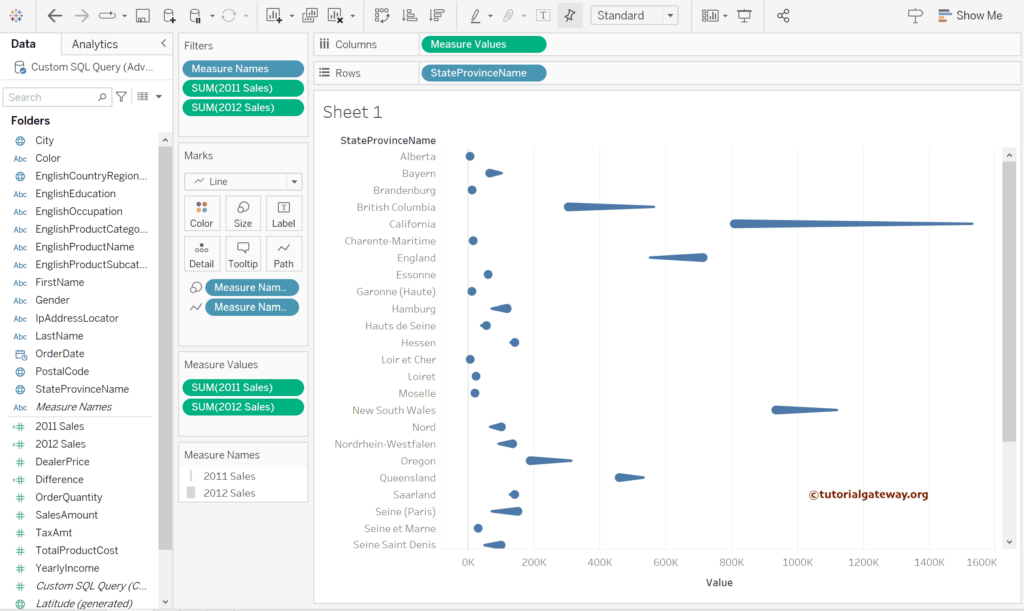
Tableau Comet chart looks similar to a bar chart with a direction where each dimension shows Sales change over two periods. This article shows how to create a Comet chart and the steps involved in formatting them.
To demonstrate the Tableau Comet chart, we used the AdventureWorks Database. Please visit the Data Labels in Reports article to understand the Tableau Data Source.
How to Create a Comet Chart in Tableau?
To Create a Comet chart, we need two Calculated Fields of continuous years. So, click the Down arrow beside the Sales Amount Measure, select Create, and then select the Calculated Field… option.
First, let me create a calculated field of Sales for 2011. For this, we used a simple If statement, which filters the Sales Amount for the Year 2011. And the code we used inside it is as shown below.
IF YEAR([OrderDate]) = 2011 THEN [SalesAmount] END
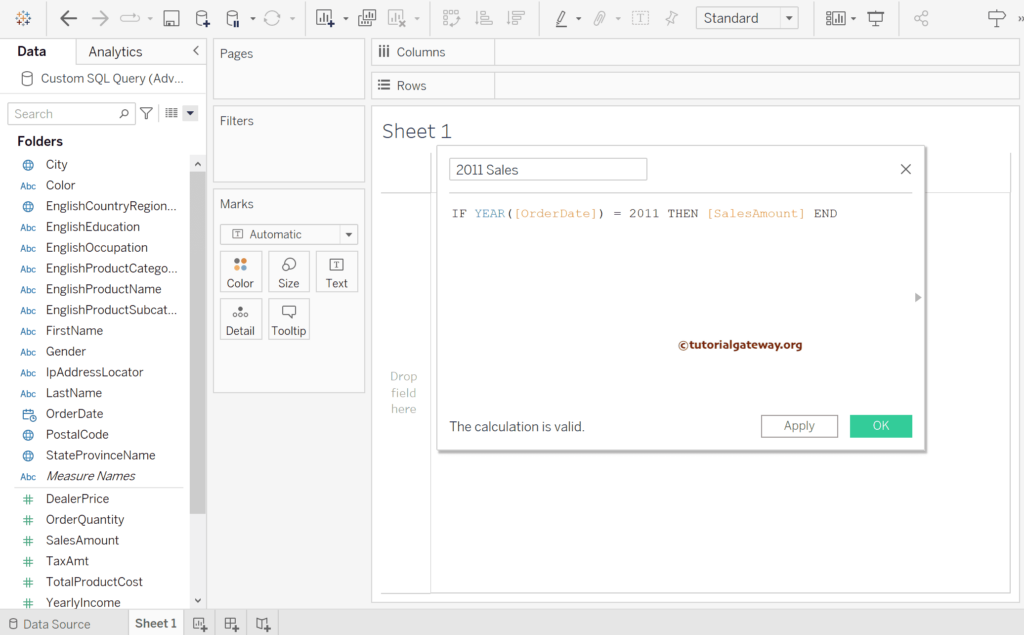
Similarly, create one more calculated field for the 2012 Sales Amount.
IF YEAR([OrderDate]) = 2012 THEN [SalesAmount] END
Apart from the above two, let me create one more field to find the difference between the sales of 2011 and 2012. It helps to add colors to the Tableau comet chart. In the below code, we used the SIGN() function to display the positive or negative sign before the result.
SIGN(SUM([2012 Sales]) - SUM([2011 Sales]))
Drag and drop the Sum of 2012 Sales to the Column Shelf and State the Province Name to the Rows Shelf. As there are few null values within the chart, we filtered that data using the Filters shelf. You can see, by default, it has created a Bar Chart for you. For more charts >> Click Here.
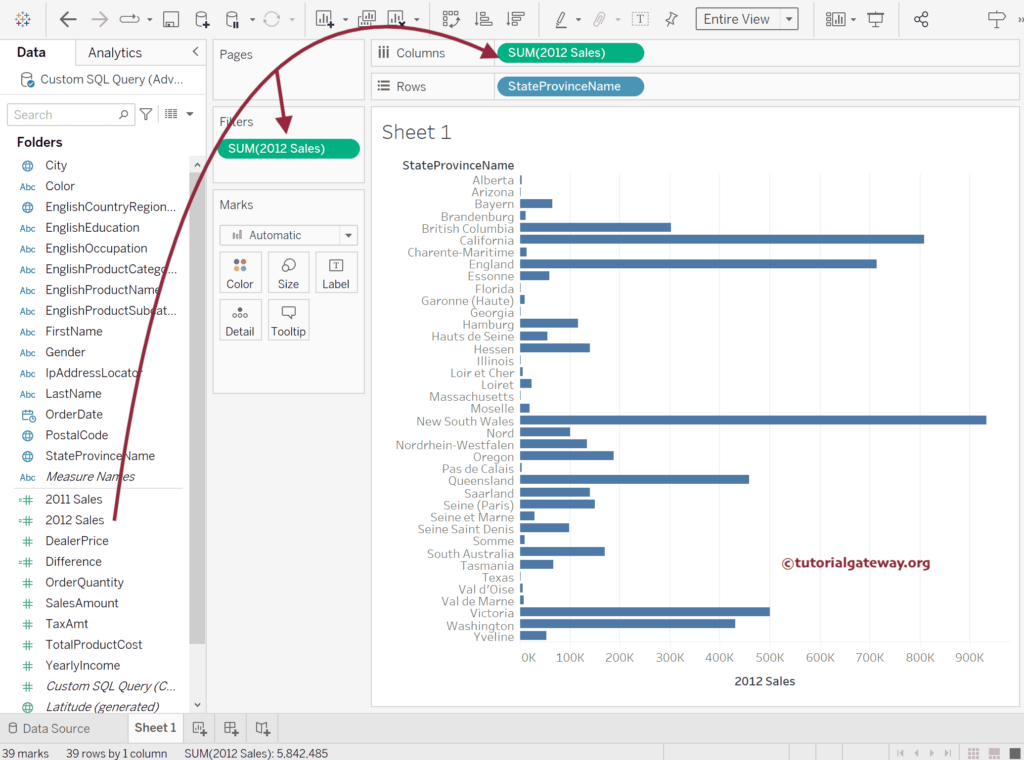
Drag and drop the Sum of 2012 Sales to the Horizontal X-axis on top of the 2012 Sales because we need the latest two measures to see the change between them for each state.
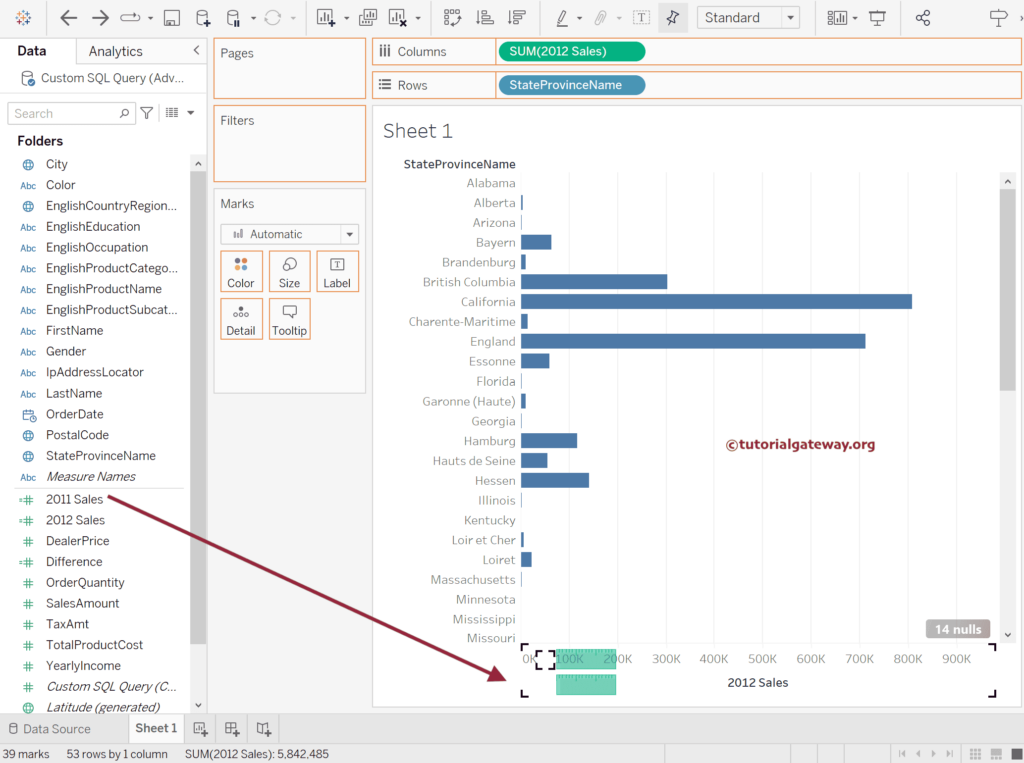
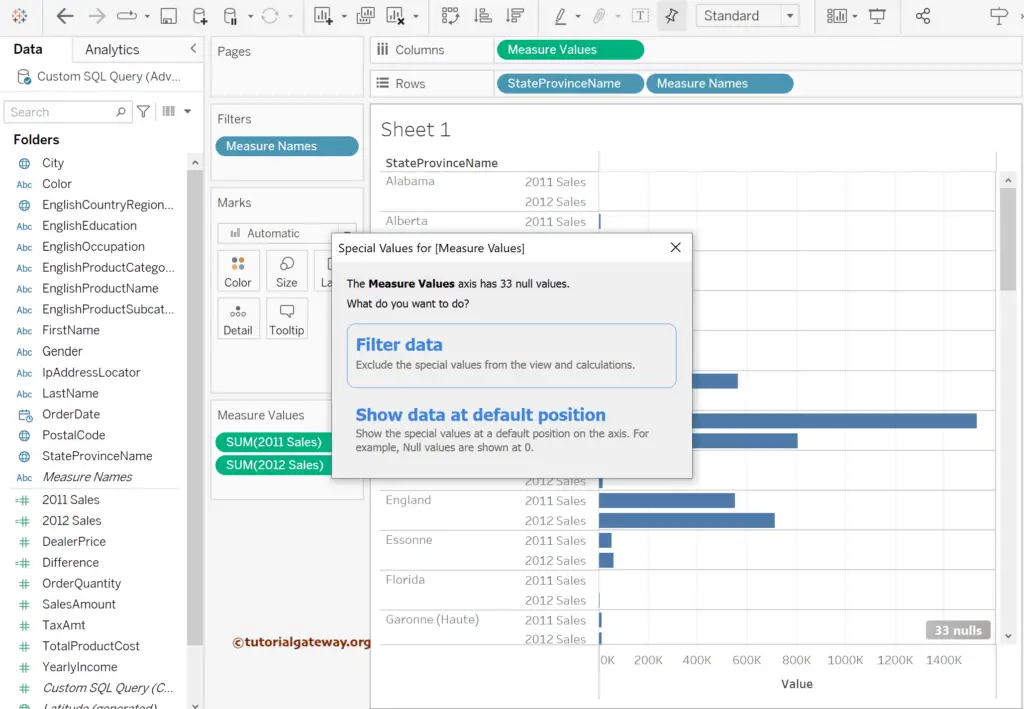
As some states have Null values (No Sales Data), the following Special Values for [Measure Values] pop-up window will open. We don’t need any nulls in our Tableau Comet Chart, so Please select the Filter Data option to remove all Null values. Next, please change the Marks field from Automatic to Line.
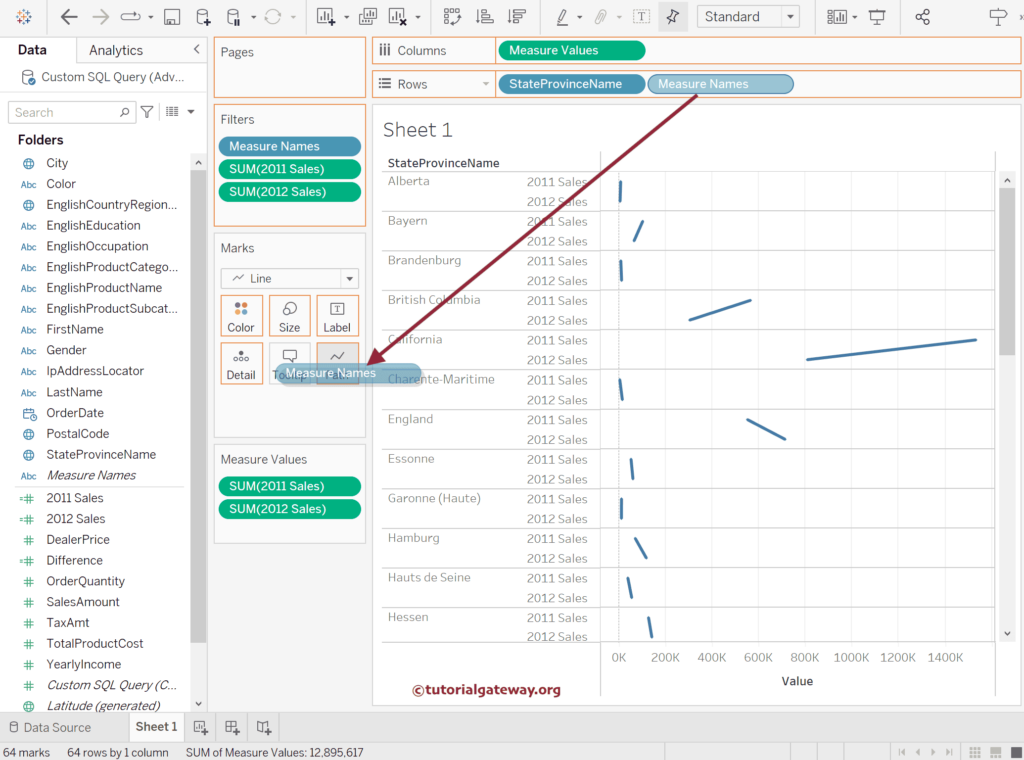
It will create a Dual combination Line chart. Please drag the Measure Names from the Rows Shelf to the Path Shelf instead of showing the 2011 and 2022 sales vertical Lines, and it shows the horizontal lines. Next, use Control and add the Measure Names to the Size shelf to change the line size as per the Sales.
The screenshot below shows you the Tableau Comet Chart that displays the Sales over time.
Add Colors to Tableau Comet Chart
Drag and drop the Difference calculated field from the Measures to the Color Shelf. It shows the brown color for the Negative sales and the Blue color for positive.
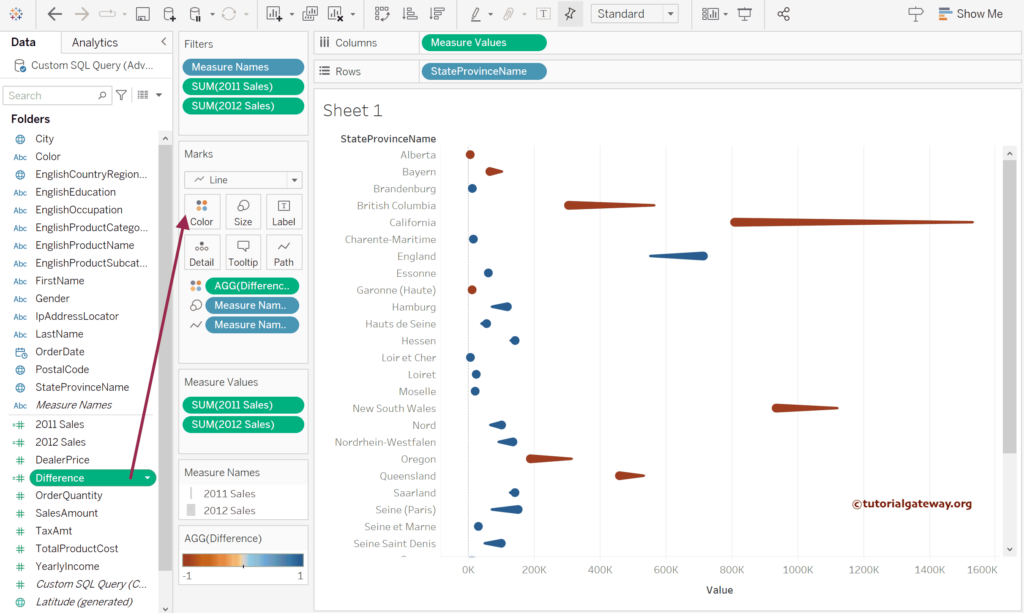
Click the Colors shelf and choose the Edit Colors option to change the Palette. Here, we have chosen the Red-Green-Gold Diverging.
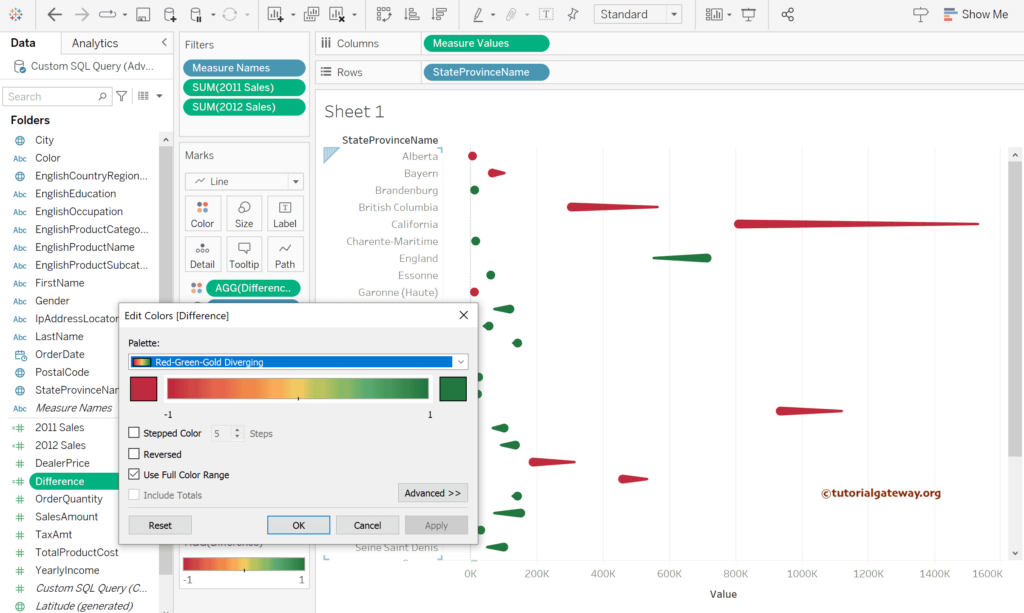
Now, you can see the colorful comet chart in Tableau.
