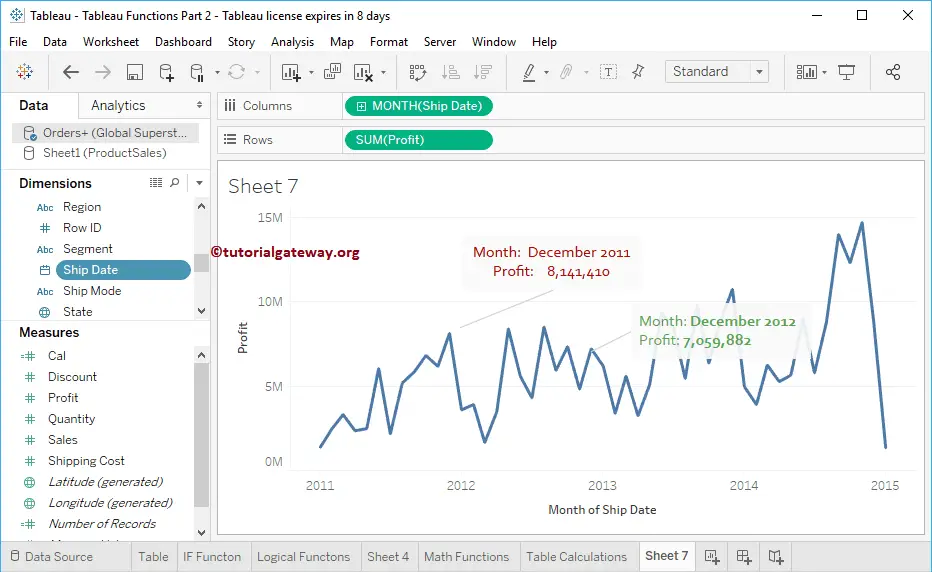
In this article, we will show you how to add, edit, and delete Tableau Annotations with practical examples. There are three types of annotations: Mark, Point, and Area. To demonstrate the Annotations, we will use the Global Superstore Excel file. For this Annotations example, we created an Area Chart by dragging Profit to the Rows Shelf and Ship date Month to the Columns Shelf.
In general, when you hover over any point in the Area Chart, it will show you the tooltip information. However, you can add Tableau annotations describing that point, showing values, etc. For example, adding comments to explain a particular area, or highlight a point inside a chart or dashboard to explain the sales at that point, etc. Please refer to the Connecting to the Excel Files article to understand the connection settings.
Add Tableau Annotations
A key advantage of adding annotations inside a chart or dashboard helps end users understand why there are sudden spike/low points in sales.
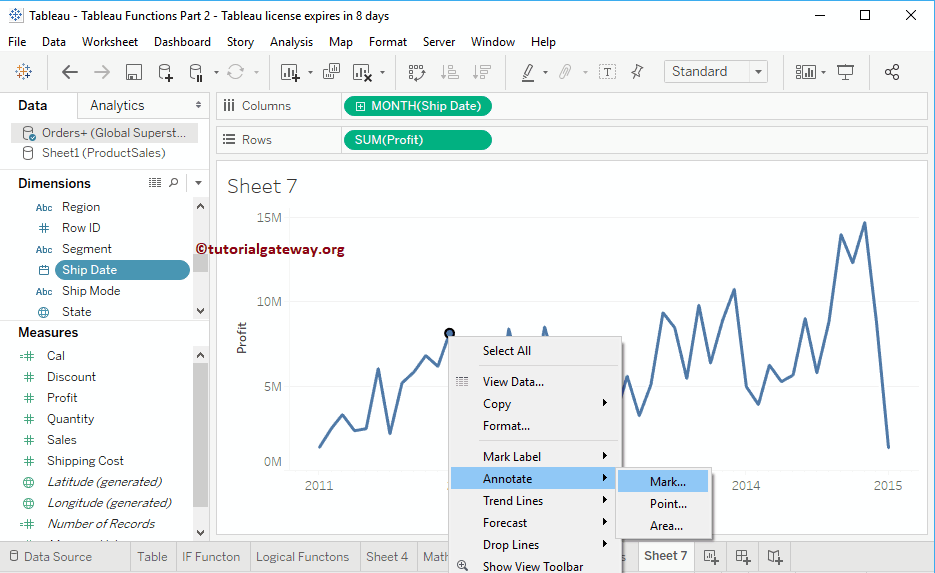
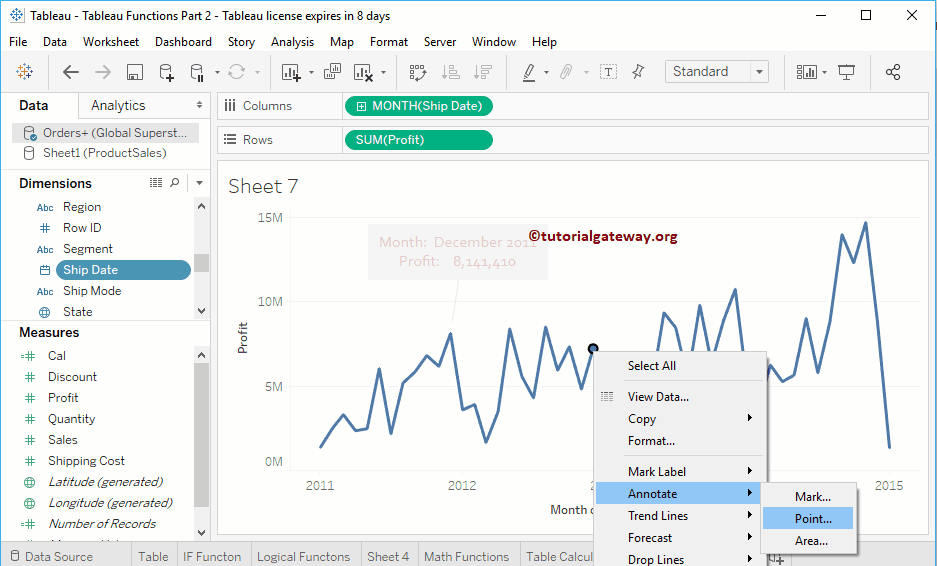
To add, right-click on the point or Mark in the Tableau chart to open the context menu. Please select Annotate and select any of those three options. For now, let me choose Marks.
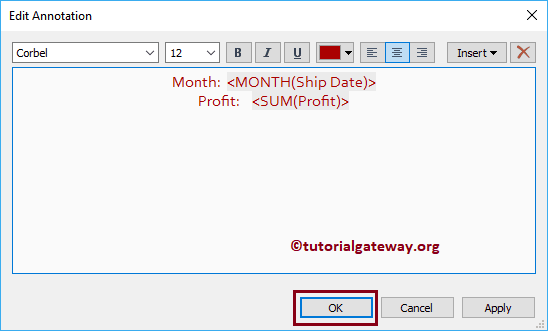
Selecting the Marks option will show you the following window. By default, it will display the information at that mark. Let me change the Font style to Corbel, the Font size to 12, and the font color to Red.
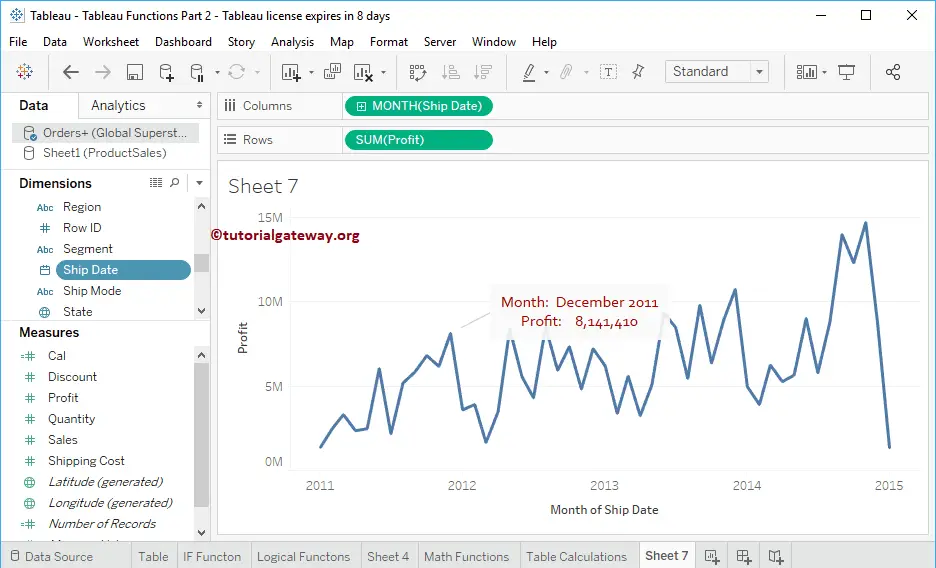
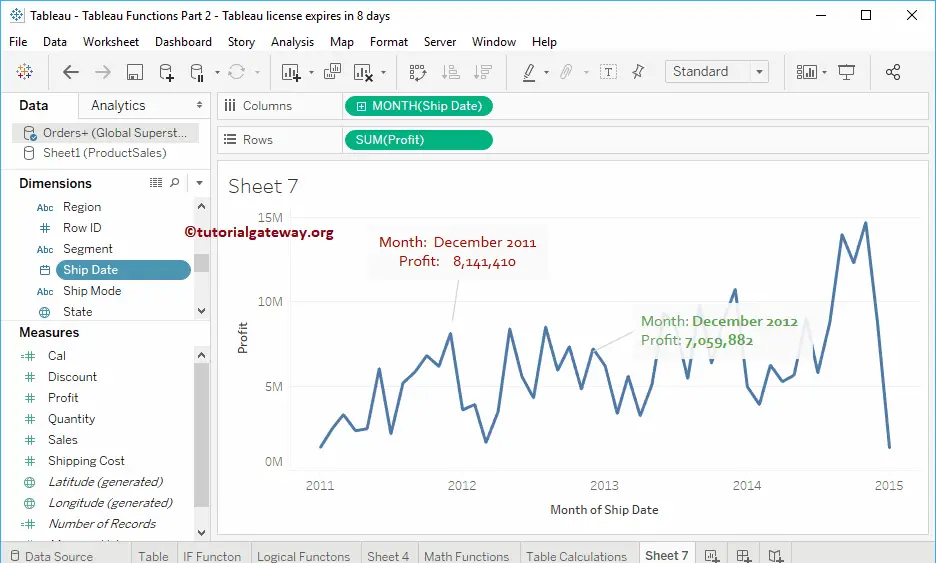
Now, you can see the Tableau Annotations or tooltip at the selected Mark
This time, we are choosing the point.
It will display the annotation at a selected point.
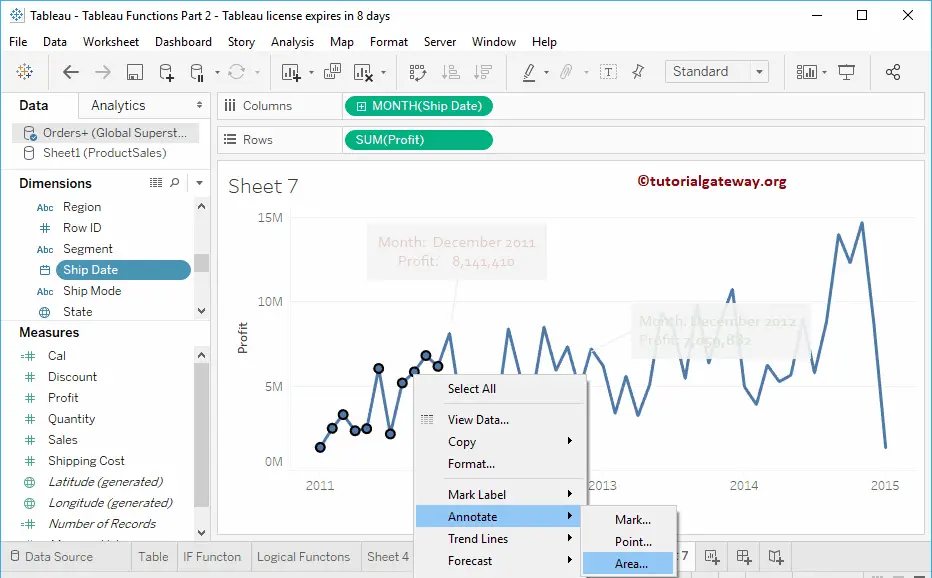
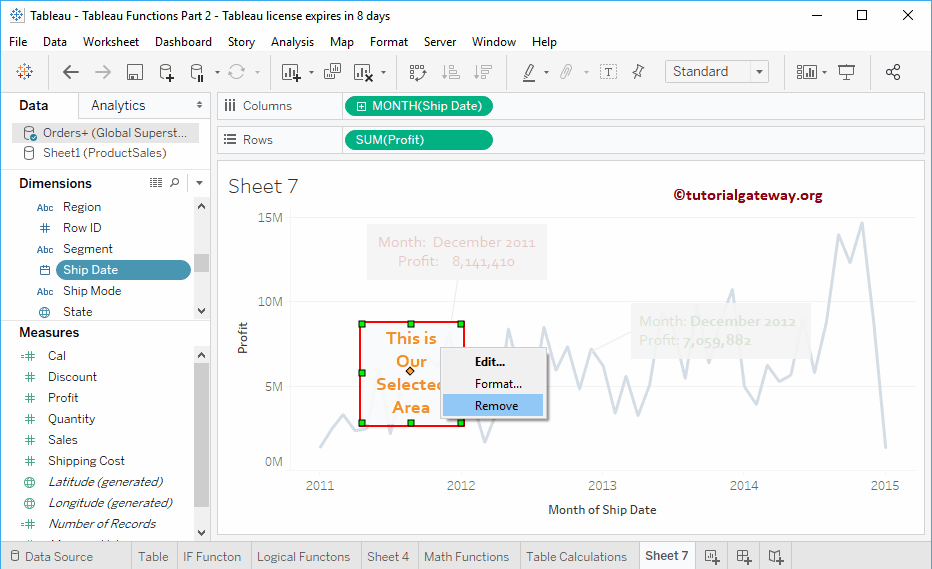
Here, we picked a random area and chose the Area annotation. Remember, this is very useful for disclosing information about that area
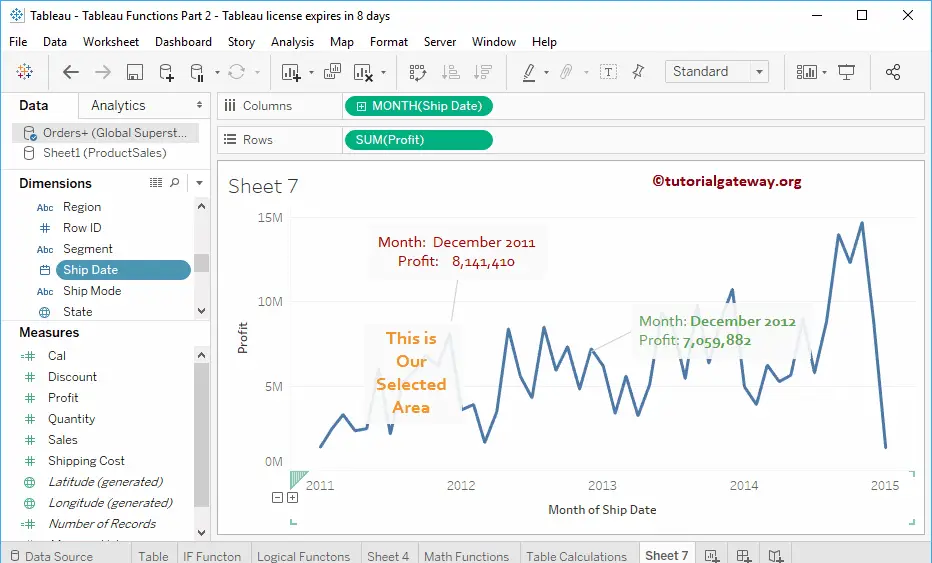
We are using some sample text: “This is Our Selected Area”, Font = Corbel -14 Bold, and Orange Color. Now, you can see the area label.
Remove Tableau Annotations
Right-click on the message you want to remove and select the remove option from the context menu.
Edit Annotations
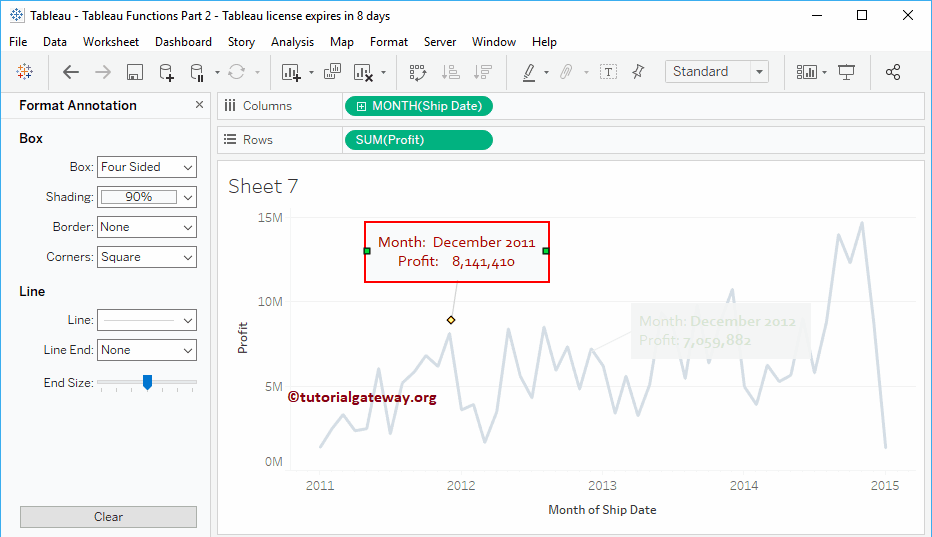
To edit the Annotations, right-click on them and select the Edit.. option from the context menu, as shown in the above image. As we removed one before, let me choose the Month and Profit that we created at the beginning.
Use the above-shown Edit window to change the text and format. By selecting the Format option, you can format the look. So, let me choose the Format option. You can see the Formatting window. Use this window to format this annotation.
Using your mouse, you can change its location. Let me drag it to the right side. You can see the change in position.