In this session, we show you how to get quick insights in Power BI with a practical example. Generally, there are two types of insights. One runs on the entire dataset, and the other is to run insights on one particular report (quick insights). Later one allows you to drill down the insights further, too.
For this Power BI Quick Insights demonstration, we are going to use the Sixth dashboard. To view this, please click on My Workspace and then go to the Dashboard to Select Sixth Dashboard.
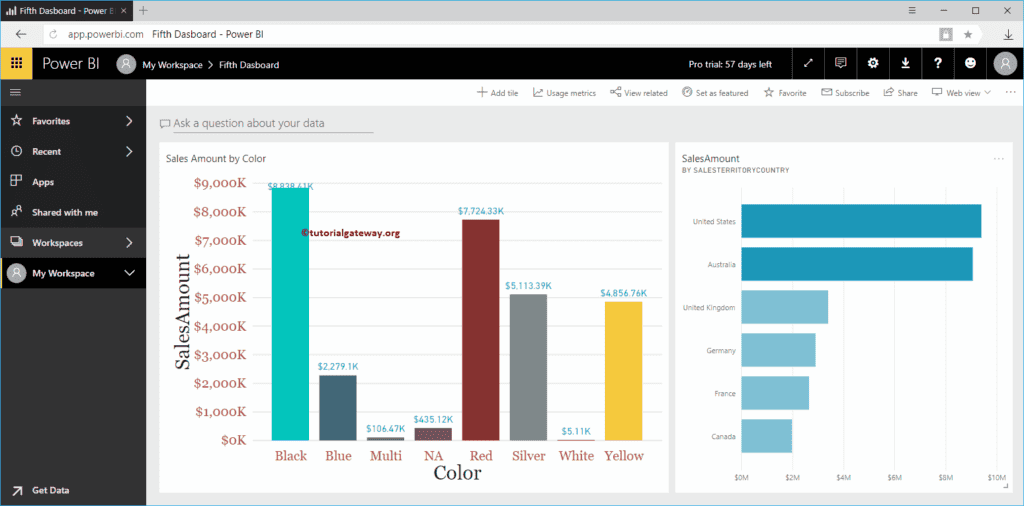
I suggest you refer to the Get Insights section to understand the process of running Power BI algorithms on your dataset (first one). As you can see from the screenshot below, Workspace has only one Pie Chart.
Power BI Quick insights
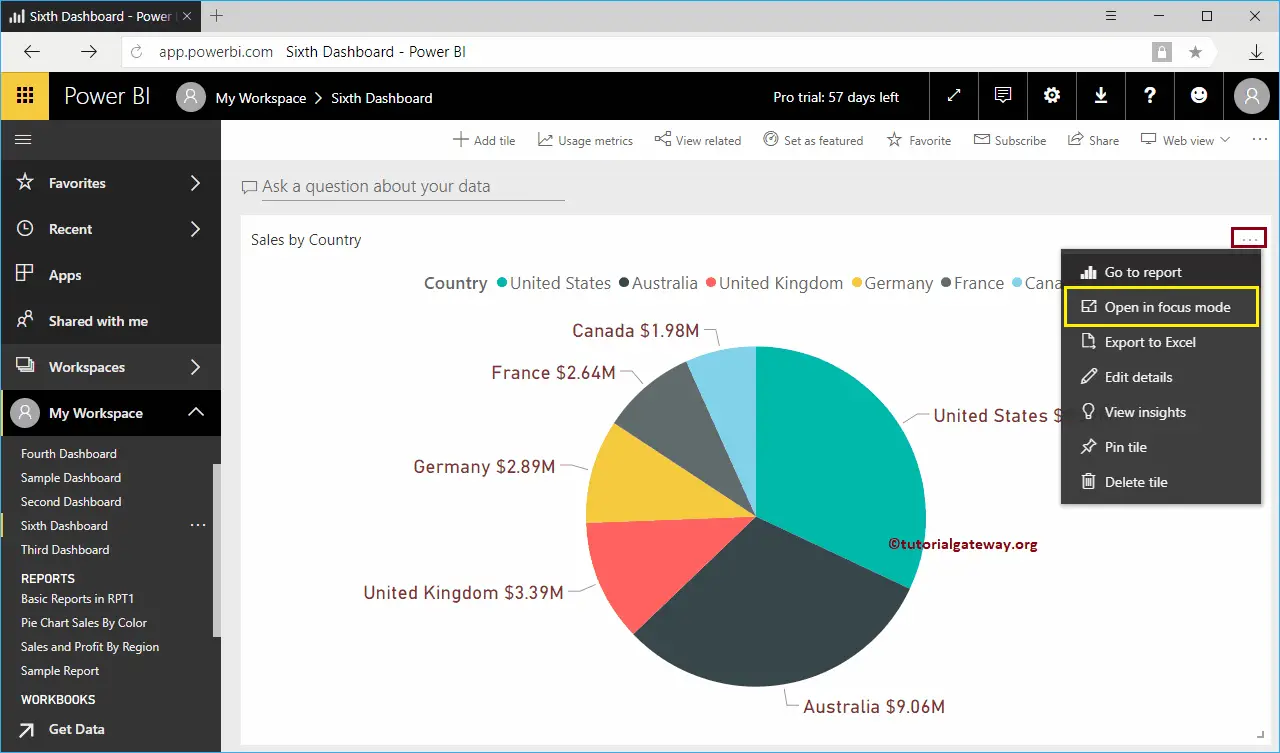
To get the Quick Insights of a report, click … on the top right corner and select Open in Focus Mode. Remember, in some versions of My Workspace, there is a button beside that … to enter into focus mode.
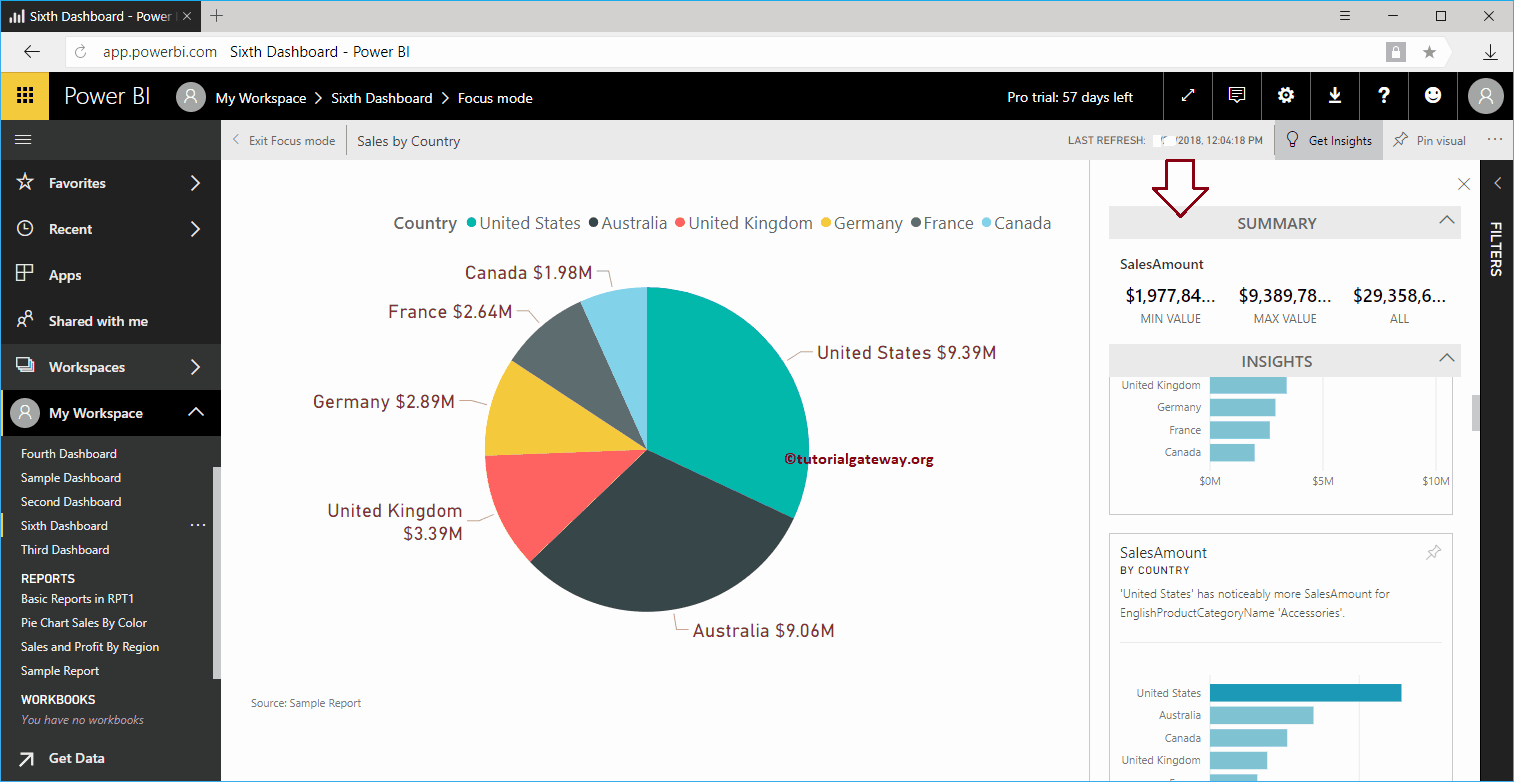
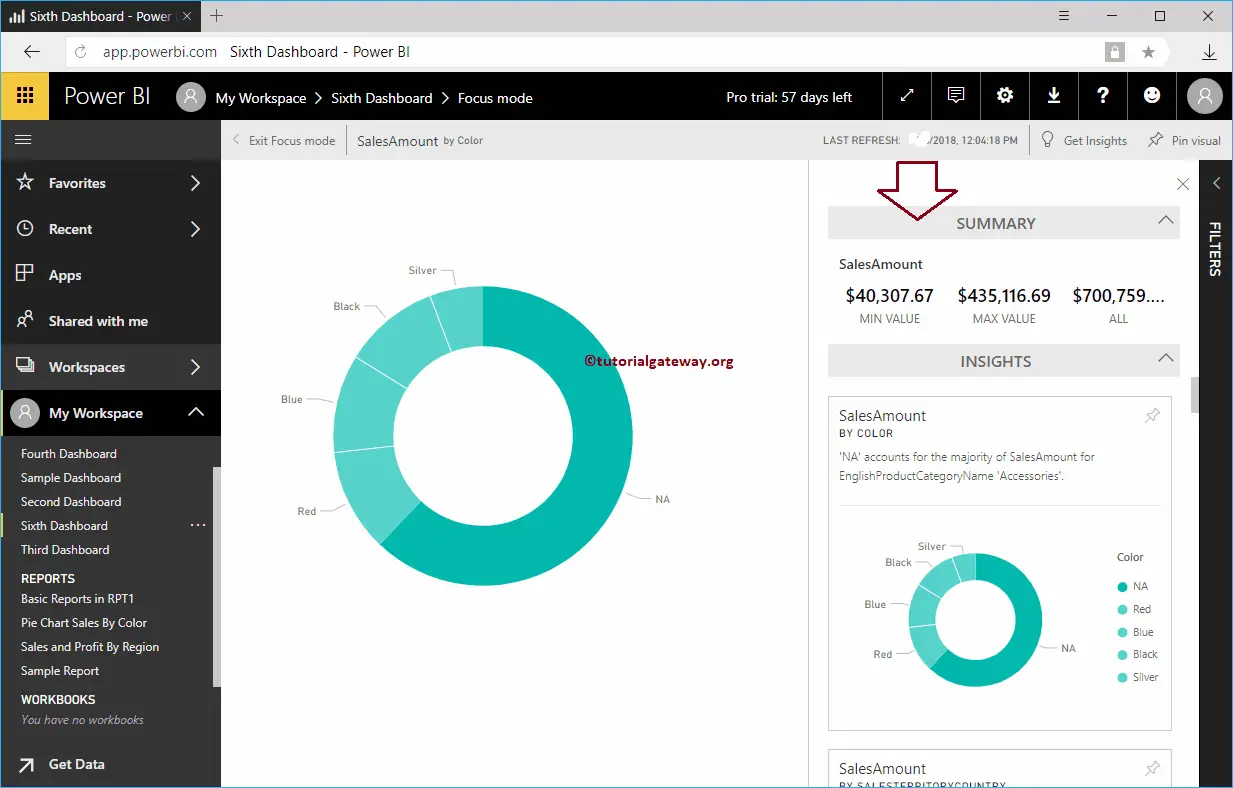
Once your report is in Focus mode, you can see the Get Insights option on the top right. Click the Get Insights Bulb button to display the insights based on this report.
Now you can see the quick insights based on this Power BI report.
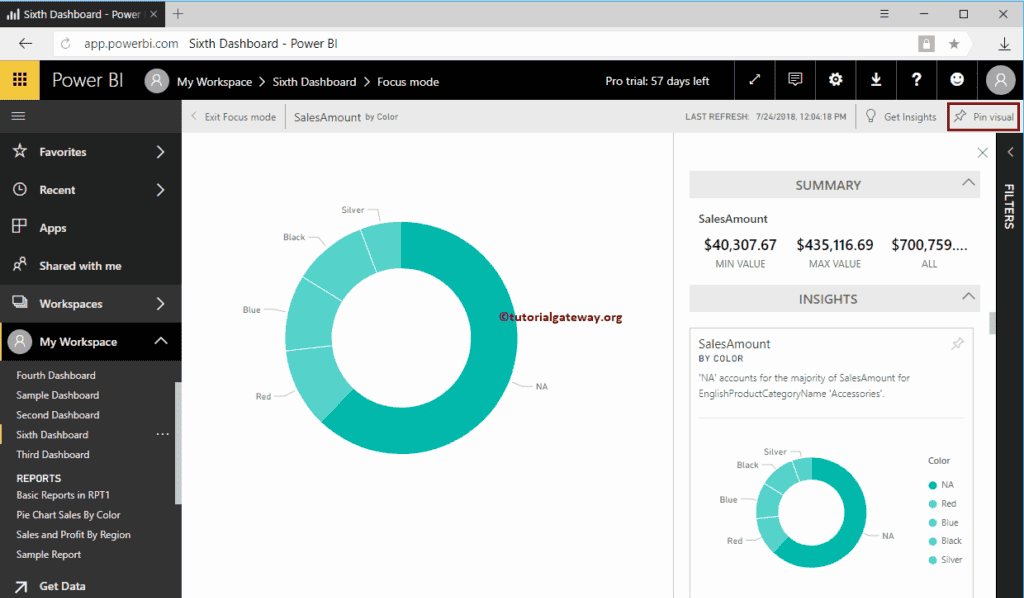
Like any other report, it allows you to pin these visuals to the dashboard. To Pin any individual visual, hover over that visual and show you the Pin Visual button
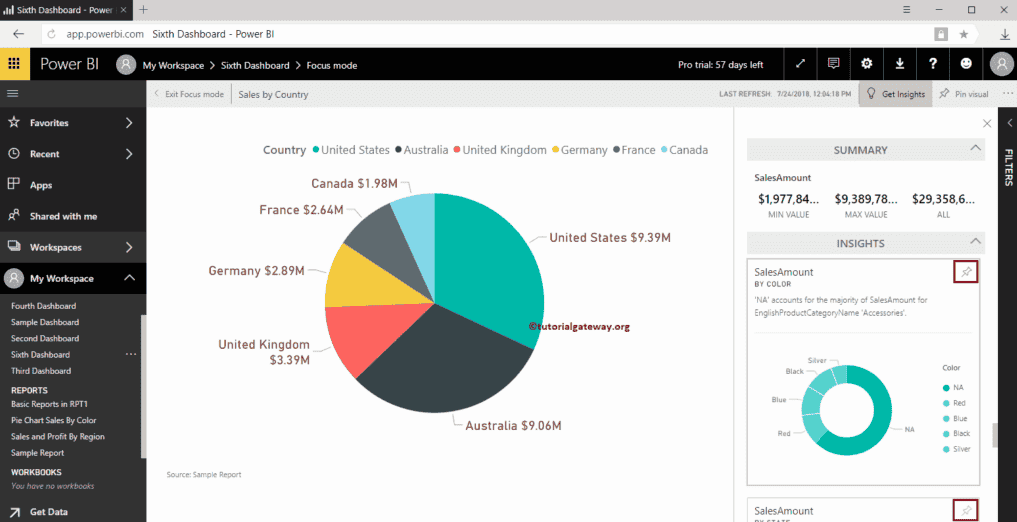
Or, if you want to drill down further, more in-depth into the report, select any report. For the quick insights demo purpose, we selected the Donut chart.
Once you select it, Power BI starts displaying quick insights based on this report.
If you want to Pin this report to the dashboard, click the Pin Visual button in the Top right corner.
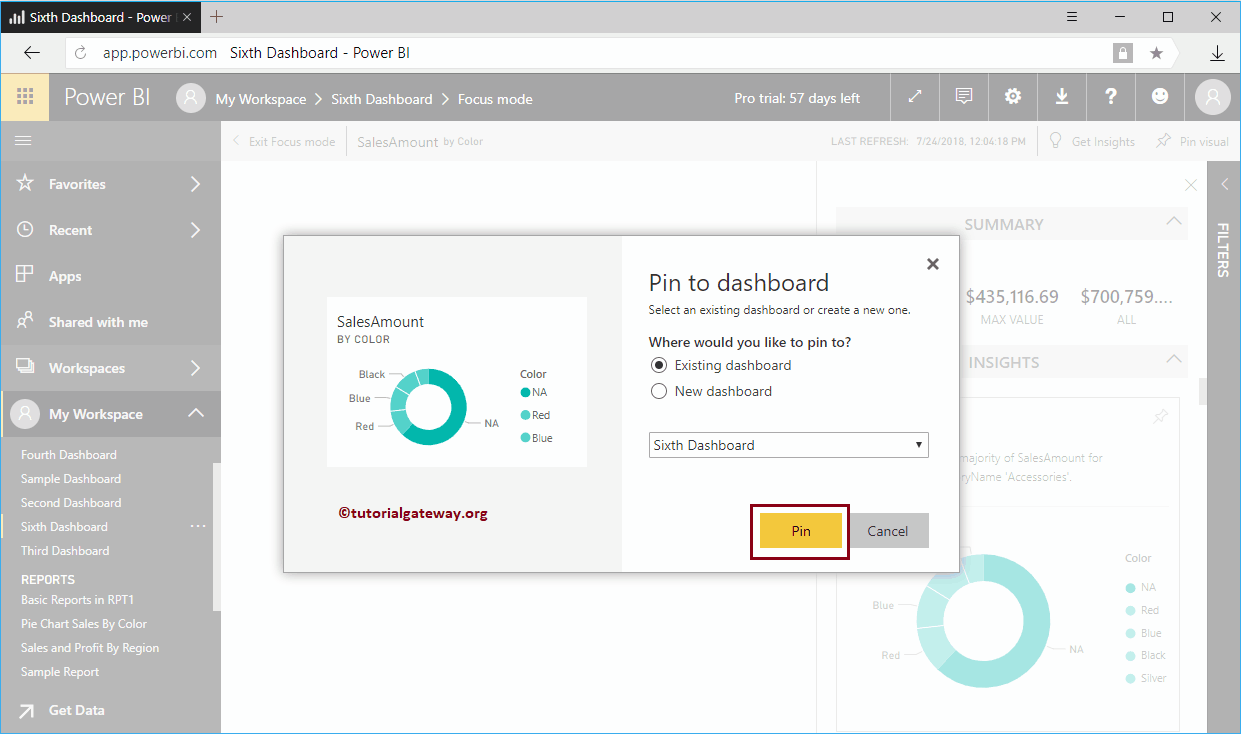
Clicking the Pin Visual button opens the following window. Let me select the Existing dashboard, i.e., the Sixth Dashboard. I suggest you refer to Add Report or Pin Report to dashboard articles to understand these settings.
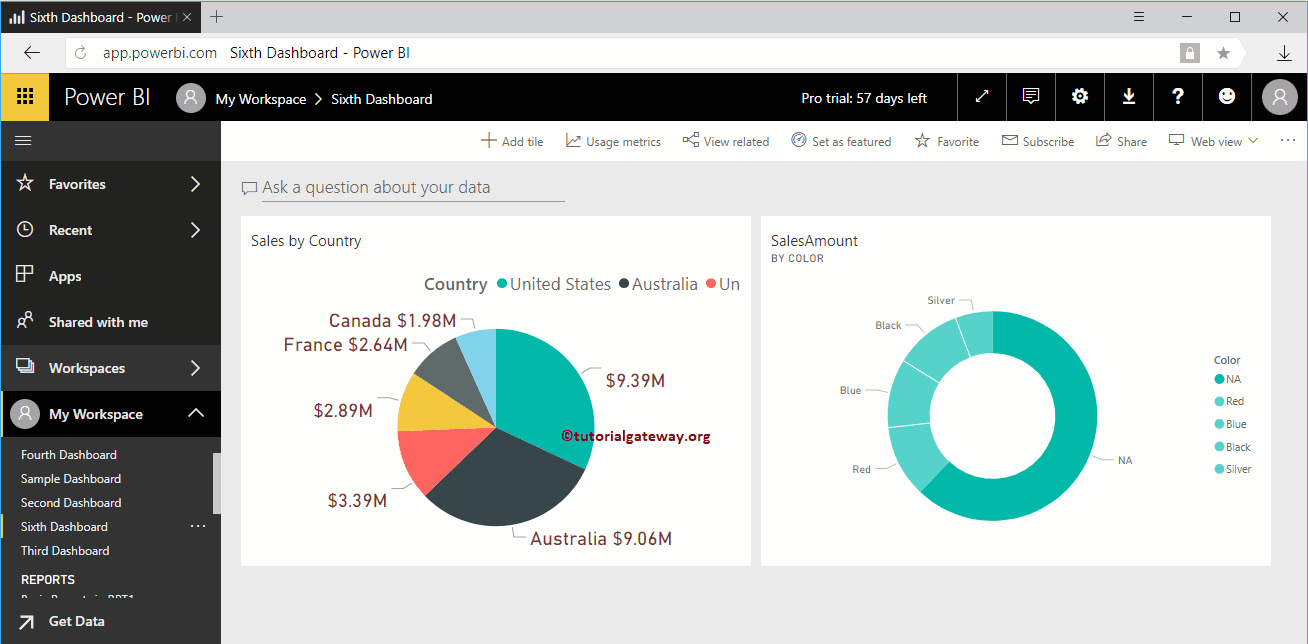
Within the Fifth dashboard, you can see the Donut Chart that we pinned before.
How to Get Insights of a Dataset in Power BI?
Let me show you how to get insights in the Workspace with a practical example. Before we start finding or getting insights into data, let me show you the list of available datasets in my workspace.
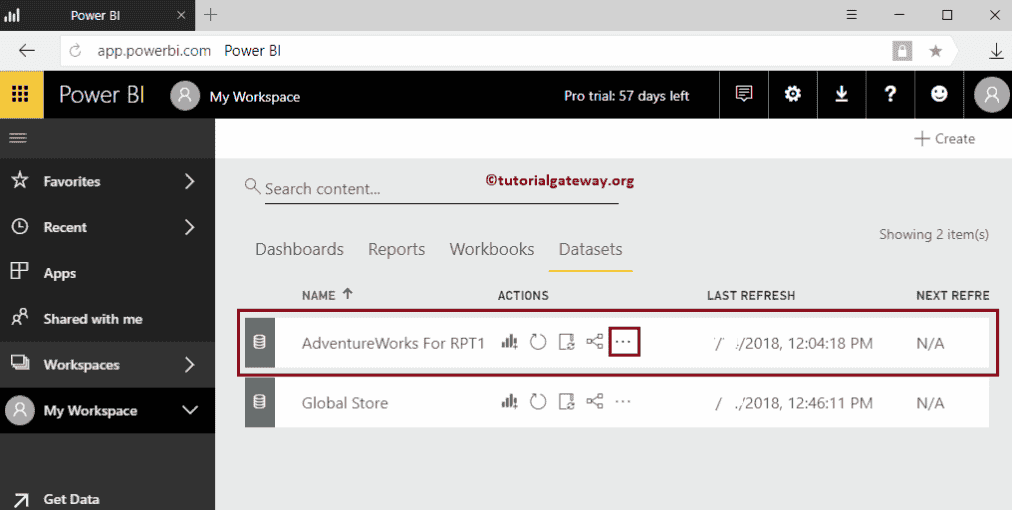
To get insights, first, please click on the My Workspace to view them, and then go to the Datasets tab.
Get Dataset Insights in Power BI
In this example, we get insights into Adventure Works for the RPT1 dataset. So, click on the … button beside the Adventure Works for Power BI RPT1.
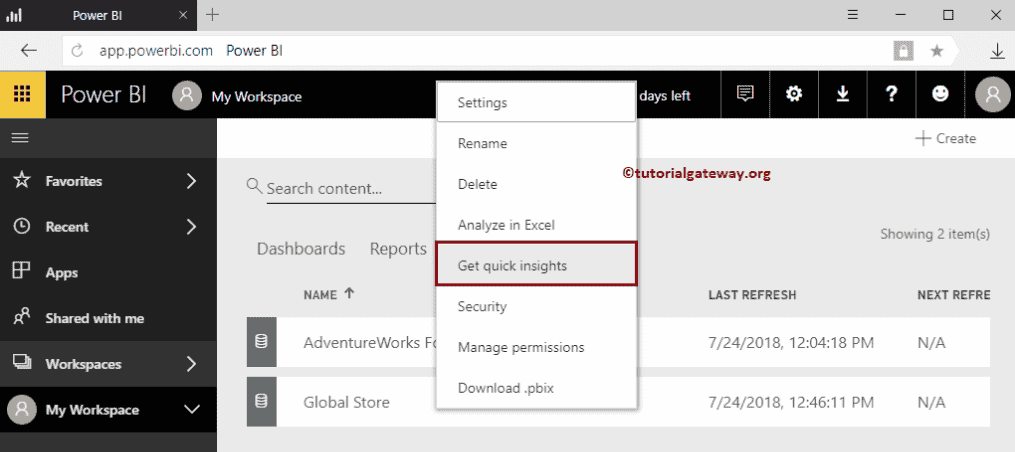
Clicking that … button in My Workspace opens a context menu. Please select the Get Quick Insights option from the context menu.
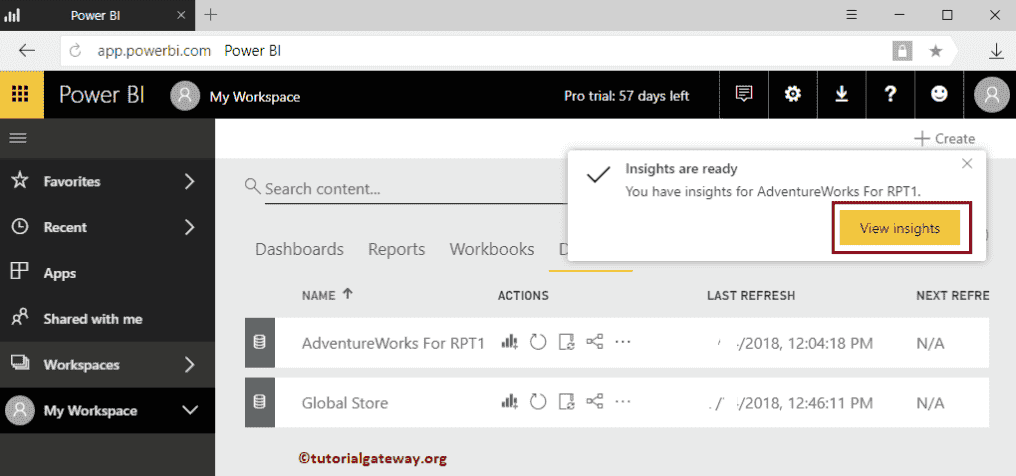
Please wait until the algorithms process your data to find insights. Once the process completes, either you click the button that we showed below
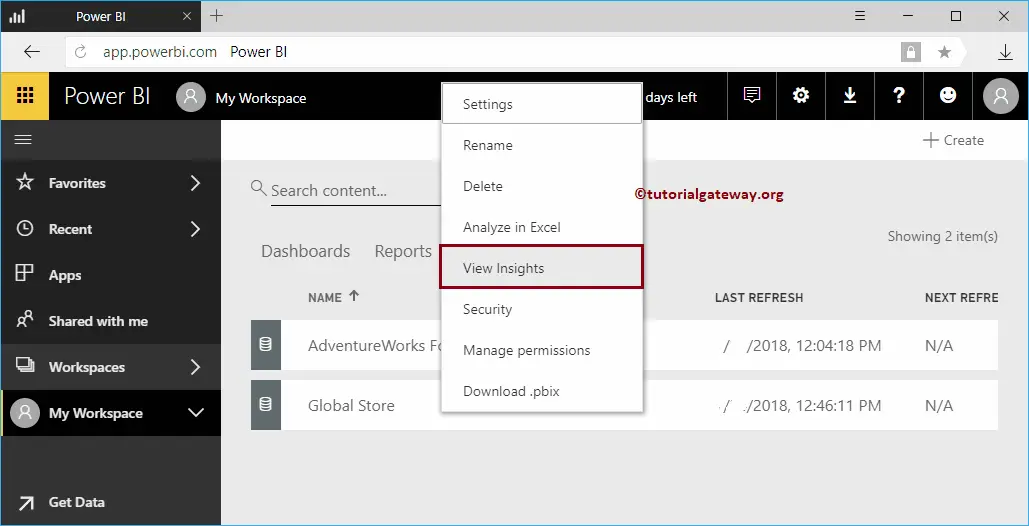
Or click the… button beside the dataset to open a context menu. Please select the View Insights option (this option replaced Get Quick Insights) from that menu.
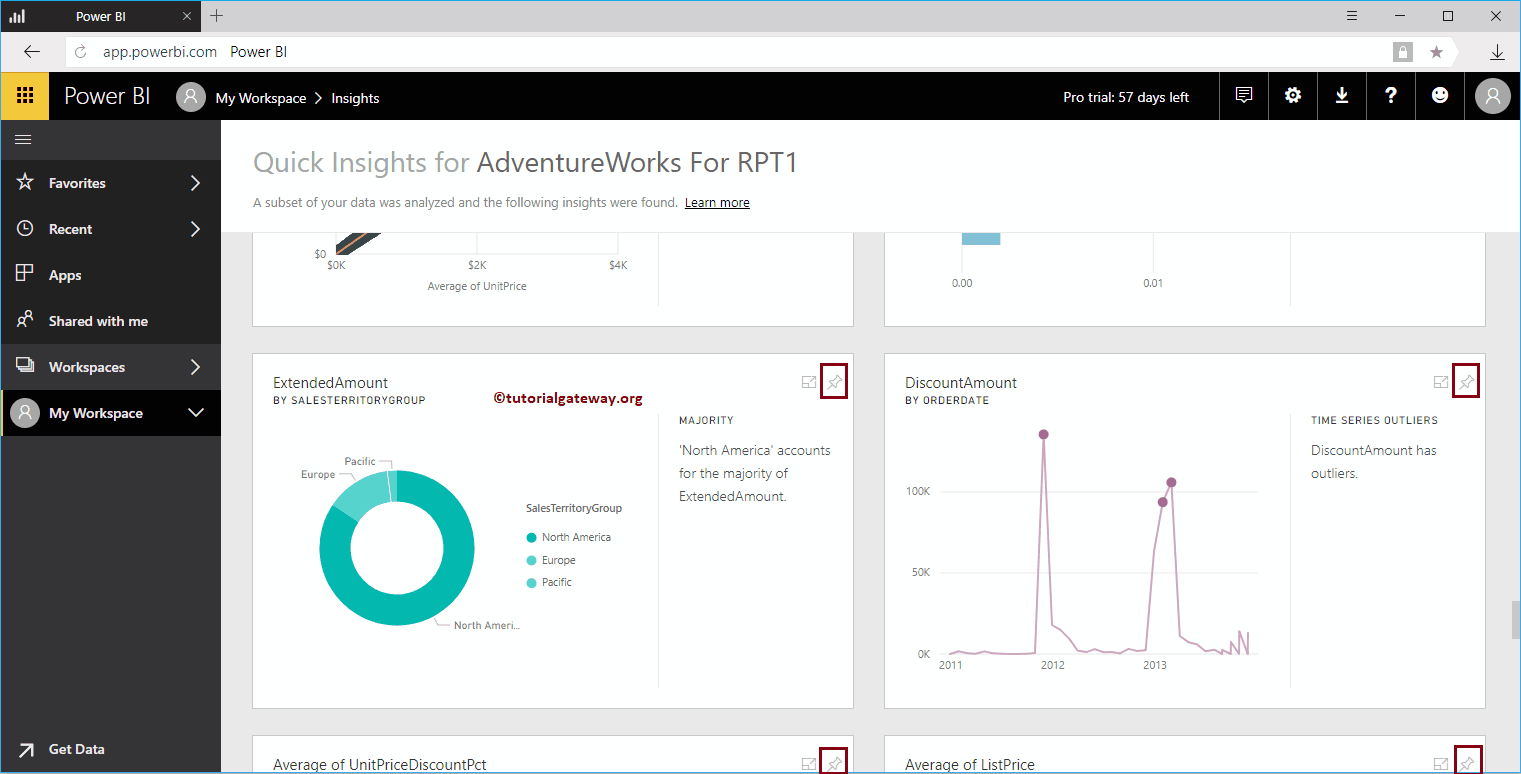
From the screenshot below, you can see the visuals that were generated by the Power BI insights. Like any other report, it allows you to pin these visuals to the dashboard.
In order to Pin any individual visual, hover over that visual and show you the Pin Visual button.
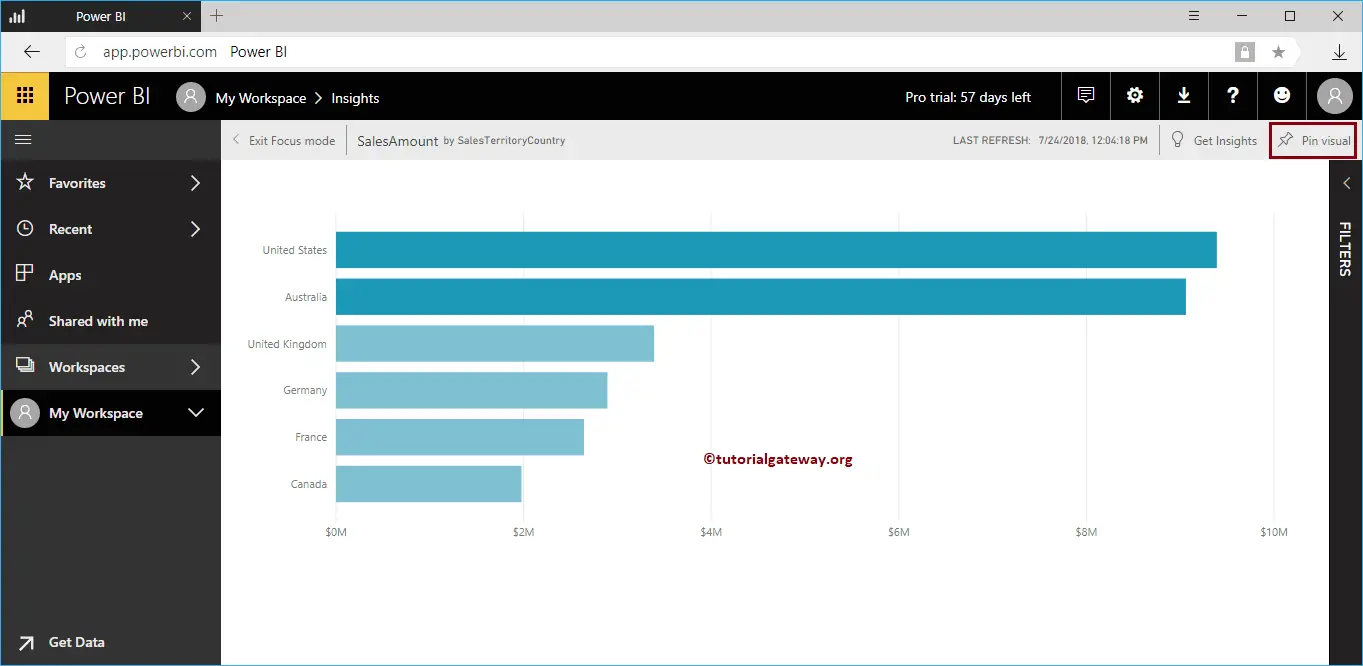
Or click on the report that you want to see. Next, click the Pin Visual button in the Top right corner.
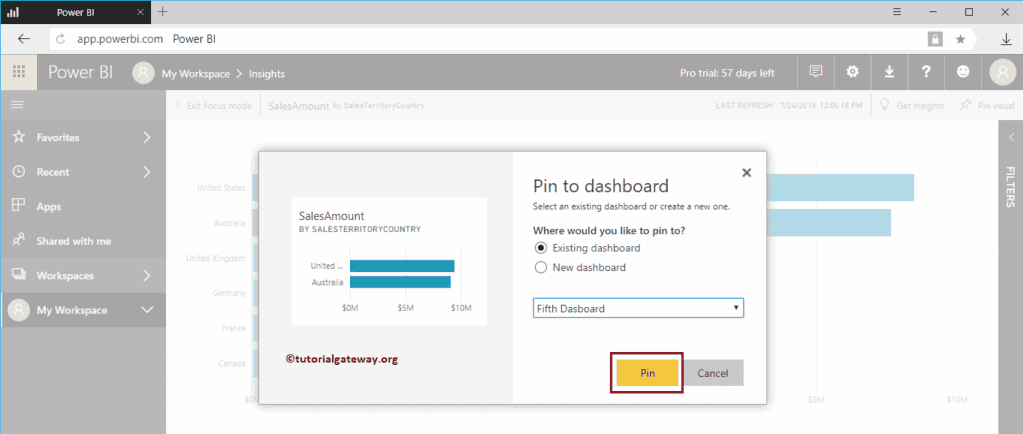
I am clicking the Pin Visual button to open the following window. Let me select the Existing dashboard, i.e., the Fifth Dashboard. I suggest you refer to the Add Report to the Dashboard and Pin Report to Dashboard sections in the Dashboard article to understand these settings.
Within the Fifth dashboard, you can see the Bar Chart that we pinned before.