In this article, we will show you how to create a Bar Chart in SSRS Report Builder without using Wizard. Or, say, steps involved in creating a Bar Chart or any Chart using Report Builder.
For this, we will use the Shared Data Source that we created in our Early reports and an Embedded Dataset.
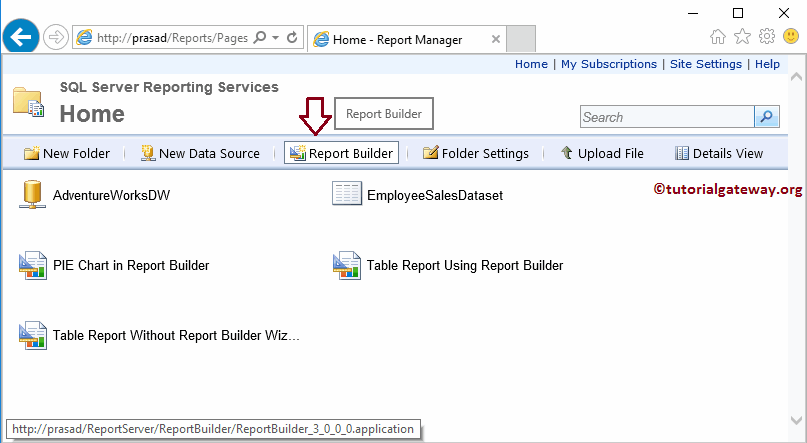
We have to open the SSRS report builder to create a Bar Chart or any Chart. To do this, Please open your report manager and click the Report Builder button, as shown in the screenshot below.
Create Bar Chart in SSRS Report Builder
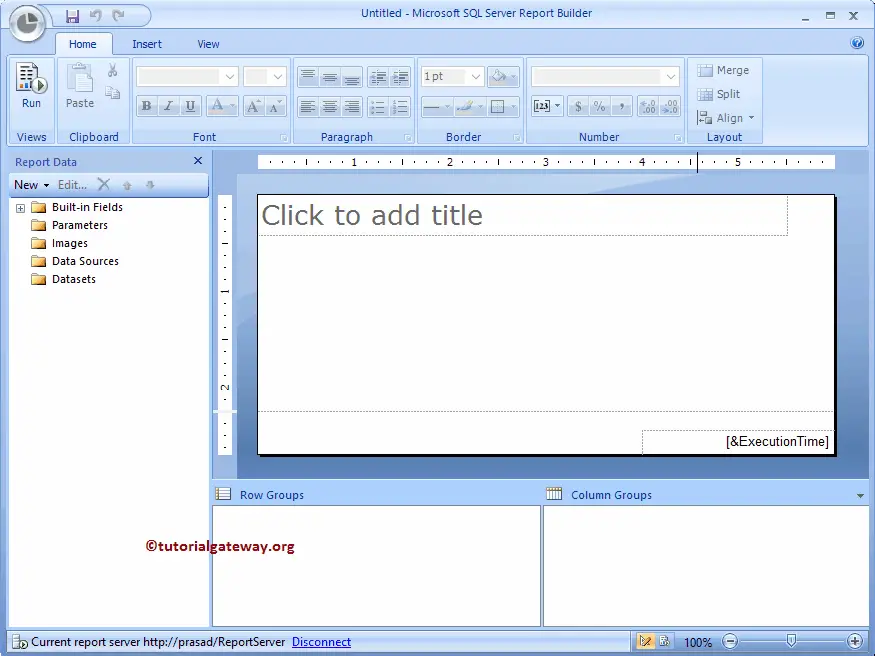
Once you click the SSRS Report Builder button, SQL Server Report Builder will open with a starting page.
In this example, we want to create Bar Chart in SSRS without using Report Builder Wizard. So, Please select the New Report tab and then select the Blank Report option.

After you select the Blank Report option, the report builder will display the Blank Report. We already explained the Designer Panes in our previous article. So please refer to Create a New Report article to understand the same.
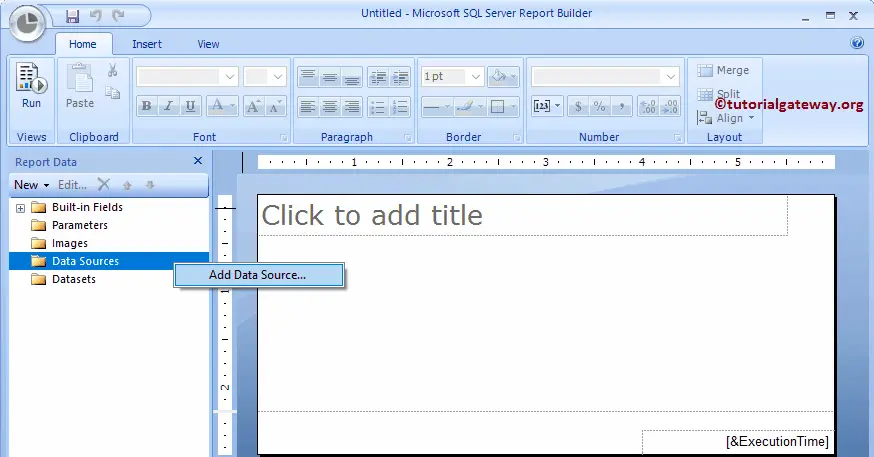
To create a data source, right-click on the Data Sources folder in the Report Data Pane. Next, select the Add Data Source option from the context menu.
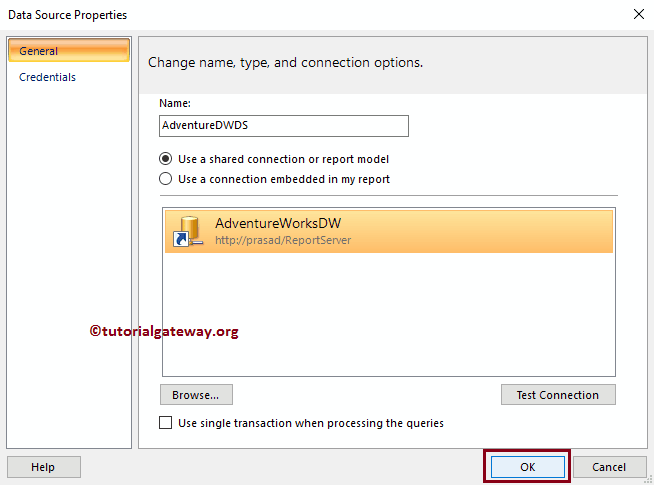
By clicking on that option, it will open the Data Source Properties window to configure the Data Source.
In this example, we select the Shared Data Source we created earlier. Please refer to Create Shared Data Source in Report Manager to understand the creation of Shared Data Source.
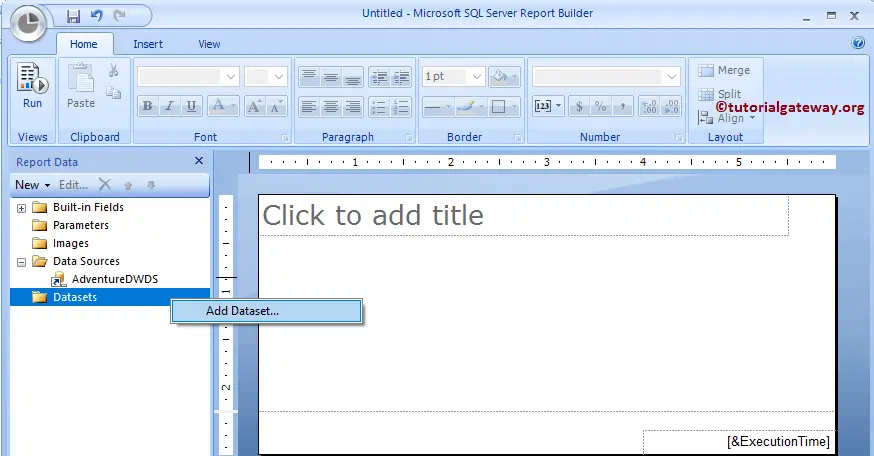
To create a dataset for this report, Right-click on the Datasets folder in the Report Data. Then select the Add Dataset option from the context menu.
It will open a new window called Dataset Properties. Here select the first option to select the Shared Dataset we created earlier. Or by selecting the second option, we can create a new dataset also.
For now, we are selecting the second option. I suggest you refer to the Create a New Dataset in Report Builder article to understand the steps involved in creating a shared dataset.
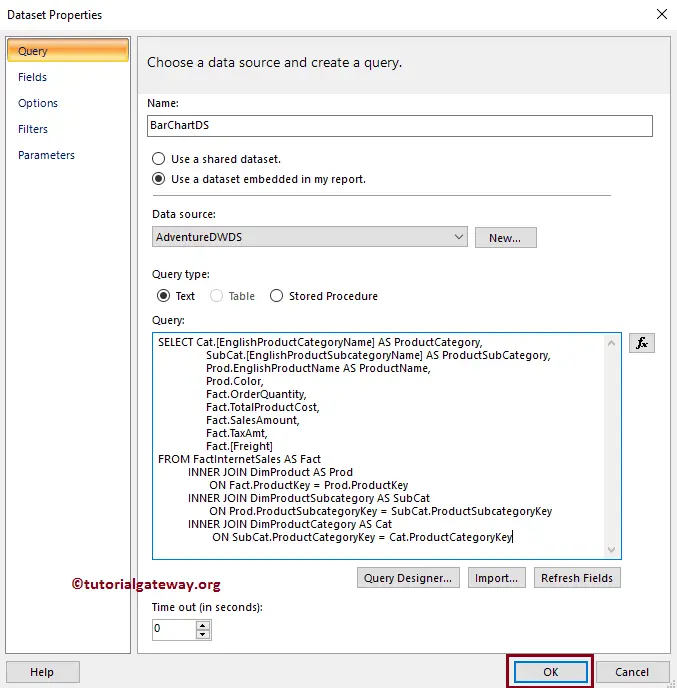
SQL Query that we used in our Dataset Create Bar Chart in SSRS Report Builder is:
-- Create Bar Chart
SELECT Cat.[EnglishProductCategoryName] AS ProductCategory,
                SubCat.[EnglishProductSubcategoryName] AS ProductSubCategory,
                Prod.EnglishProductName AS ProductName,
                Prod.Color,
                Fact.OrderQuantity,
                Fact.TotalProductCost,
                Fact.SalesAmount,
                Fact.TaxAmt,
                Fact.[Freight]
FROM FactInternetSales AS Fact
          INNER JOIN DimProduct AS Prod
                 ON Fact.ProductKey = Prod.ProductKey
          INNER JOIN DimProductSubcategory AS SubCat
                 ON Prod.ProductSubcategoryKey = SubCat.ProductSubcategoryKey
          INNER JOIN DimProductCategory AS Cat
                  ON SubCat.ProductCategoryKey = Cat.ProductCategoryKey
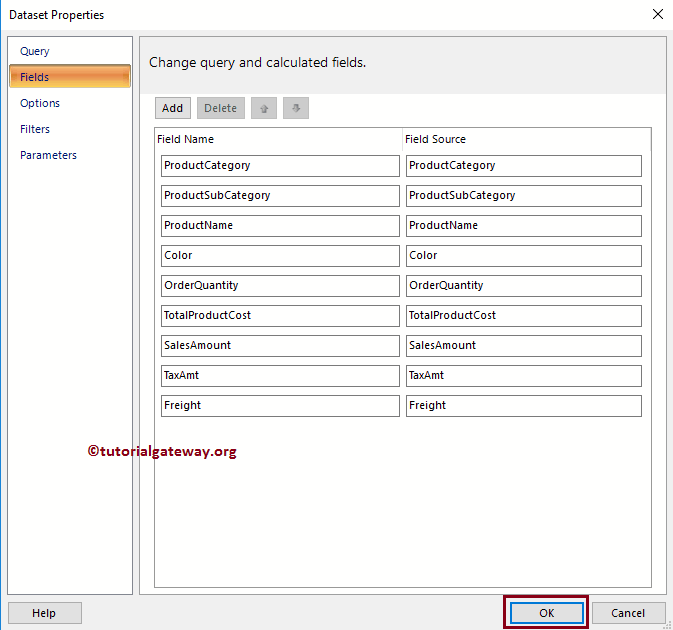
Let me check the fields that the Dataset is returning.
Within the SSRS Report Builder, please select the Insert tab to insert the Chart into the report designer to create this Bar chart.
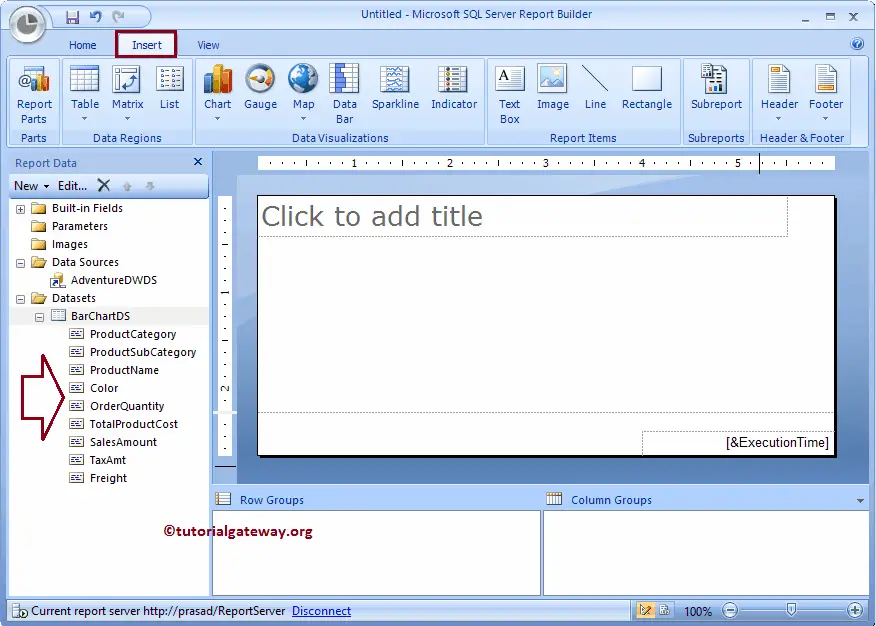
Please click on the down arrow below the Charts button. Next, select the Insert Chart option from the Menu to add the table to the report region.

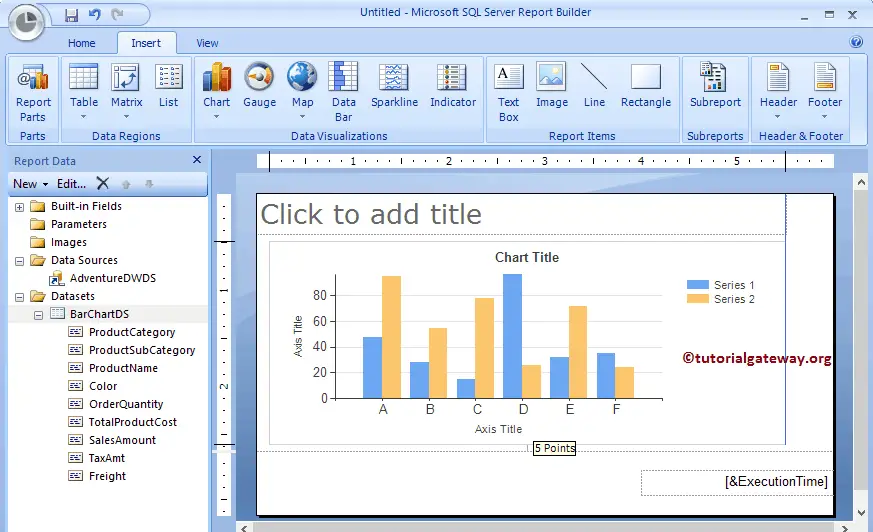
Drag and drop a Chart to the Data region. As you can see from the screenshot below, it is displaying the Bar Chart by default.
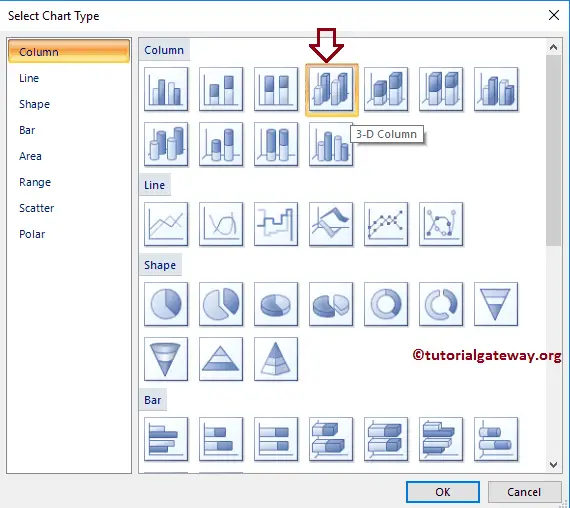
When you drag and Drop the Chart from Insert Tab to Design space, a new window called Select Chart Type will be opened to select the required chart from the available ones. In this example, we are selecting a 3D Column Chart.
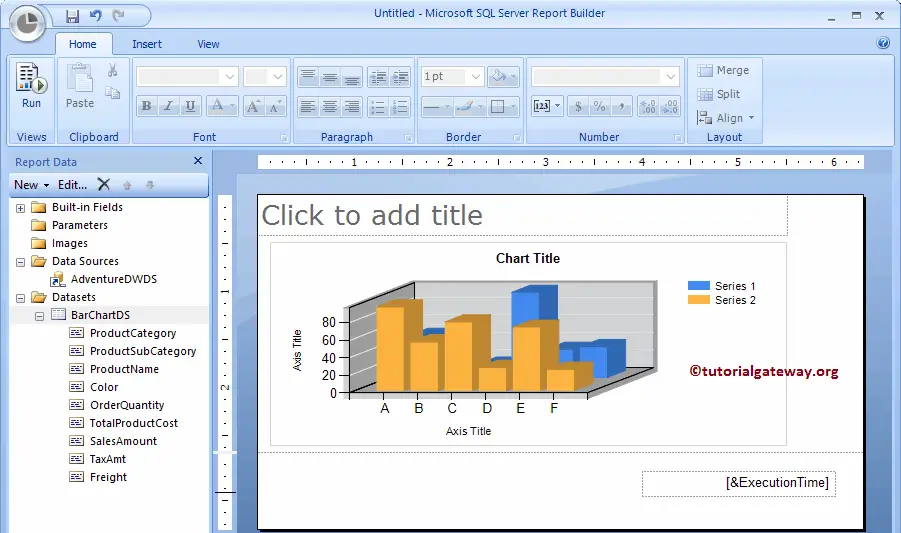
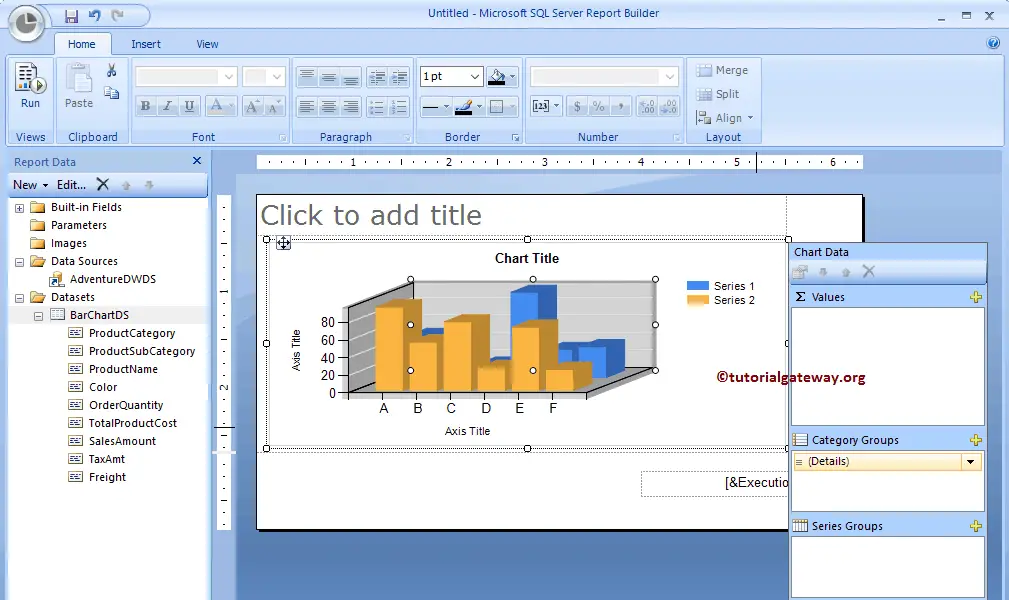
Once you click the Ok button, a Three-dimensional Column chart with dummy data will display in the design region.
Click on the empty space around the SSRS Column Chart to open the Chart Data window.
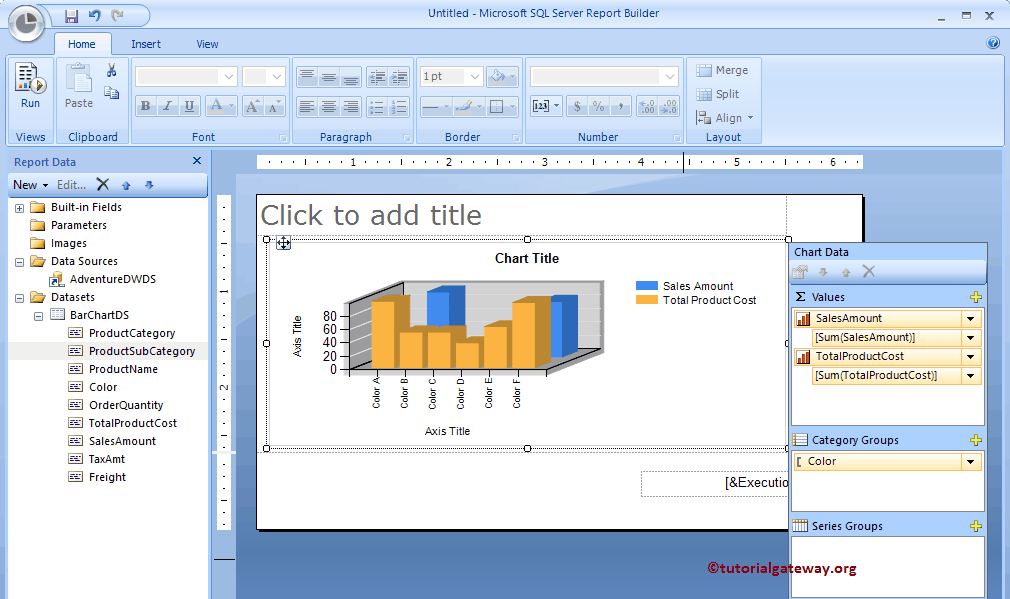
In this example, we will create a Column chart for the Sales Amount and the Total Product Cost of Products divided by Product Color. So, Drag and drop the Sales Amount and Total Product Cost columns from the dataset to chart data values and Color in the category group.
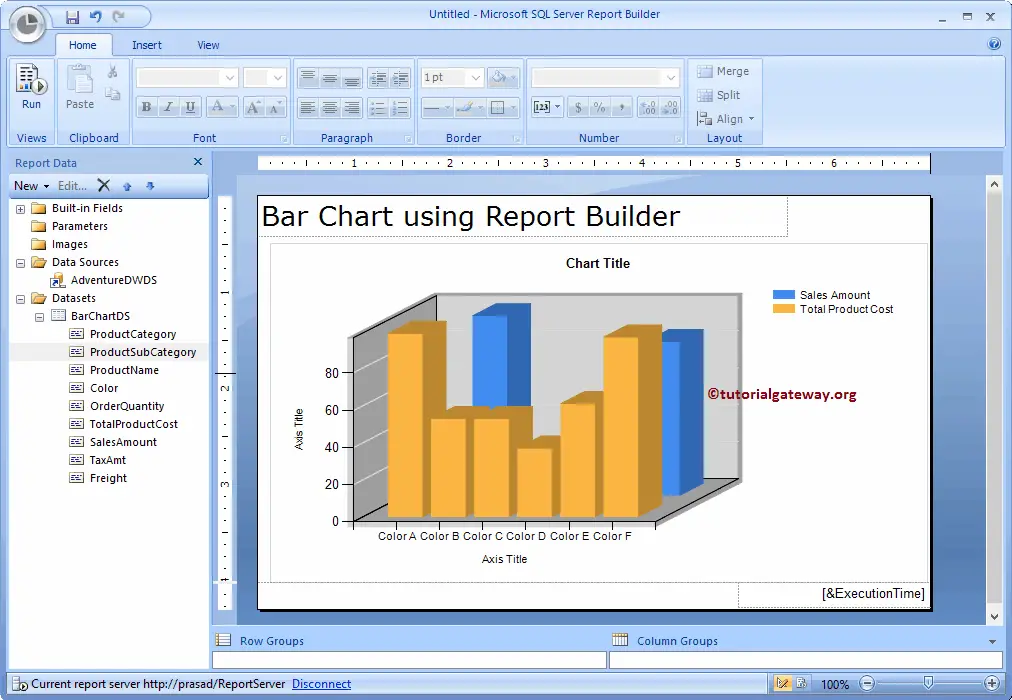
Let me change the newly created report name to Bar Chart using SSRS Report Builder and click the Run button.
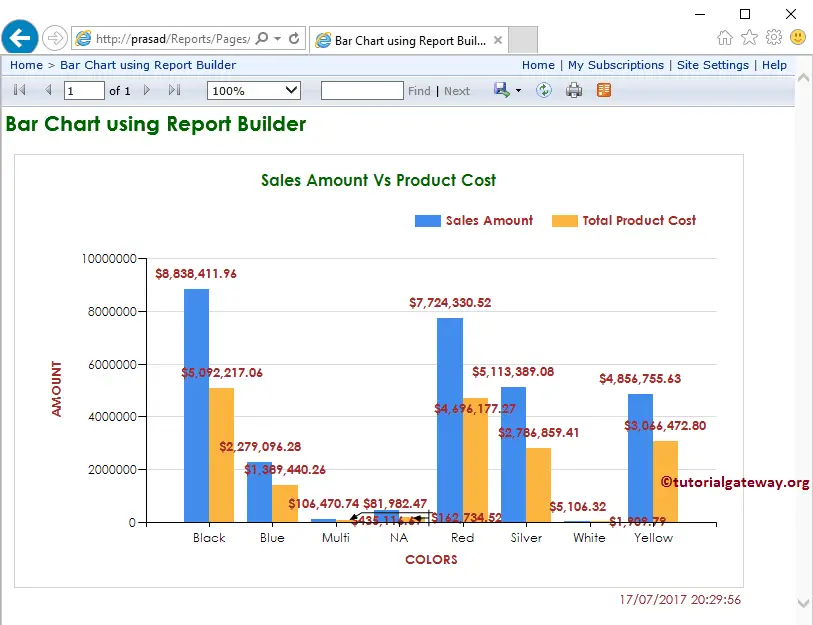
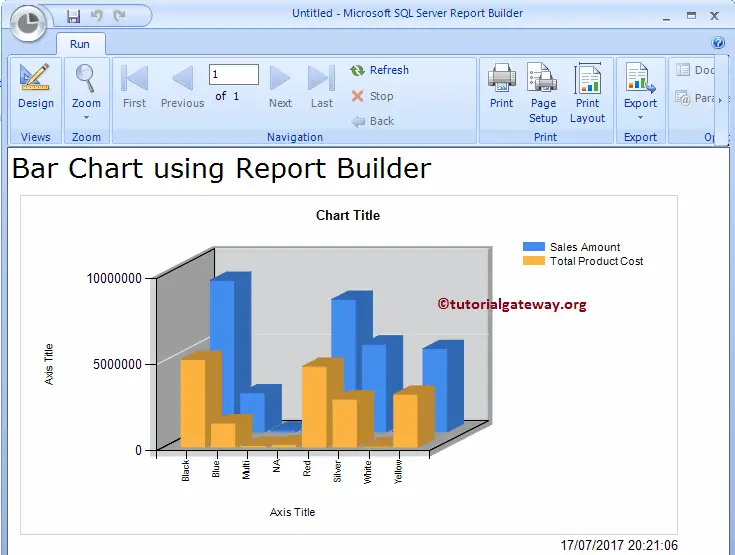
Once you click the Run button, following the Bar Chart will generate.
Let me change the Chart to a regular Column Chart and Format the Chart for a better look. I suggest you refer to Create a Column Chart and Formatting Column Chart to understand the steps involved in changing the Chart types and adding Data labels to charts.
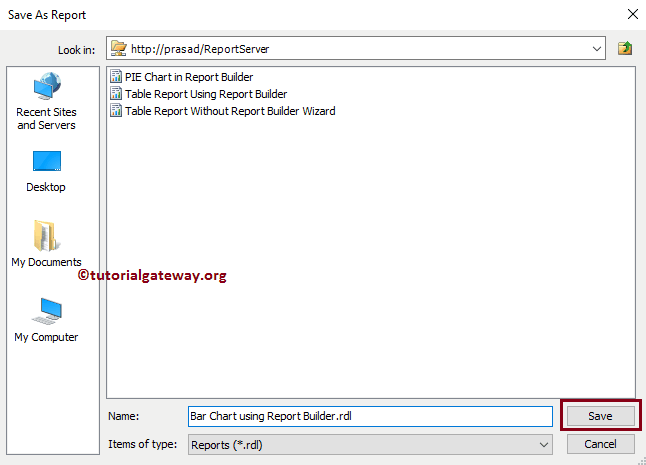
Next, Please click on the Save button to save the report to the report server.

After you click on the Save option, a new window called Save As Report will be opened. Here you can select the local file system or the Report Server. Let me select the Report Server.
Let me open my Report Server to show the newly created Bar Chart Report. If you want to Run the report or see the preview, you don’t have to access the Report Builder or BIDS. Just click on the Bar Chart will run the report. Let me select the report that we saved previously and click on it.
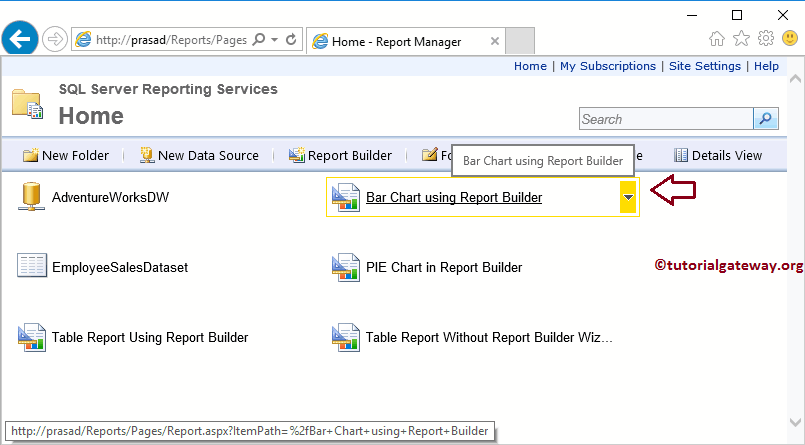
Now you can see the Bar Chart inside the Report Server.