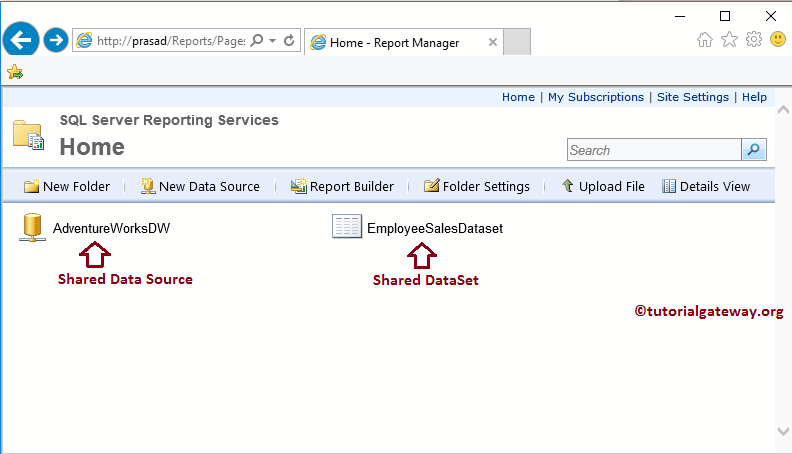
In this article, we will show you how to create a New Dataset using SSRS Report Builder Wizard. Or we can say, steps involved in creating a Shared dataset in SSRS Report Builder.
For this, we are going to use the Shared Data Source that we created in our earlier SSRS posts.
To create a New Dataset, we have to open the report builder. To do this, Please open your report manager and click on the Report Builder button as shown in below screenshot
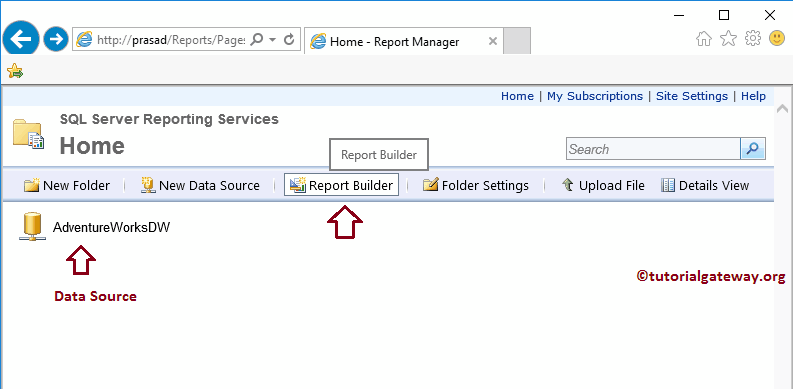
Once you click on the Report Builder button, Microsoft SQL Server Report Builder will open.
Create a New Dataset using SSRS Report Builder Wizard
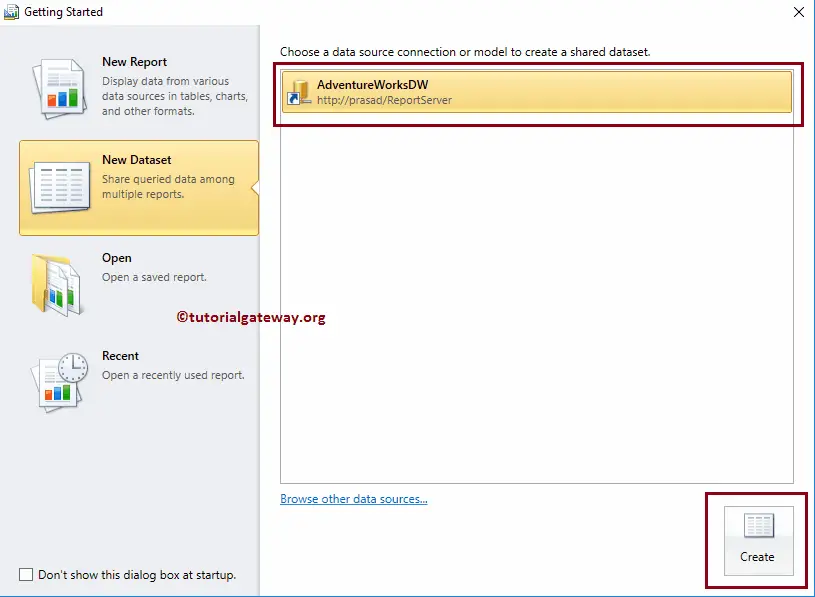
In this example, we want to create a new dataset using the SSRS Report Builder wizard. So please select the New Dataset tab.
If you observe the below screenshot, the Create button at the bottom is Grey out. It is because report Builder needs a data Source before it starts creating the dataset.
So, let me Browse the existing Data Source by clicking the Browse other data Sources.. hyperlink. Remember, you can’t create a Data source at this point, so always create a data source before you create the dataset.
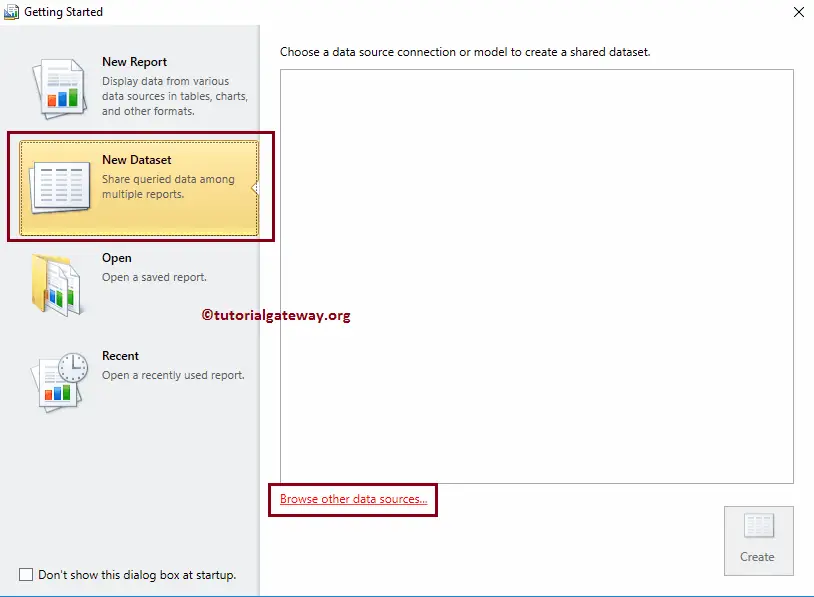
Once you click on the Browse other data Sources.. hyperlink, a new window will open to select the shared data Source from the Report Server.
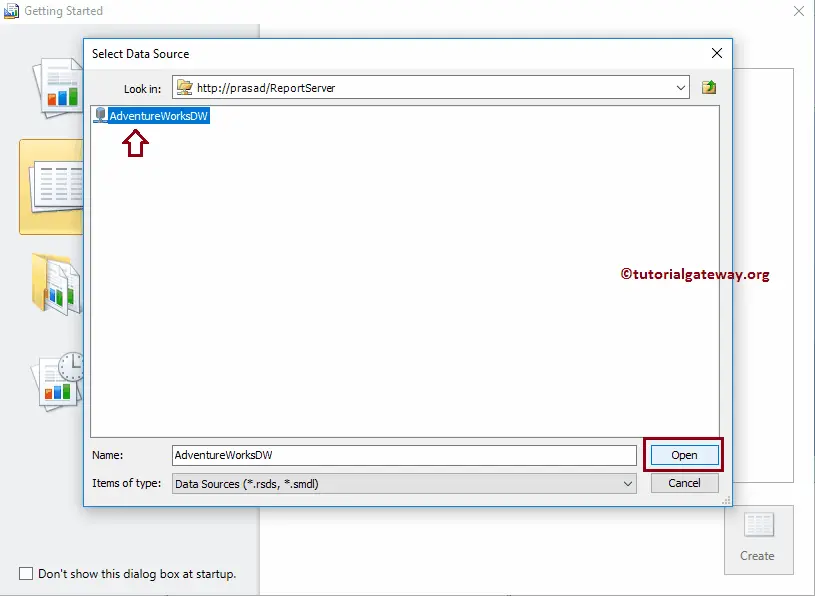
After you select the data Source only, Create button at the bottom will be enabled to create a dataset
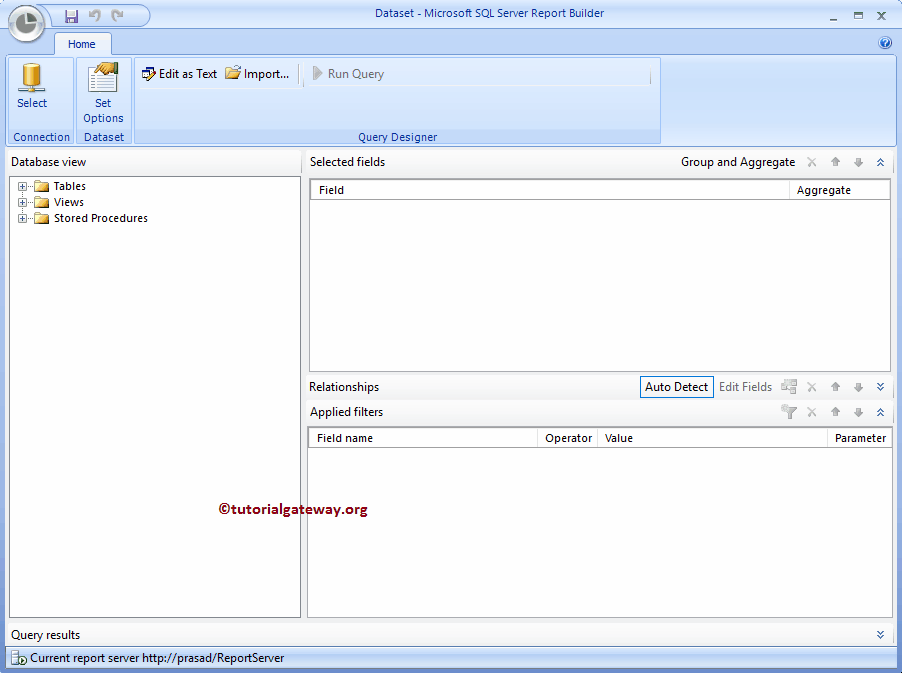
Once you click on the Create button, the report builder opened with the following window.
Under the Database View section, you have an option to select the existing Tables, Views, and Store procedures present in the Adventure Works DW.
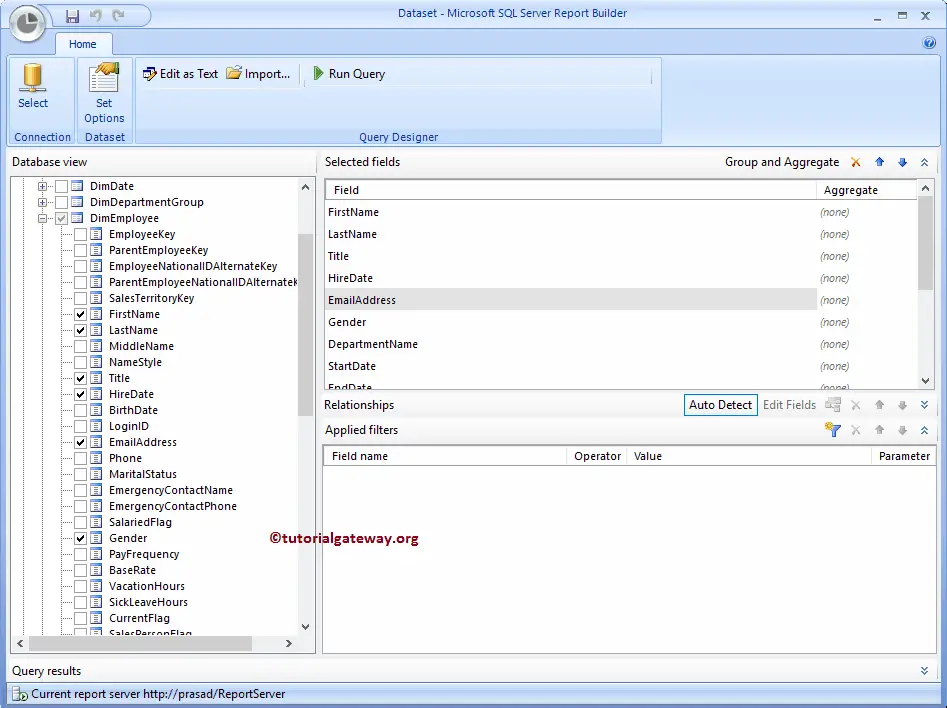
In this example, we will select two tables from the Adventure Works. To do so, go to Database View pane and expand the tables folder.
From the below screenshot, you can see that we are selecting the [Dim Employee] table and the [Fact Reseller Sales] table.
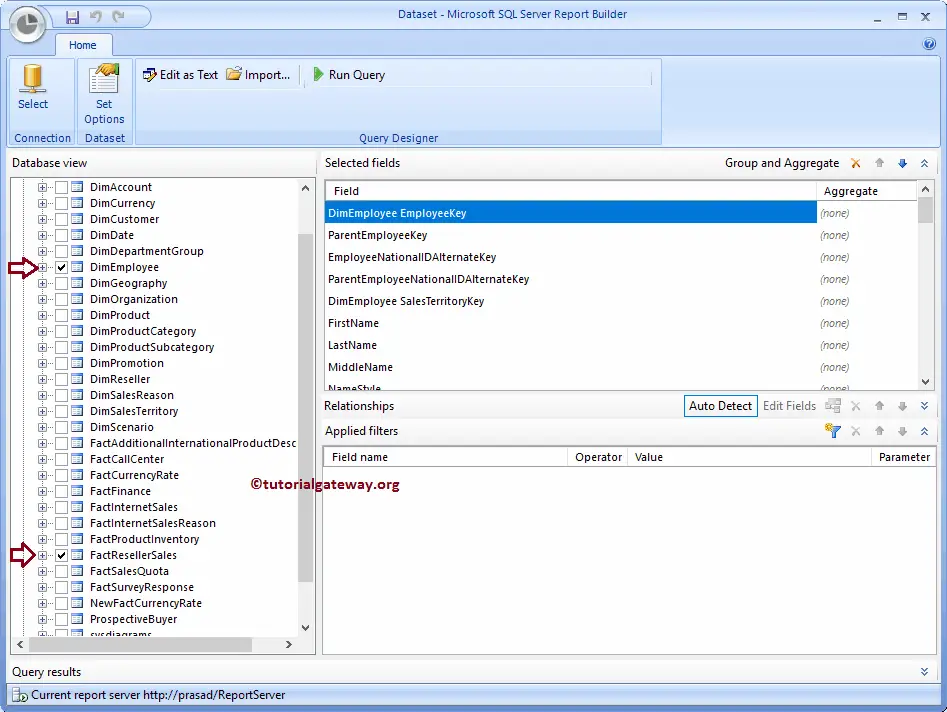
Once you checkmark those tables, all the fields (or Columns Names) present in both the tables will add to the Selected Fields pane.
As you can see from the below screenshot, under this section, we had the Delete field button to delete the unwanted columns from the dataset. To delete a field, Please select the filed and then click the Delete Field button.
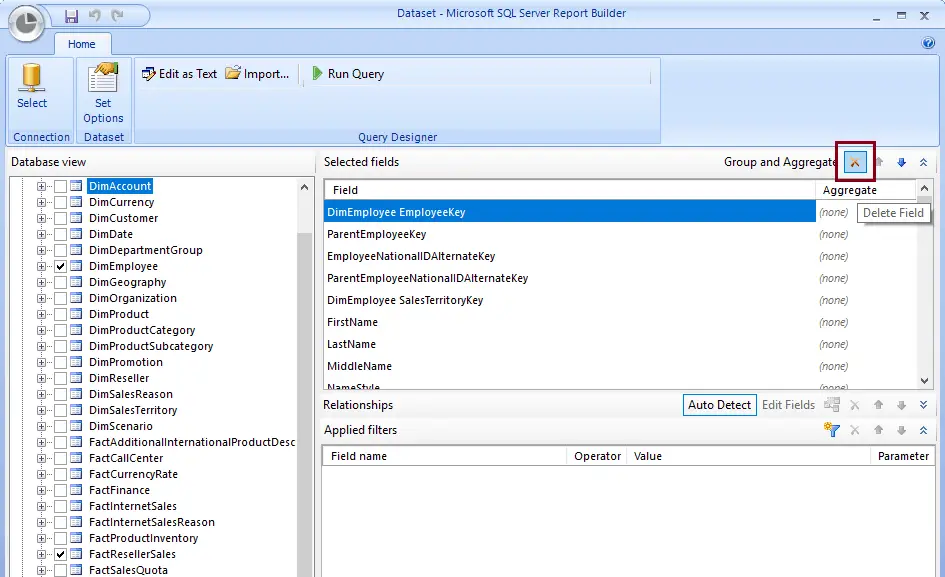
Or you can expand the Table in Database View pane, and unchecked the unwanted Columns as we shown below
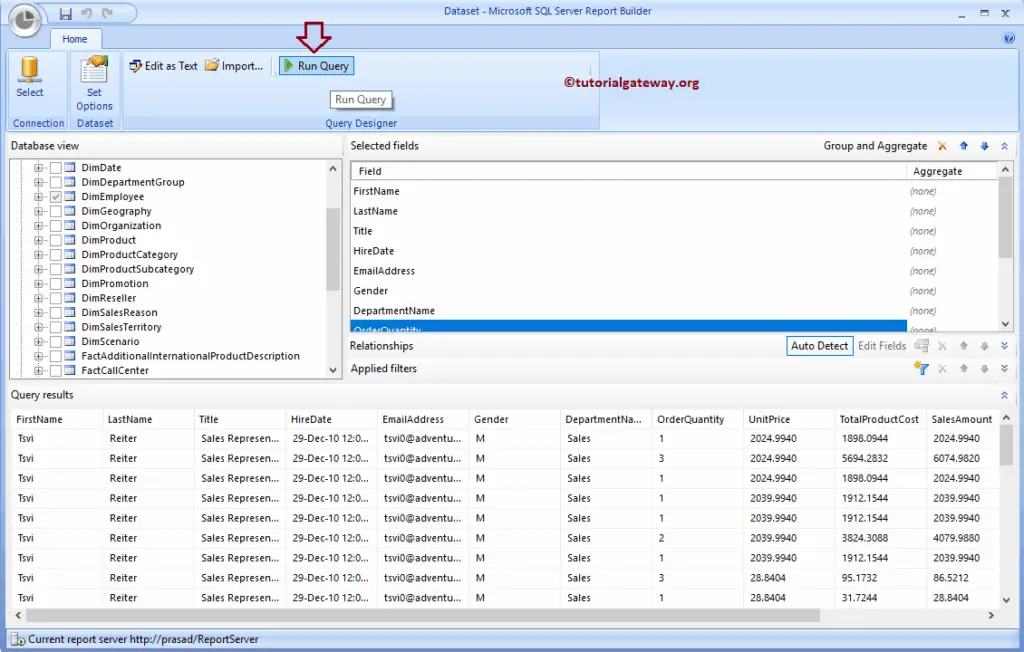
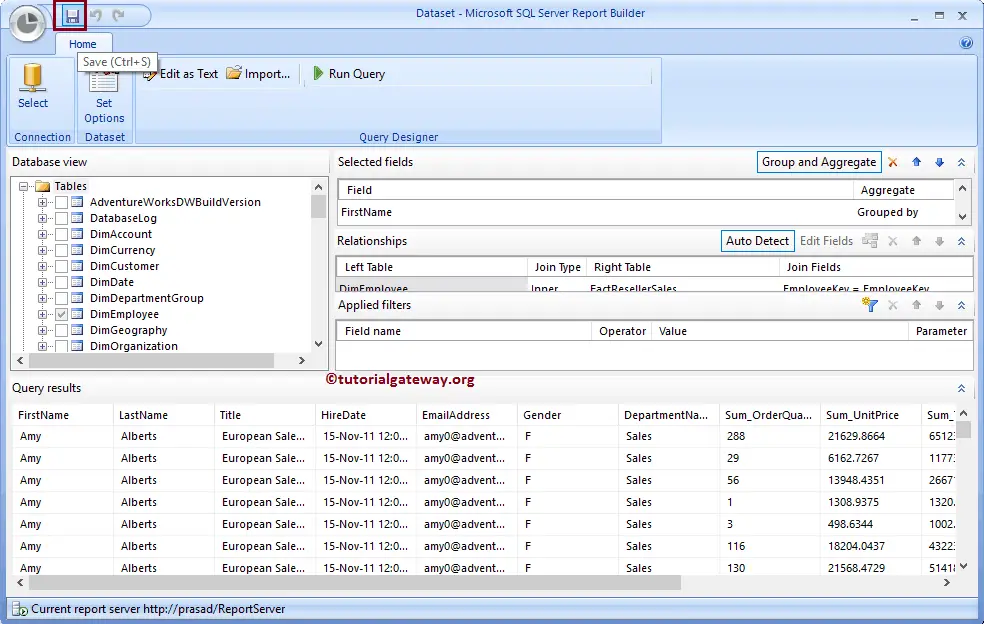
Once you finish selecting the required Tables, Fields please click the Run Query button to check the data that the generated query is returning.
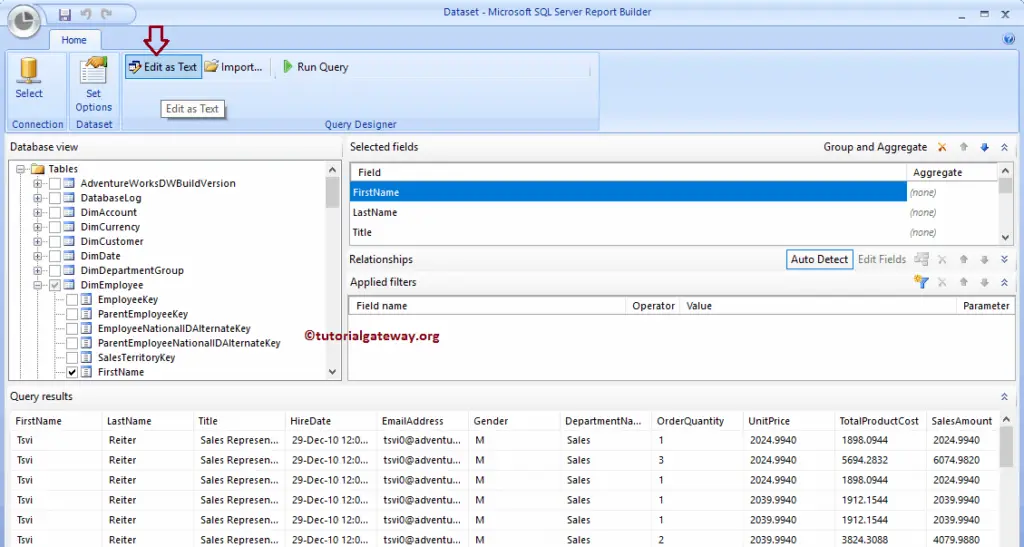
If you are familiar with writing SQL query on your own, then click on Edit as Text button
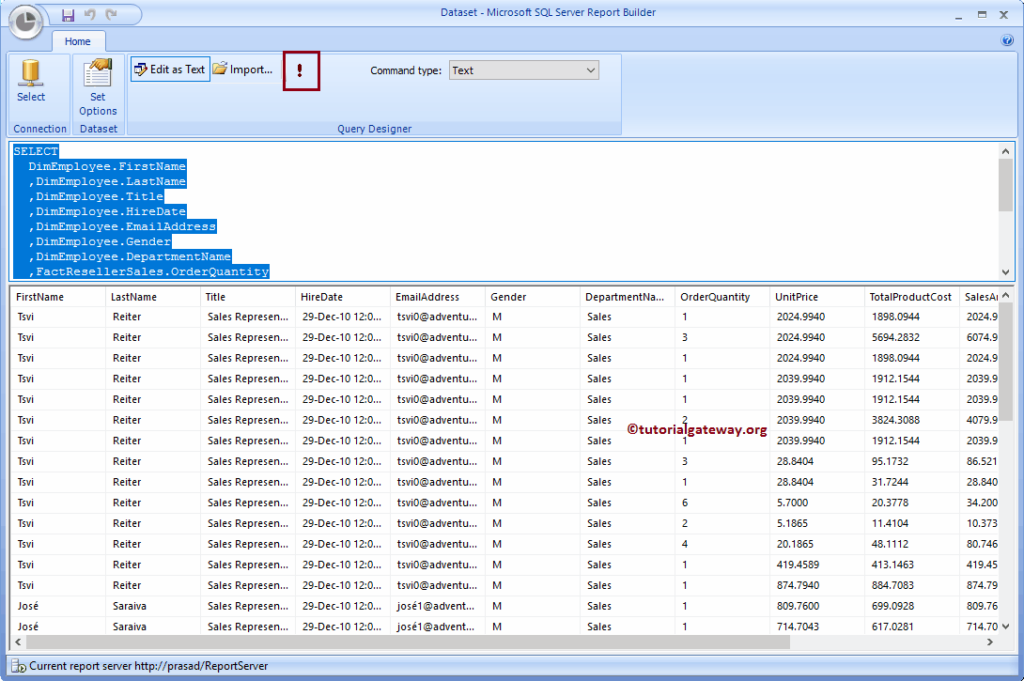
Once you click on Edit as Text button, the following window will be displayed to write your custom SQL query. Once you finish writing the query, you can use the Execute button for the result. For now, we will stick with the query that we created in our previous step.
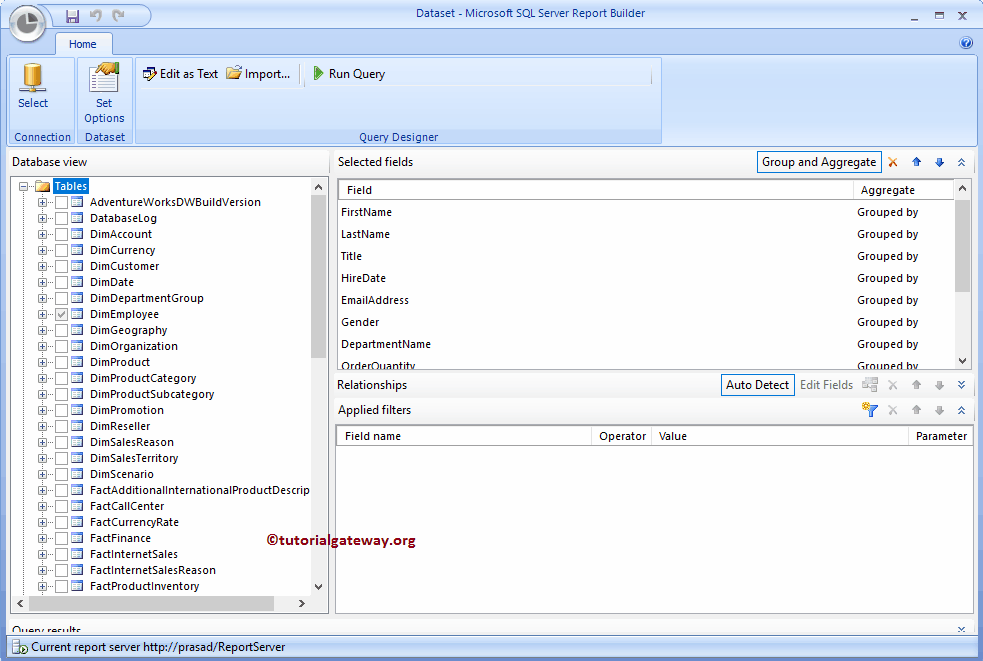
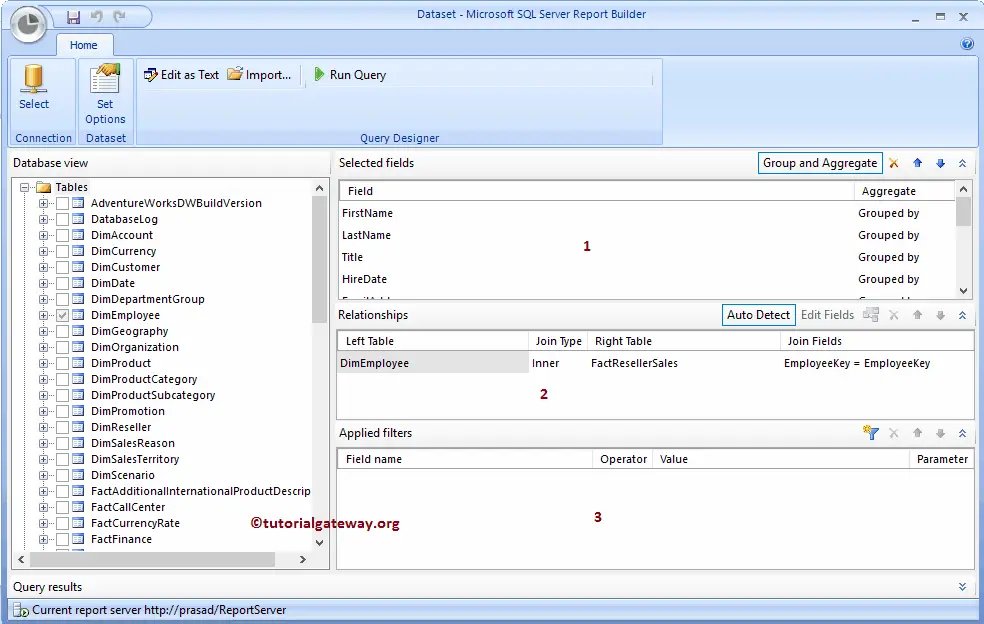
Under the Selected Fields section, we had the Group and Aggregation button. By clicking this button will add Group By condition to all the fields present in the Selected Fields section.
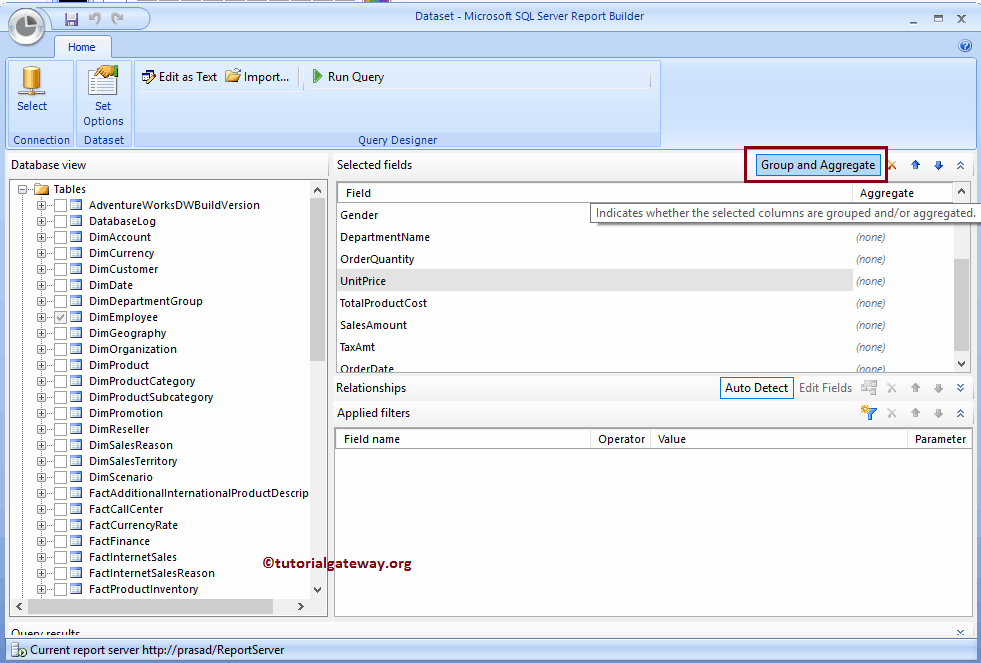
You can see the same from the below screenshot.
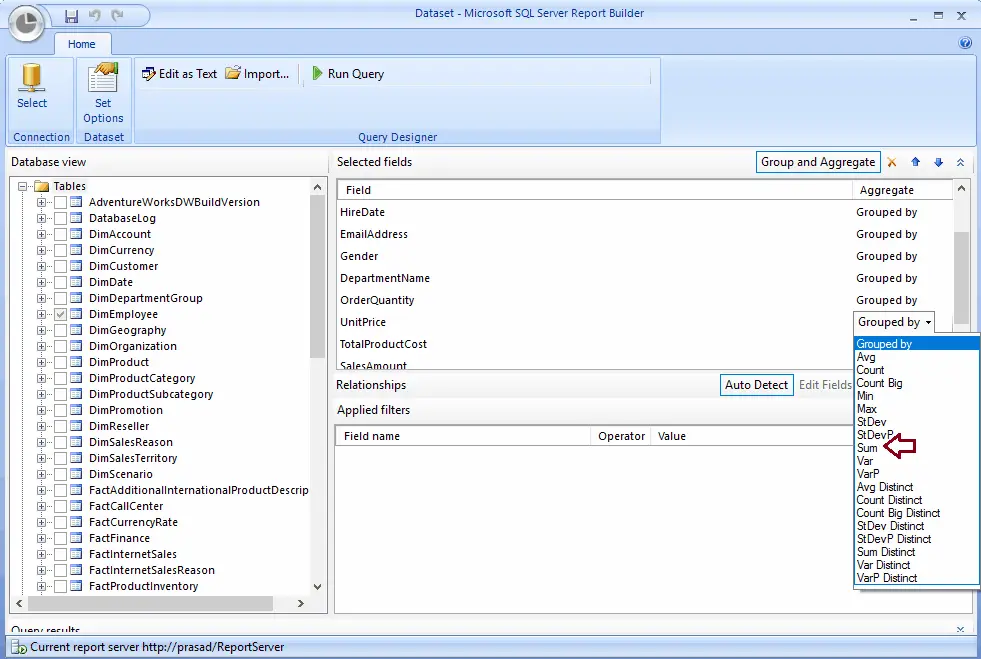
Let me add the Aggregate Functions to the Numeric columns. To do so, Please select the column with numeric data and change the Aggregate from Group By to Sum.
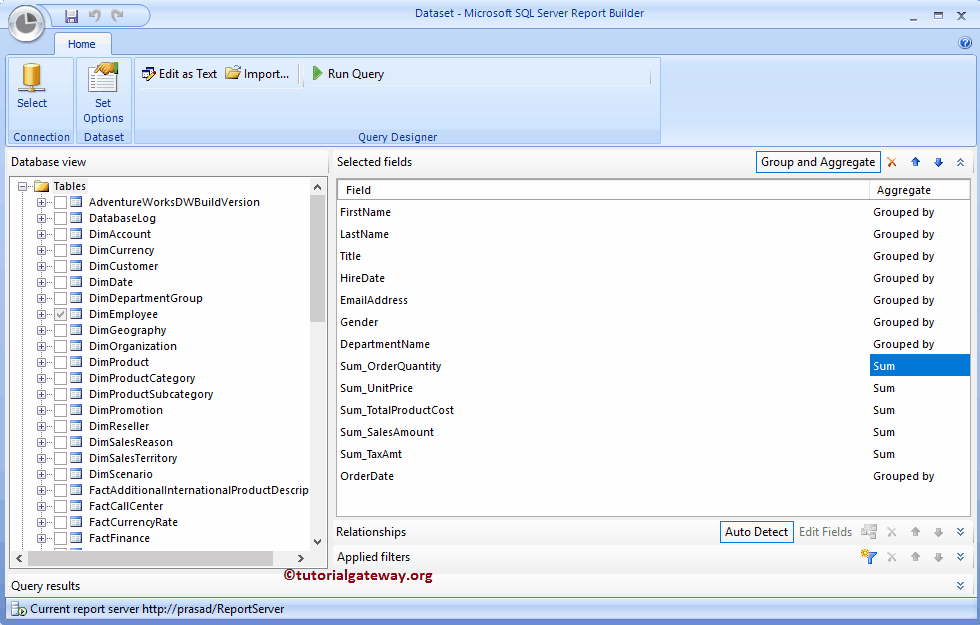
Use the same technique to apply the Sum function on Order Quantity, Total product Cost, Sales Amount, Tax Amount, and Unit Price
I think I forgot to explain the Panes under the Query Designer.
- Database Views: This pane will list out the existing Tables, Views, and Store procedures present in the Data Source that you selected.
- Selected Fields: List of fields that are available in the selected Tables, or Views, or Stored procedure.
- Relationships: The report builder is intelligent enough to find the relationship between the selected times. But if you want to provide the relationship exclusively, then use this pane. To do so, Please select the Edit Fields and select the common filed from both the tables.
- Applied Filters: Use this pane to apply filters at the dataset level. To do so, click on the filter button and add the filter. We already explained the filter concept in Filters article.
Once you finish designing your query (Dataset), click the Save button.
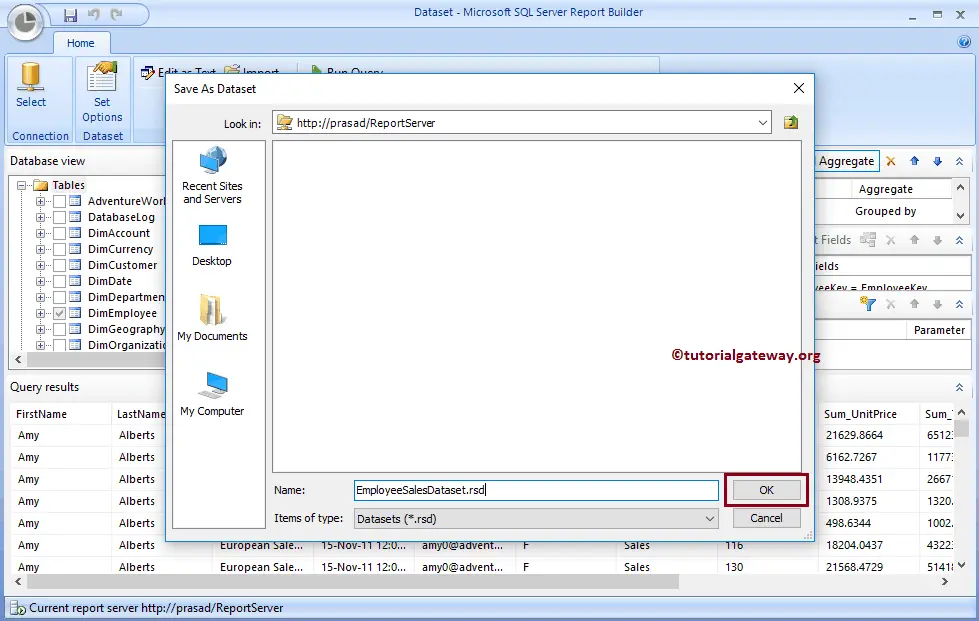
After you click on the Save button, a new window called Save As Dataset will open. Here you have an option to select the local file system or the Report Server. Here, we are choosing the Report Server
Let me open my Report Server to show the newly created DataSet
