Power BI Line Chart

Power BI Line Chart is useful for visualizing Trends over time. For example, you can use a Line graph to create a Sales trend, Temperature Trend, etc. Let me show you how to create a Power BI Line Chart with an example.

For this Power BI Line Chart demonstration, we will use the SQL Data Source we created in our previous article. So, Please refer to Connect to SQL Server and the List of Charts articles to understand the Power BI Data Source.

Create a Line Chart in Power BI

To create a Line Chart, first Drag and Drop the Sales Amount from the Fields section to the Canvas region. It automatically creates a Column Chart.

Bar Graph 1

Next, let me add the State Province Name to the Axis section. You can do this by dragging State Province to the Axis section or check marking the State Province column.

Bar Graph 2

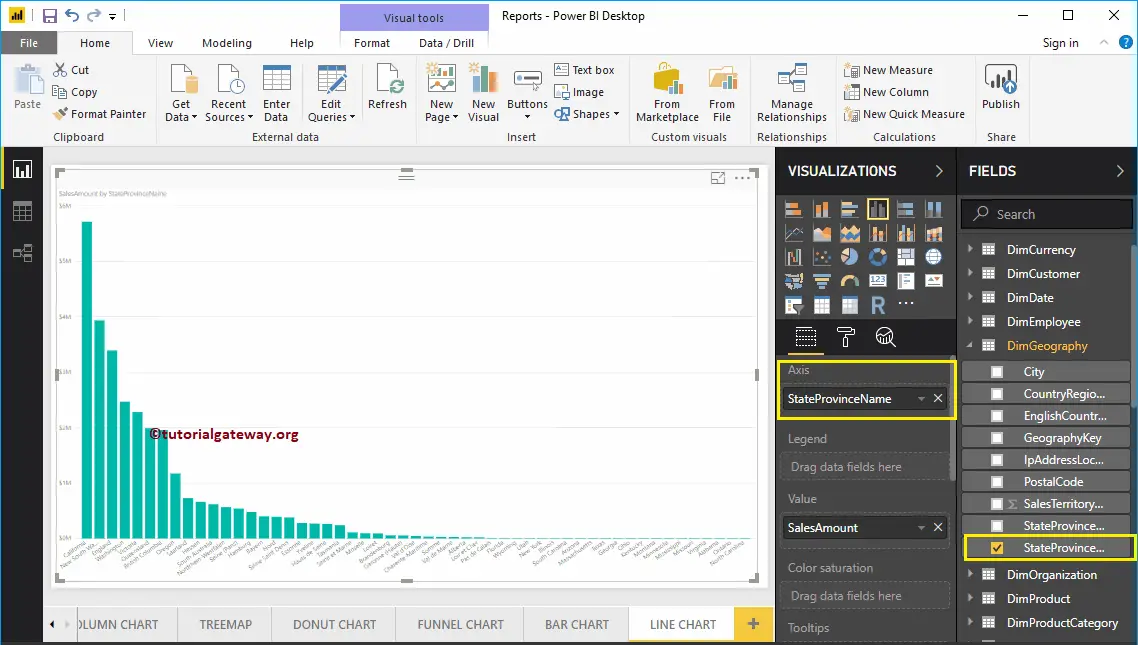
By clicking the shown icon under the Visualization section, Power BI automatically converts the Column into a Line Chart.

From the screenshot below, you can see the Line Chart that shows the Sales Trend by State Province Name.

Create a Power BI Line Chart 3

Create a Power BI Line Chart using Visualization

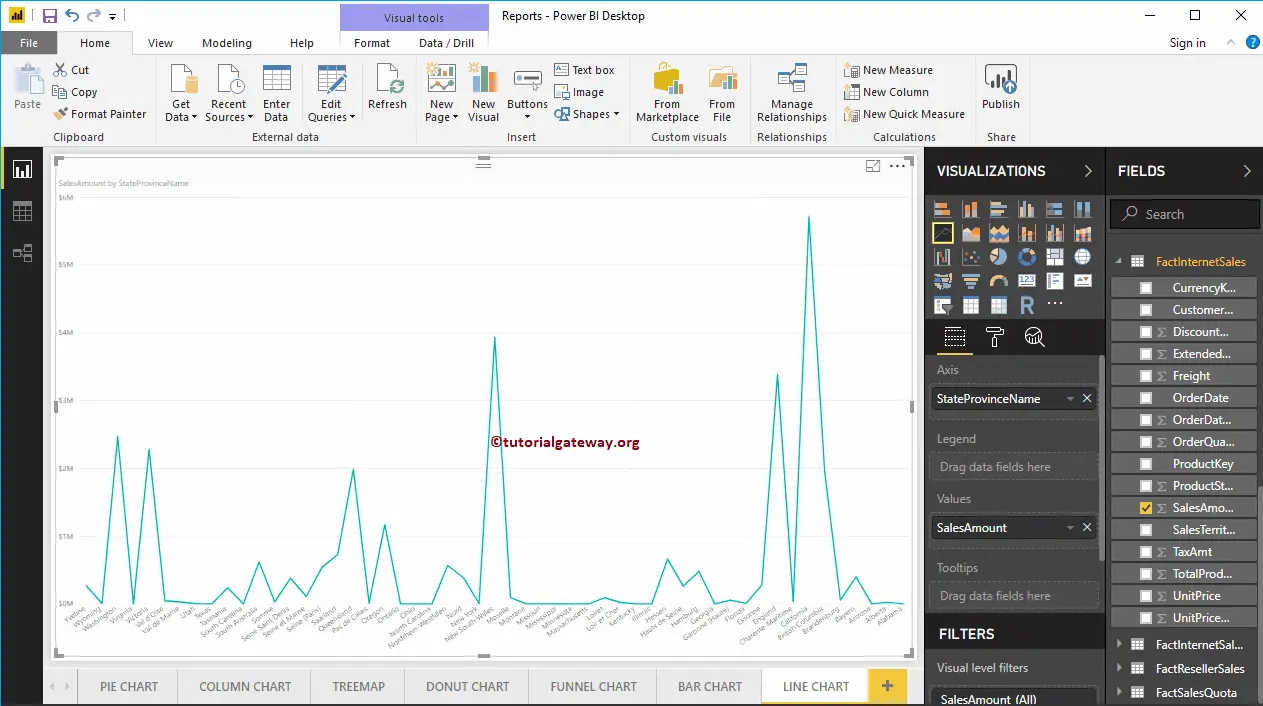
First, click on the Line Chart under the Visualization section, and then Power BI will automatically create it with dummy data.

Default Power BI generated Line Chart

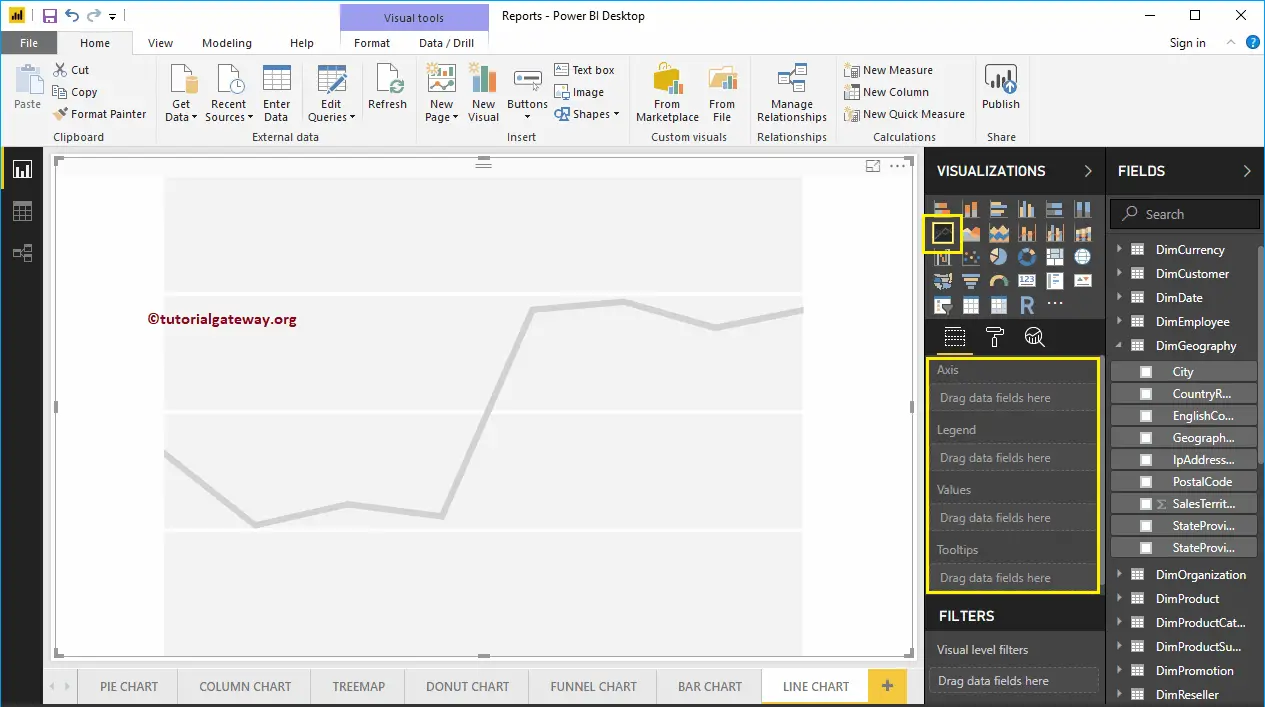
In order to add data to the Line Chart, we have to add the required fields:

  • Axis: Please specify the Column Name that represents the Trend.
  • Values: Any Numeric value such as sales amount, Total Sales, etc.

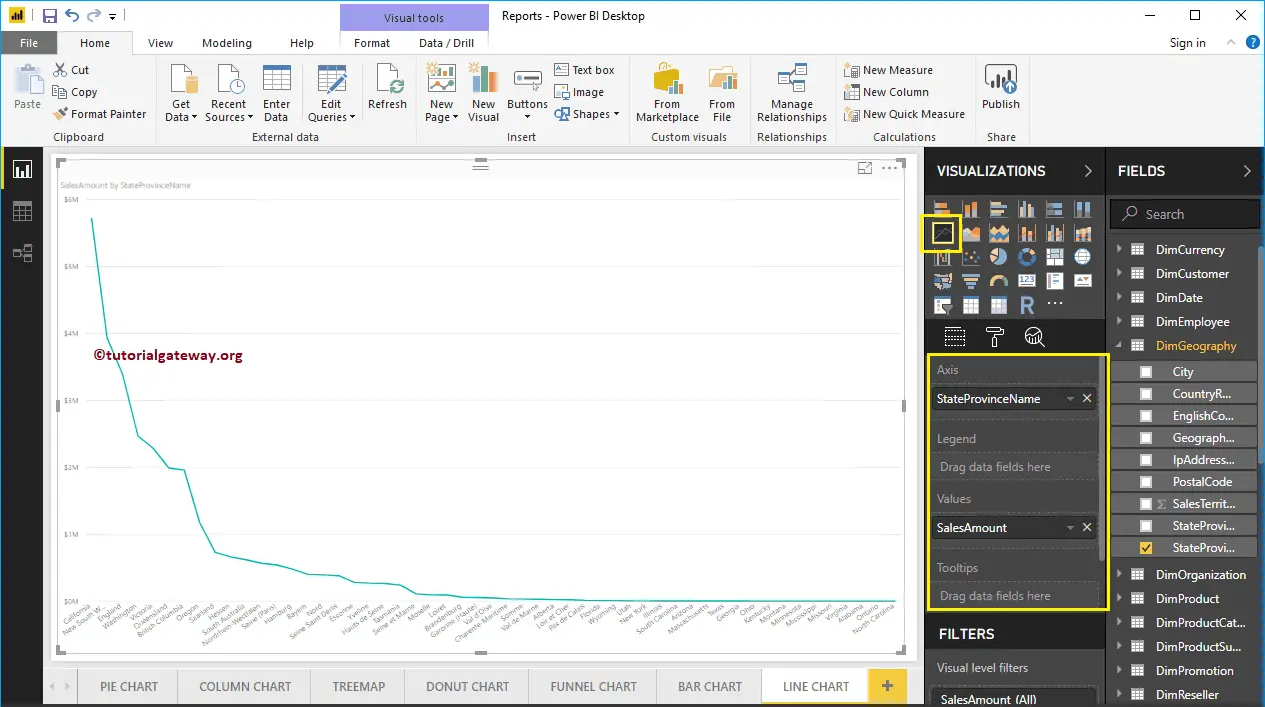
Let me drag the Sales Amount from the Fields section to the Values field and the State Province Name to the Axis section.

Add Sales to Values and State to Axis 5

Let me sort the data by State Province Name (By default, it is sorted by Sales Amount). To do this, click on the … (3 dots) in the top right corner and select the Sort By StateProvinceName option.

Sort by State 6

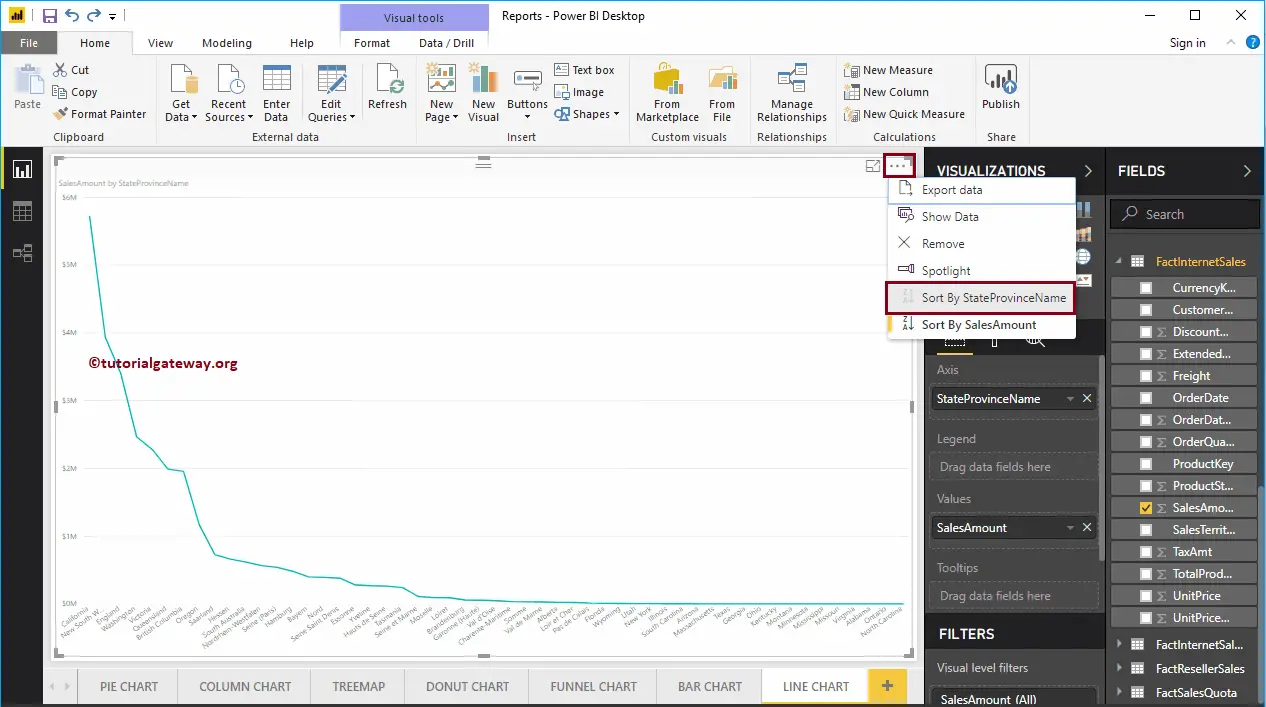
Now you can see the proper Trend in the Power BI line chart.

Power BI Trend Lines 7

Let me add one more field, i.e., the Total Product Cost to Values section. It will compare the trend of the Sales Amount against the Total Product Cost.

Create a Power BI Line Chart or Trend 8

Hovering over any position shows the tool tip of Sales Amount and Total Product Cost.

Tooltip 9

Let me do some quick formatting to this Power BI Line Chart. I suggest you refer to the Format section to understand the steps in formatting these Lines.

Format Power BI Line Chart or Trends 10

Format Power BI Line Chart

How to Format Line Chart in Power BI with an example? Formatting Power BI Line Chart includes changing the Line Colors, Title text, Title position, Axis Details, Data labels, background Images, etc. We use the Line Chart we created earlier to demonstrate these Power BI Line Chart formatting options.

Please click the Format button to see the list of formatting options available for this Line Chart.

Format Line Chart in Power BI 1

Format Line Chart General Settings

Use this General Section to Change the X and Y position, Width, and height of a Line Chart.

Format Line Chart in Power BI 2

Format Legend of a Line Chart in Power BI

To display or enable the Legend, select the Power BI Line chart Legend region and toggle the option from Off to On. Use the Position drop-down box to change the legend position.

As you can see, we added the Legend Title as Money and Legend Position as Top Center. We also changed the Color to Brick Red, the Font family to Georgia, and the text size to 20.

Format Line Chart in Power BI 3

Format X-Axis of a Line Chart in Power BI

The following options are available for you to format the Horizontal axis or X-axis. As you can see from the screenshot below, we changed the Color to Dark Grey, the Font style to Candara, and the Text Size to 12.

Format X-Axis 4

By default, the X-Axis title is set to Off, but you can enable it by toggling Title to On. Let me change the Title Color to Green, the Font style to Georgia, and the Font Size to 20.

Format Line Chart in Power BI 5

Format Y-Axis of a Power BI Line Chart

The following is the list of options available for you to format the Vertical axis or Y-axis. From the screenshot below, you can see we change the Y-Axis label’s Color to Dark Grey, Text Size to 15, and the Font style to Candara.

Format Y-Axis 6

Let me change the Scale type to Log. From the screenshot below, you can see that it is displaying the Log scale.

Format Line Chart in Power BI 7

By default, the Y-Axis title is set to Off, but you can enable it by toggling Title under the Y-Axis section to On. Let me change the Title Color to Green, the Title Text Size to 20, and the Font family corbel.

By toggling the Gridlines option from On to Off, you can disable the Line Chart Gridlines.

  • Color: You can change the Gridlines color.
  • Stroke Width: Use this to change the Gridlines width. Here, we changed the width from default 1 to 2 strokes.
  • Line Style: Choose a line style such as Solid, dotted, or dashed.
Format Line Chart in Power BI 8

Format Power BI Line Chart Data Colors

By default, the Line chart will display with default colors. Let me change the Sales Amount Line color to Brick Red and the Total Product Cost color to Green.

Format Data Colors 9

Format Data Labels of a Line Chart in Power BI

Data Labels display the Metric or Value information (Sales Amount at each point) about the Line. You don’t require Data Labels for the Trends, but you have an option.

As you can see from the below screenshot, we enabled it to display the properties.

Format Line Chart in Power BI 10

Format Line Chart in Power BI Shapes

Use this section to change the Line Strokes or joining. As you see below, we changed the Stroke Width (Line width) to 4, the marker Shape (Shape at the joining Point) to Diamond, and the Marker size to 8.

Format Line Chart in Power BI 11

Whatever changes you make in the above step reflect on both Lines. But, you have an option called Customize Series, and if you enable this option, you can customize individual Lines.

Change Markers Color 12

Format Line Chart Plot Area

Using this Plot Area section, you can add Images as the Background of a Line Chart. For the demonstration purpose, we added one image as the Plot Area Background.

Change the Plot Area 13

Format Power BI Line Chart Title

By toggling the Title option from On to Off, you can disable the title of a Line Chart.

As you can see from the below screenshot, we changed the Title Text to Sale Amount and Total Product Cost by State Province Name. Next, we also changed the Font Color to Green, Font Family to Georgia, Font Size to 20, and the Title Alignment to center. You can add the background Color to the title if you want.

Format Line Chart in Power BI 14

Format Background Color, and Border of a Line Chart

You can add the Background color to a Line Chart by toggling the Background option to On. You can add Borders to a Line Chart by toggling the Border option from Off to On.

Format Line Chart in Power BI 15

FAQ’s

How do you make a line graph in Power BI?

Under the Visualization section, Selecting the Line Chart icon will generate a dummy one. Next, add dates or text fields to the X-axis and Numeric measures to the Y-axis.

Why line chart is used in Power BI?

Line charts, also known as the trends that visually represent the data changes over a period of time. For instance, sales trends in an interval, profits over the years, etc.

How do you show multiple lines on a Power BI line graph?

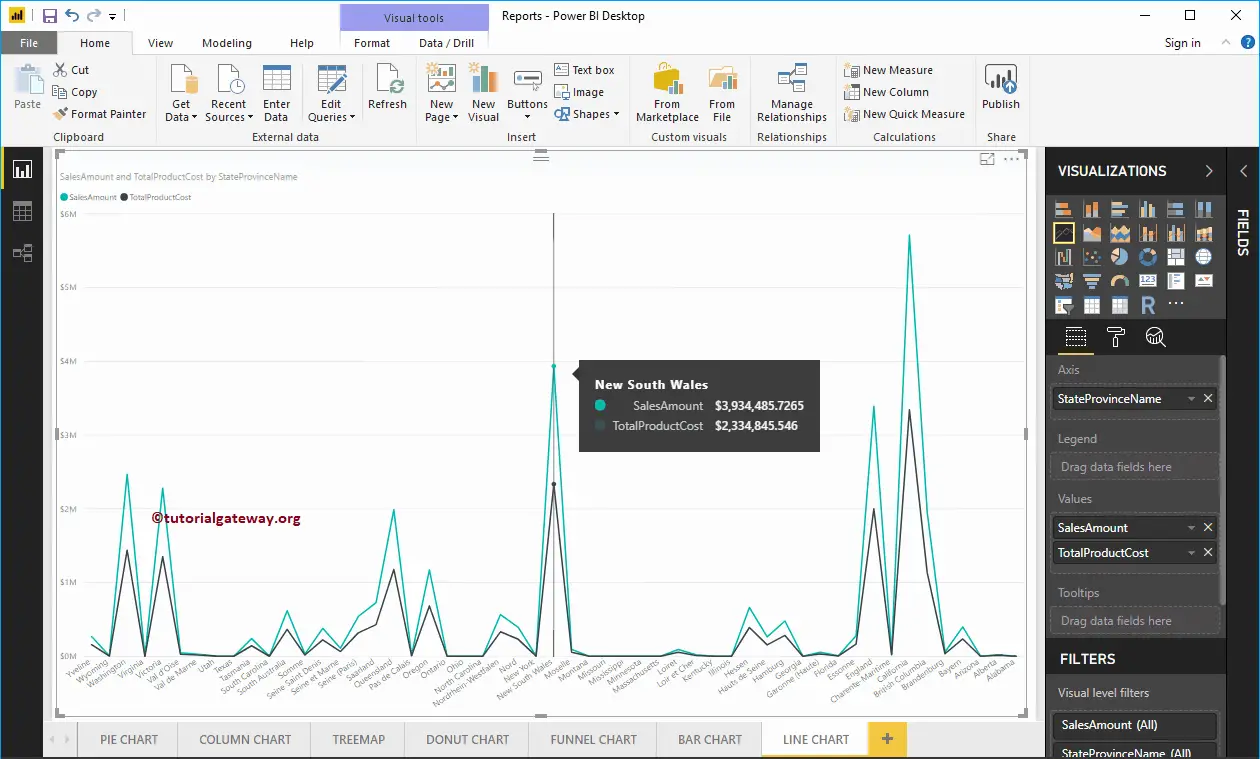
There are two ways to show multiple lines. The first one is adding multiple numeric measure values to the Y-axis section. The second approach is adding a dimension (text) field to the legend.
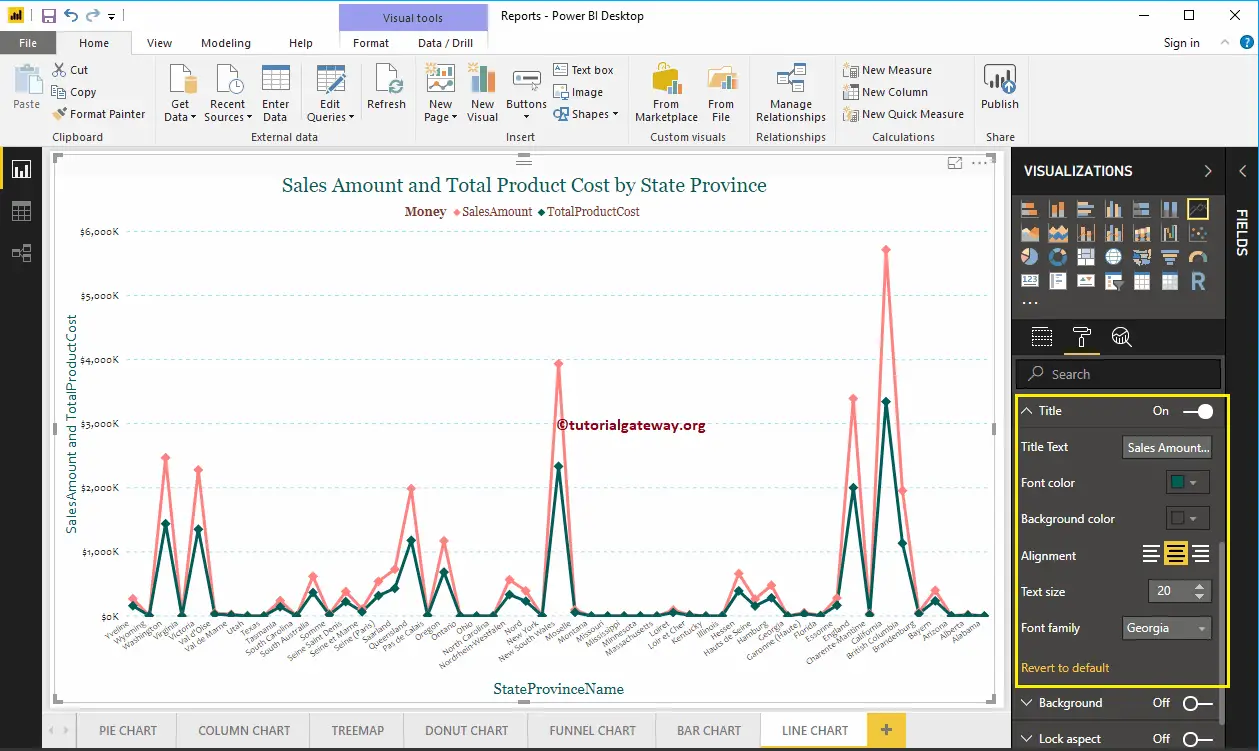
How do you add a linear line in Power BI?

Use the analytics pane to add the trend lines, constant, min, max, average, median, and percentile lines.