This article explains how to create a basic sales report in Tableau to understand the company sales by state/province and the financial years with an example.
To demonstrate the steps involved in creating a basic sales report in Tableau, we used the AdventureWorksDW database. Please visit the SQL Source and SQL Tutorial article to understand the Data Source.
How to Create a Basic Sales Report in Tableau?
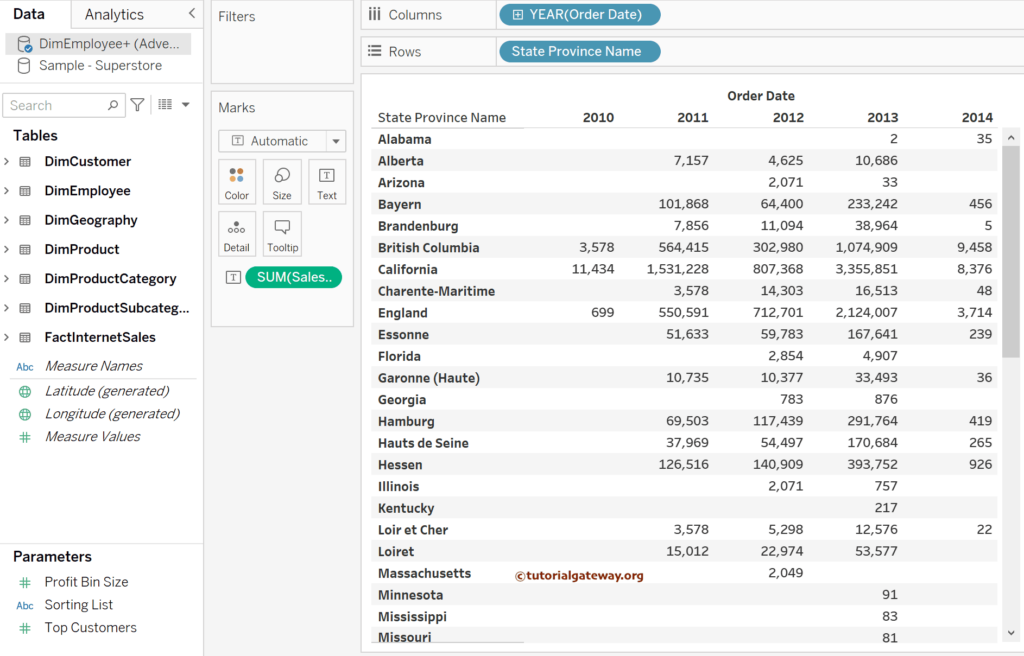
Drag and drop the State Province Name dimension to the Rows Shelf and Order Date to the Columns shelf. By default, it selects the year, and we need the sales for these years state-wise. So, double-click the Sales Amount Measure, which will be added to the Text shelf.
Please add the English Country Region Name to the Color shelf to add colors to the sales values. For the remaining charts in Tableau, please click here.
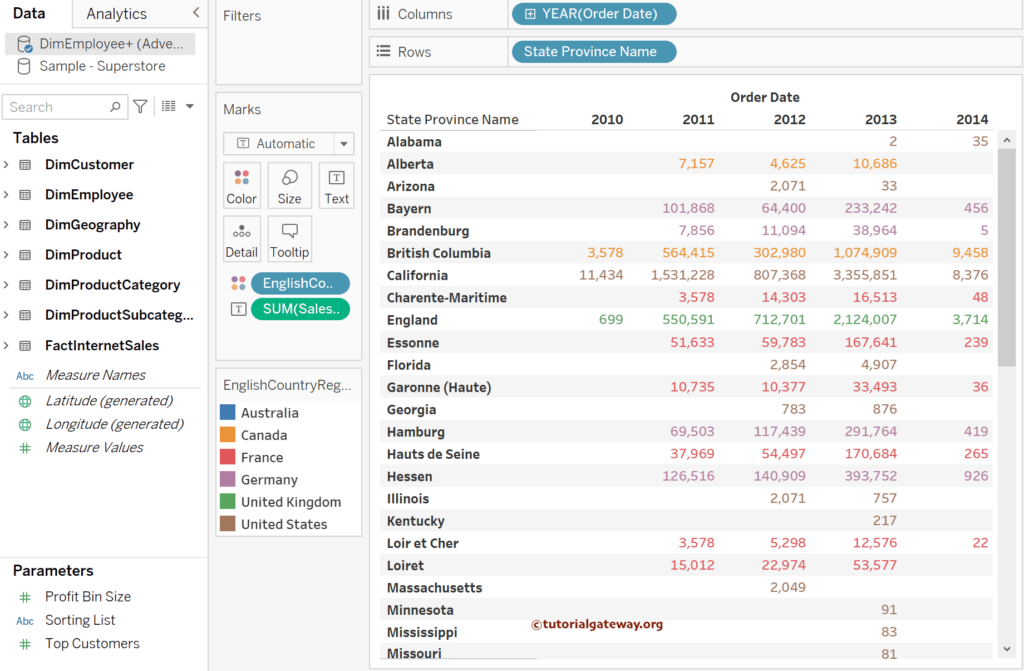
The above Tableau screenshot shows the newly created basic sales report. However, we want the user to perform some operations, such as selecting a particular country’s sales. To do so, we need a parameter. So, right-click the space below the # Measure Values and choose the Create Parameter option from the context menu.
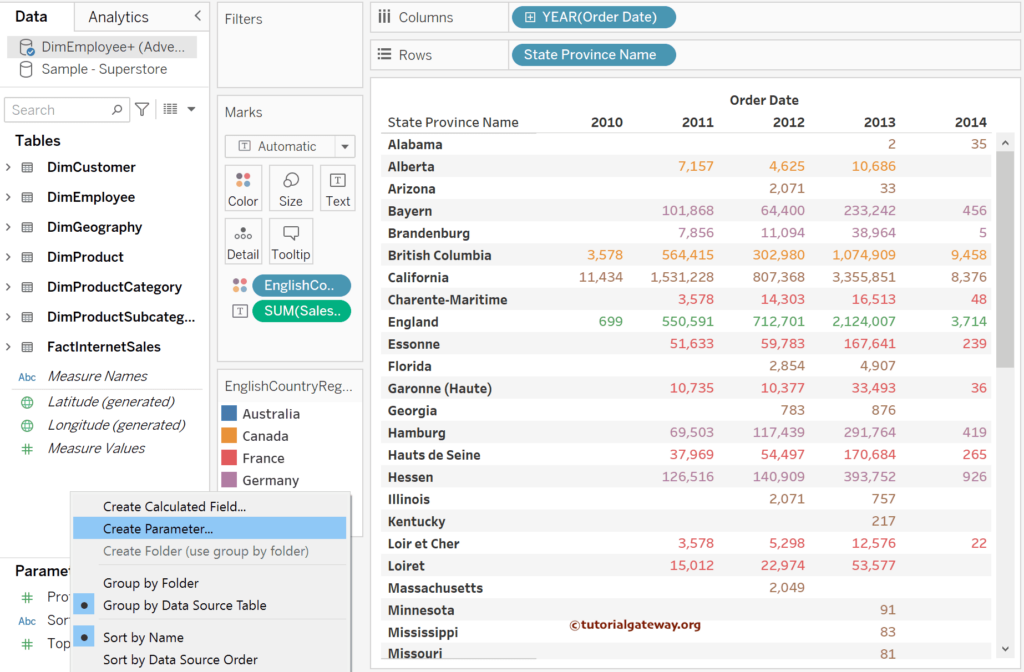
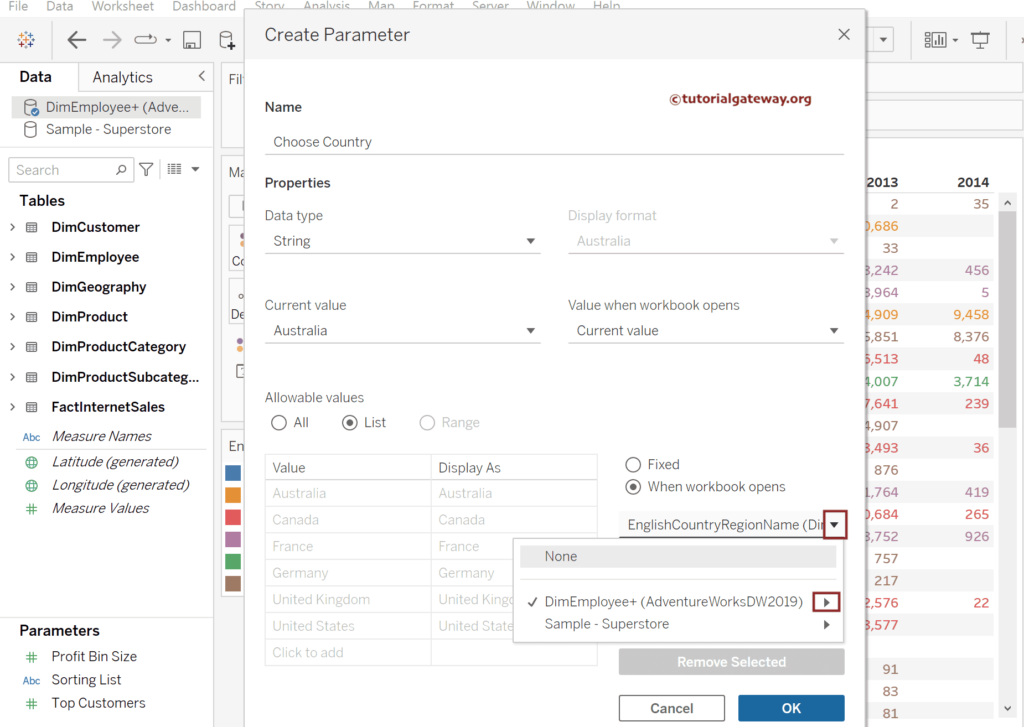
It opens the below shown window. Please change the Data type to string and set the Allowable values to List. Instead of manually typing the items, we chose the English Country Region Name field from Adventure Works DW 2019. To get the same, click the down arrow beside the Add value from the button, choose the Data Source, and then select the Field name.
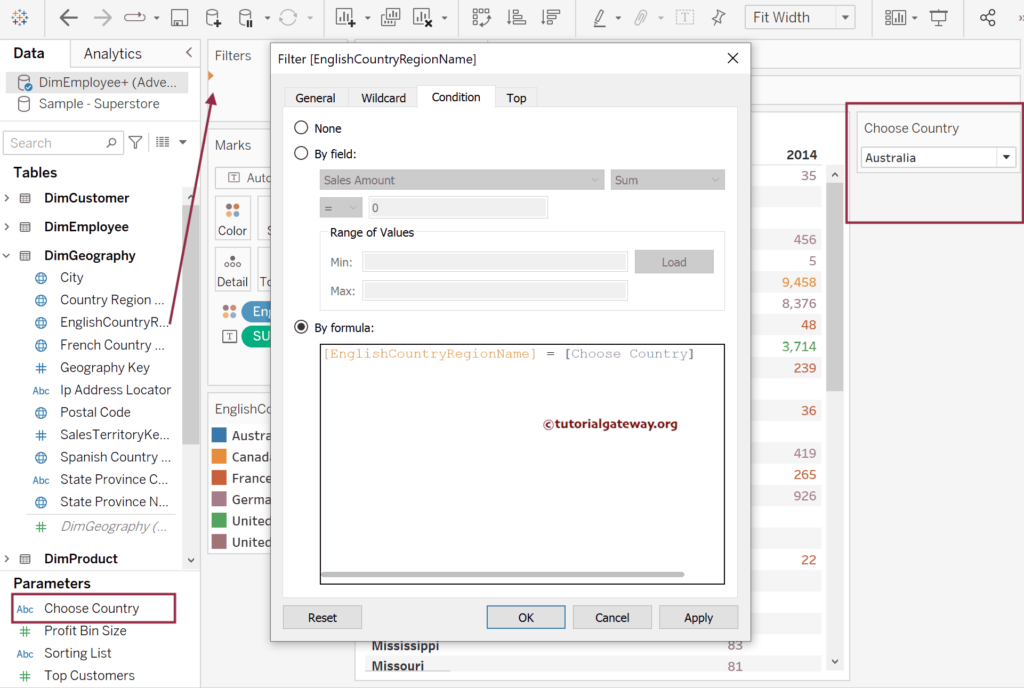
First, click the down arrow beside the newly created parameter and choose the Show parameter option. Next, drag and drop the English Country Region Name to the Filter shelf, which will open the following window. To utilize this string parameter in the Table report, go to the Condition tab and write the below expression.
[EnglishCountryRegionName] = [Choose Country]
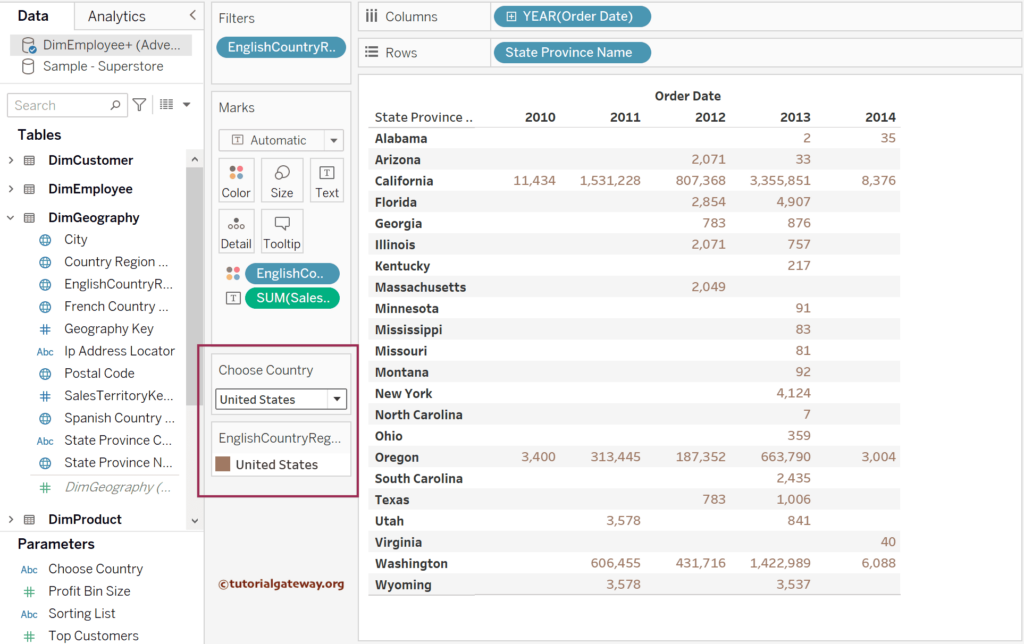
This newly created basic Tableau Table report will return the state-wise sales belonging to the user-selected country. Let me select the United States and see the states that belong to the USA and its sales by the years 2010, 2011, 2012, 2013, and 2014.
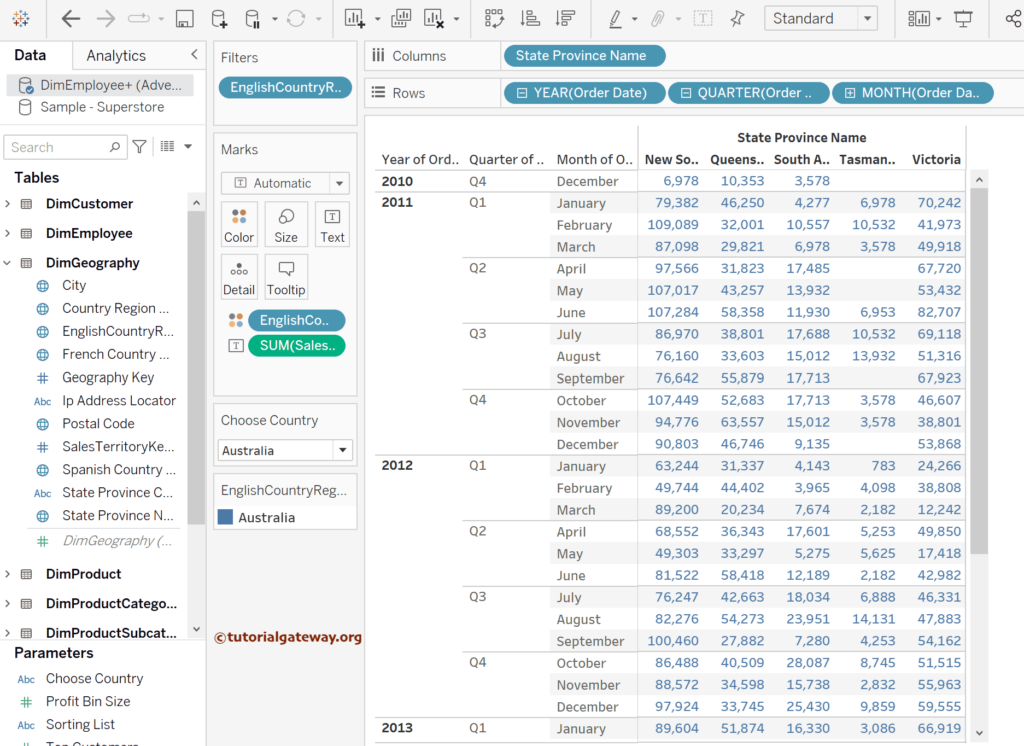
Let me expand the Order Date hierarchy to the Month level to see the sales by Year, Quarter, and Month in Australia.
