Tableau Word Cloud is useful for visualizing text data where the size of each word is proportional to its frequency. For example, suppose you are looking for Top trending Hashtags on Twitter, the most commonly used Tags on a Website, or any other CMS. In that case, you will see a few names with a brighter color, some with a light color, and there will be a significant change in Font Size. It is possible by using the Word Cloud.
In real-time, if you want to transform unstructured text data into a meaningful visualization that helps the end users understand the patterns, you can use the Tableau Word Cloud. It displays the most frequently occurring words in larger and bolder fonts, while less common words are in smaller fonts. This article will show you how to create a Word Cloud, and for this demo, we write SQL Adventures Works DW data source.
How to create a Word Cloud in Tableau?
This kind of chart is typically used to depict keyword metadata tags. In this example, we create a Word Cloud for the State dimension against the Sales Amount size. The desktop provides a native feature to create this kind of chart.
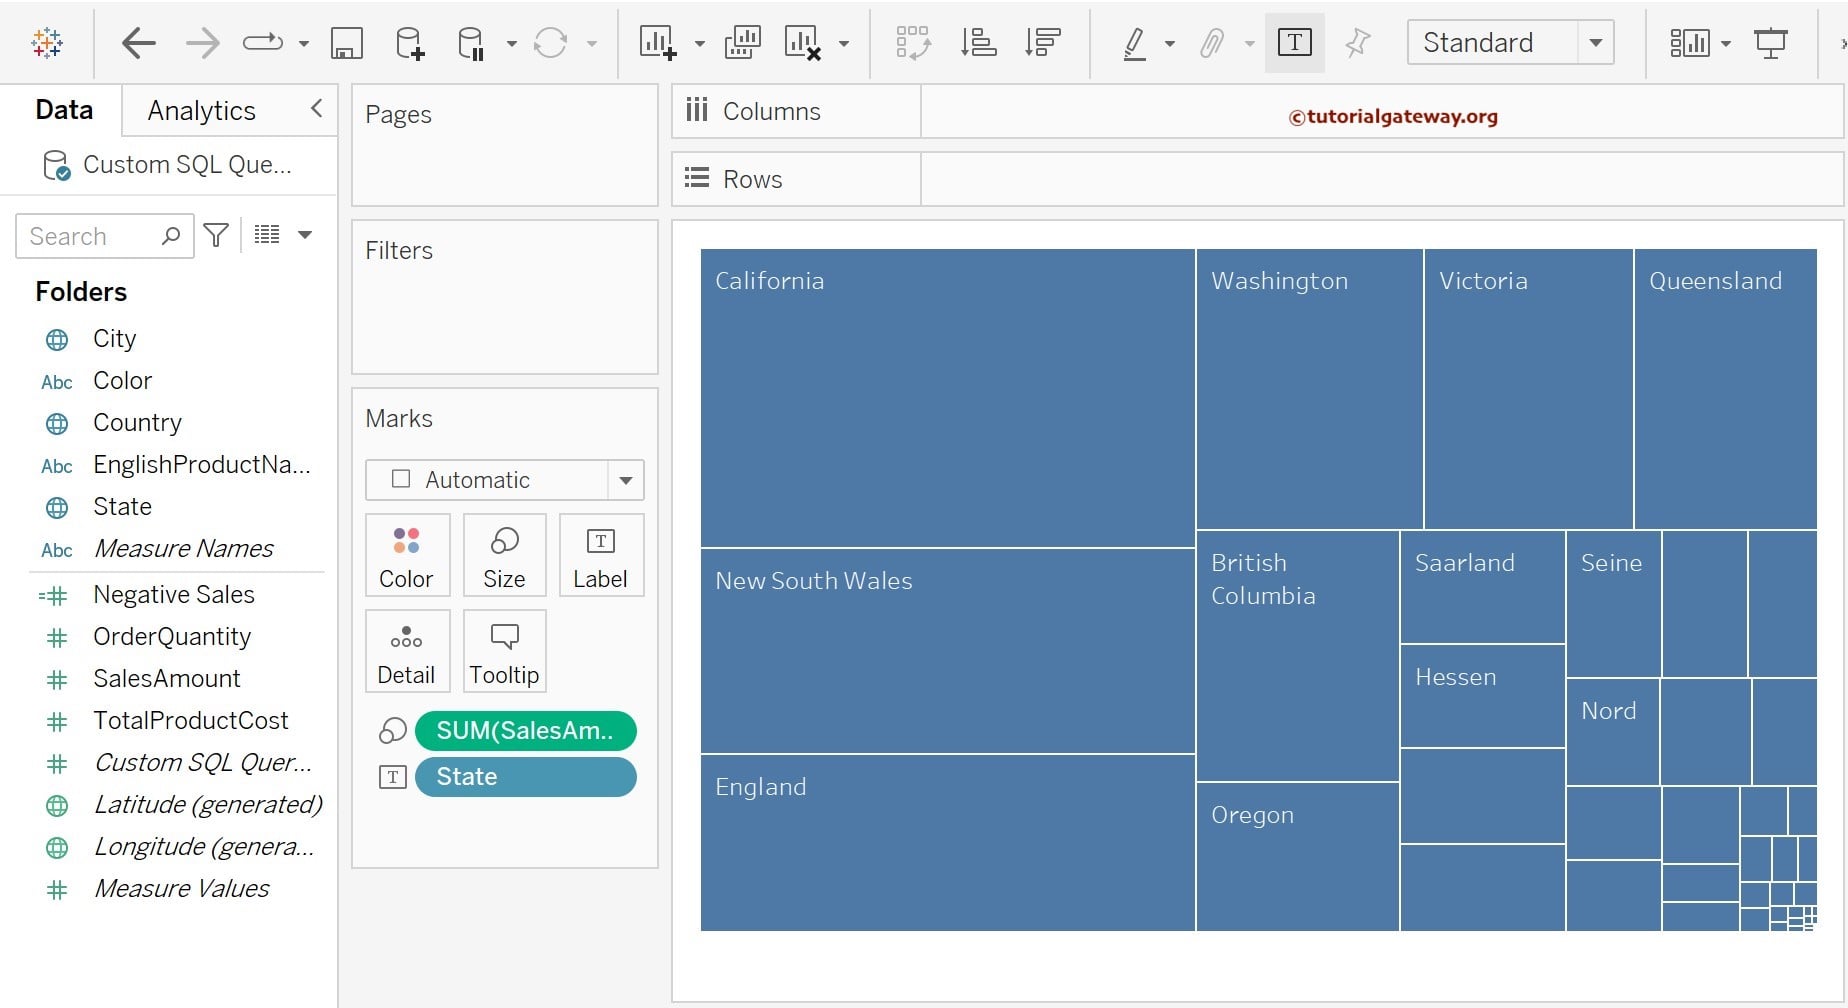
To create a Tableau Word Cloud, we must add fields to the Text and Size Shelf. So, drag and drop the State (Words) from the Dimension Region to the Text Field in the Marks card to see the available State names in this report. Next, drop the Sales Amount from the Measures Region to the Size Field in the Marks card.
Once the Sales Amount is added to the Size shelf, the Tableau Desktop displays TreeMap by default. For more Charts, Click Here.
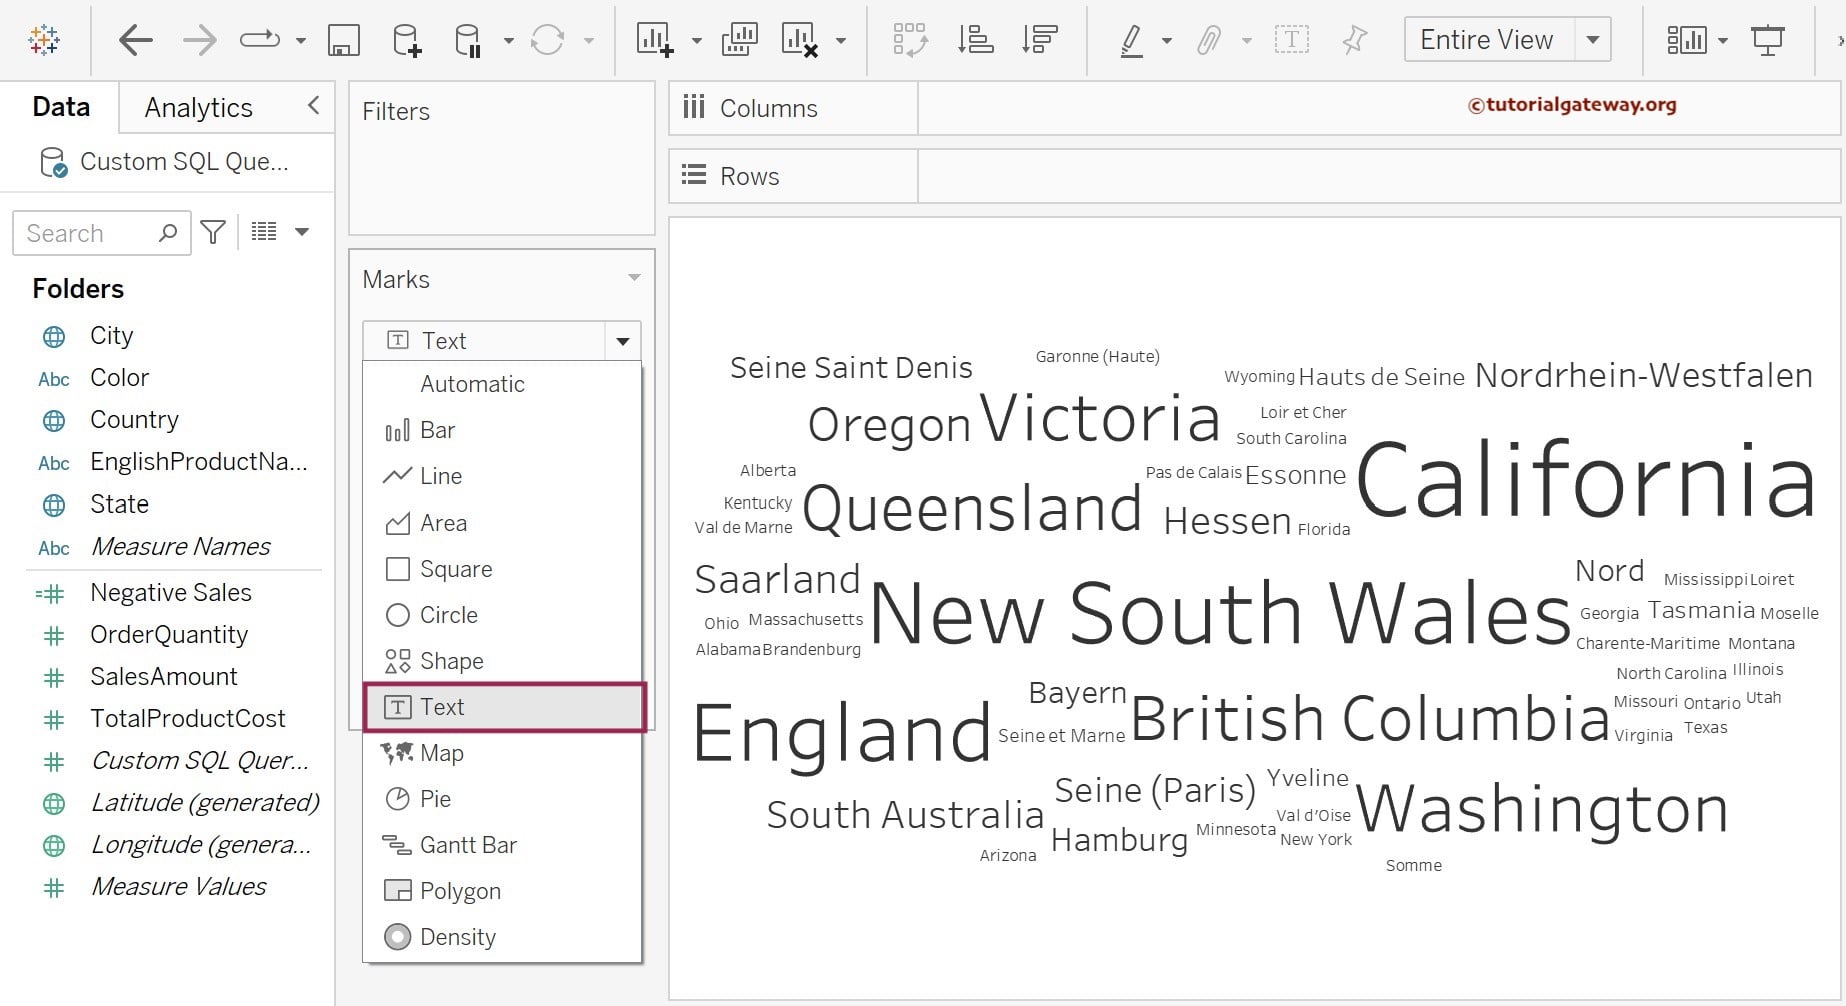
3rd Step: To change or convert the Default TreeMap to Word Cloud, we have to change the default Automatic option on the Marks card. Please expand the drop-down list and change the mark type from Automatic to Text.
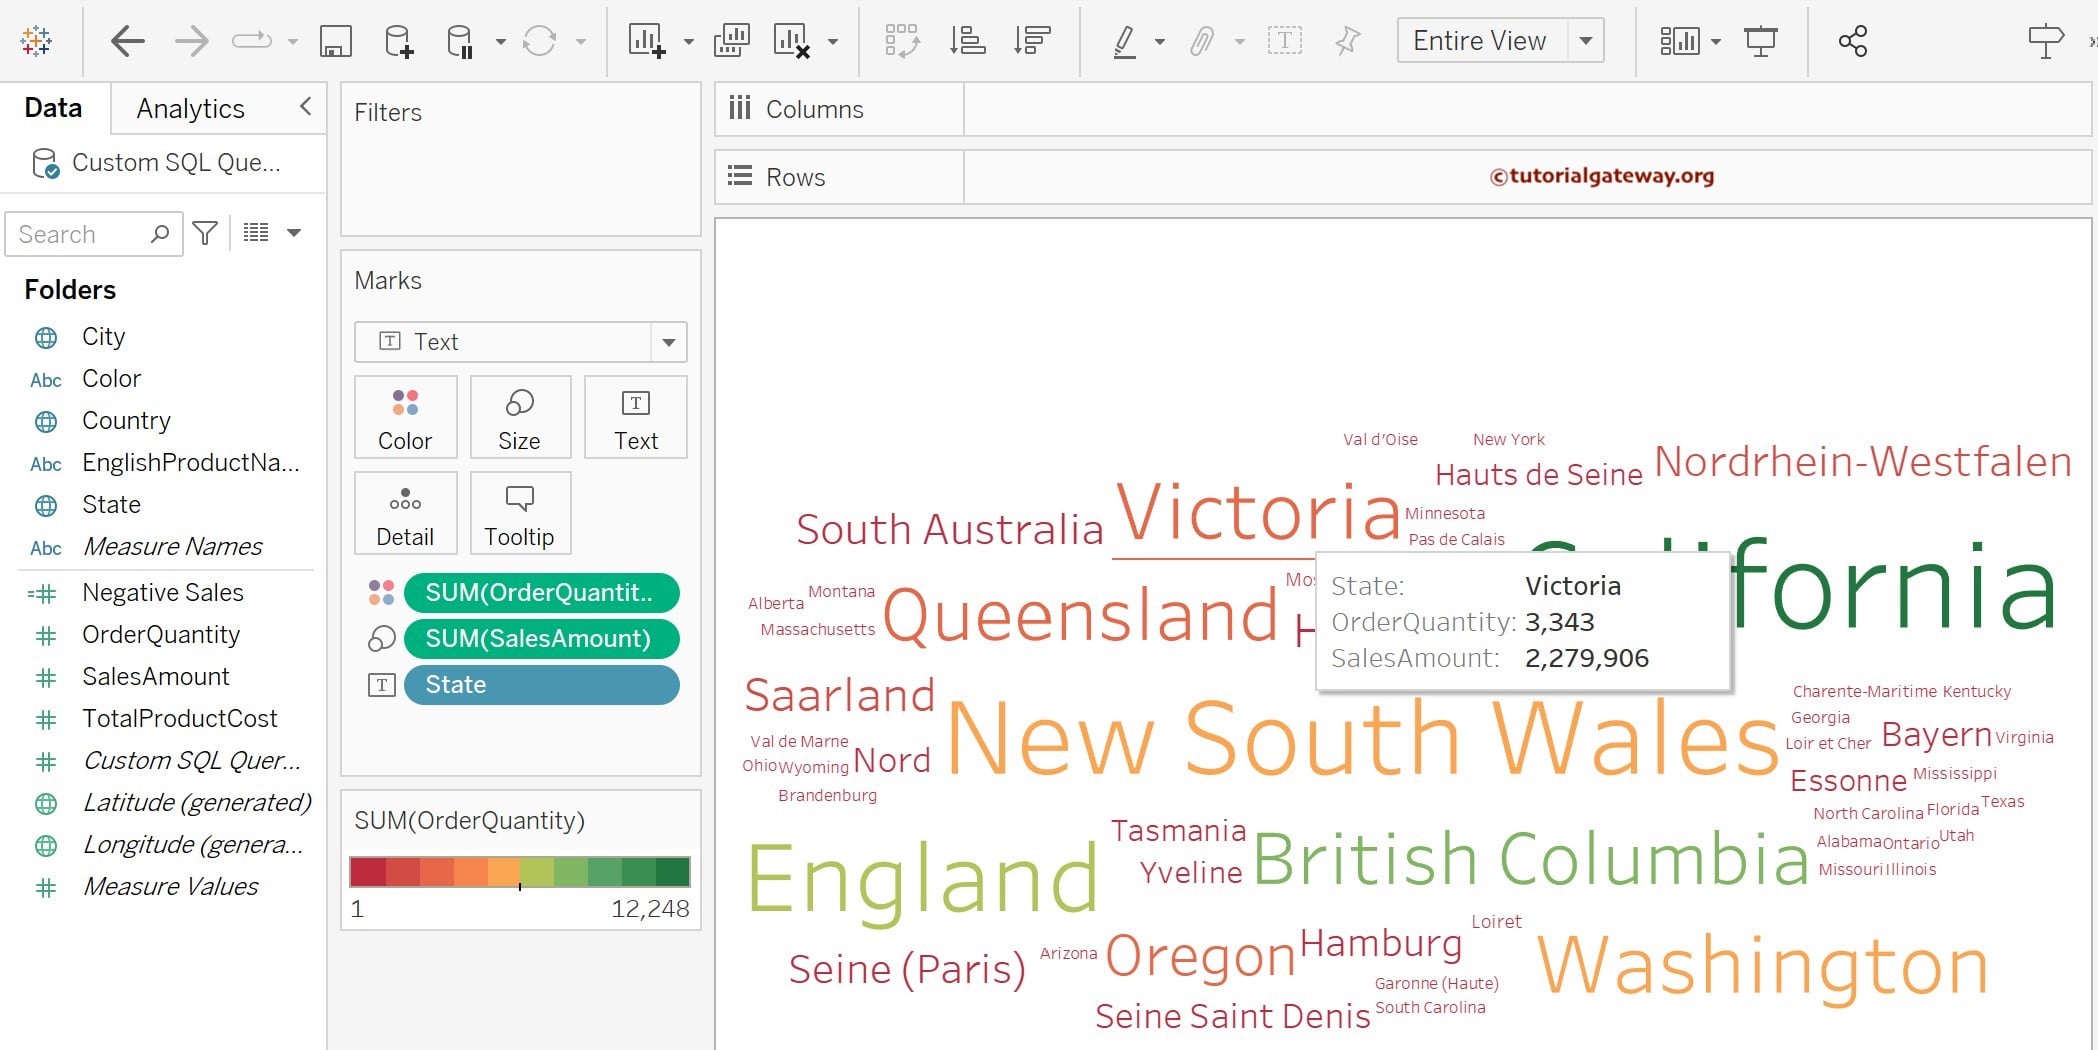
Once you change it, Word Cloud displays State Name as the Text field and Sum of Sales Amount as the text size. See that the Font Size of California State is bigger than the remaining states because the Sales Amount is higher than in other states.
Add Colors to Tableau Word Cloud
Let us add color to the Word Cloud. We can do this by dragging the Sales Amount to the Colors field in the Marks card.
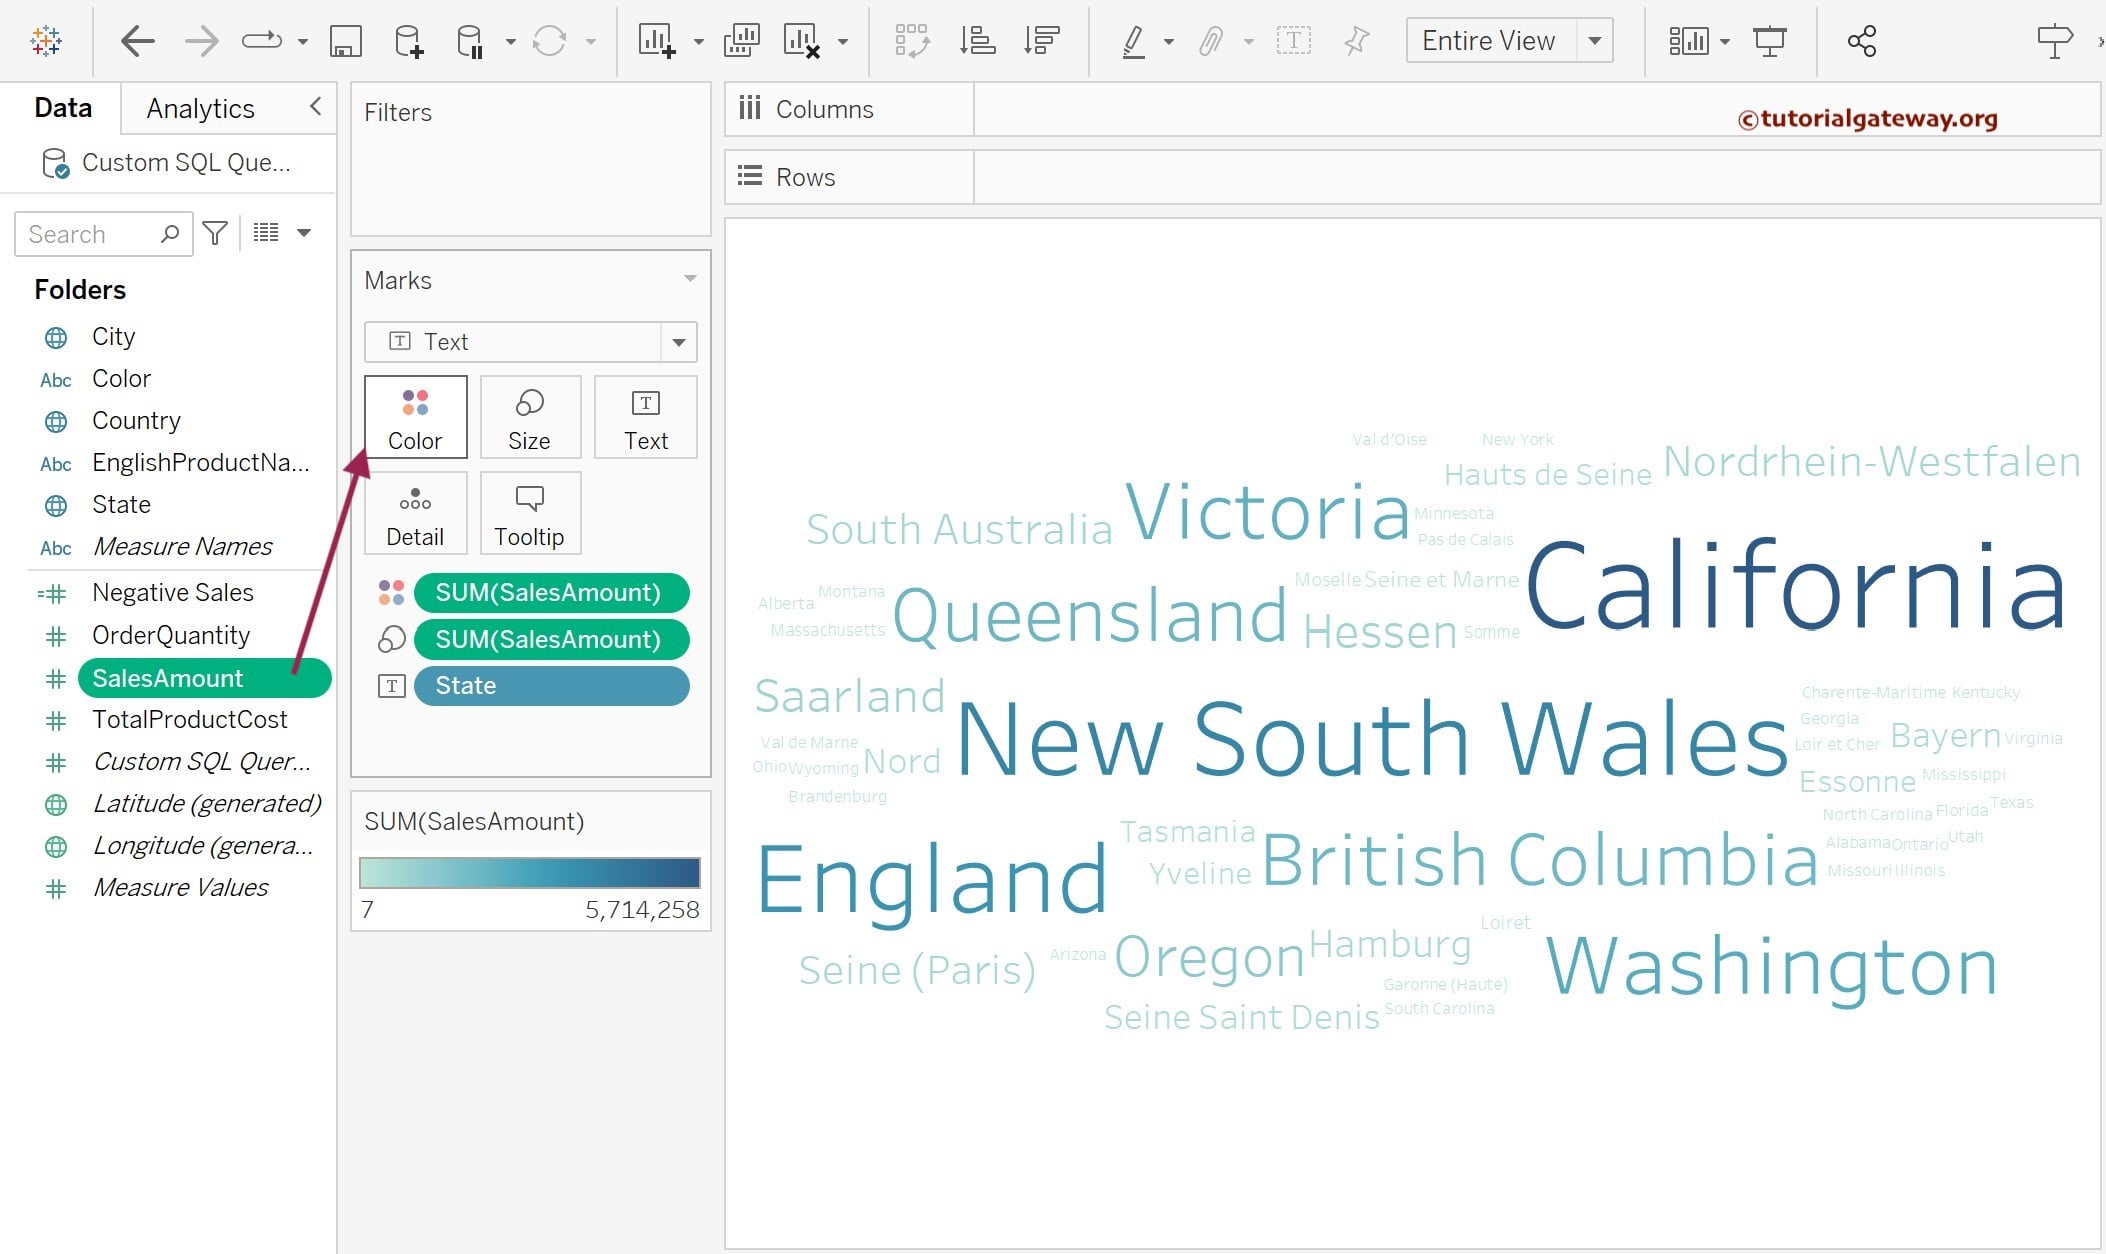
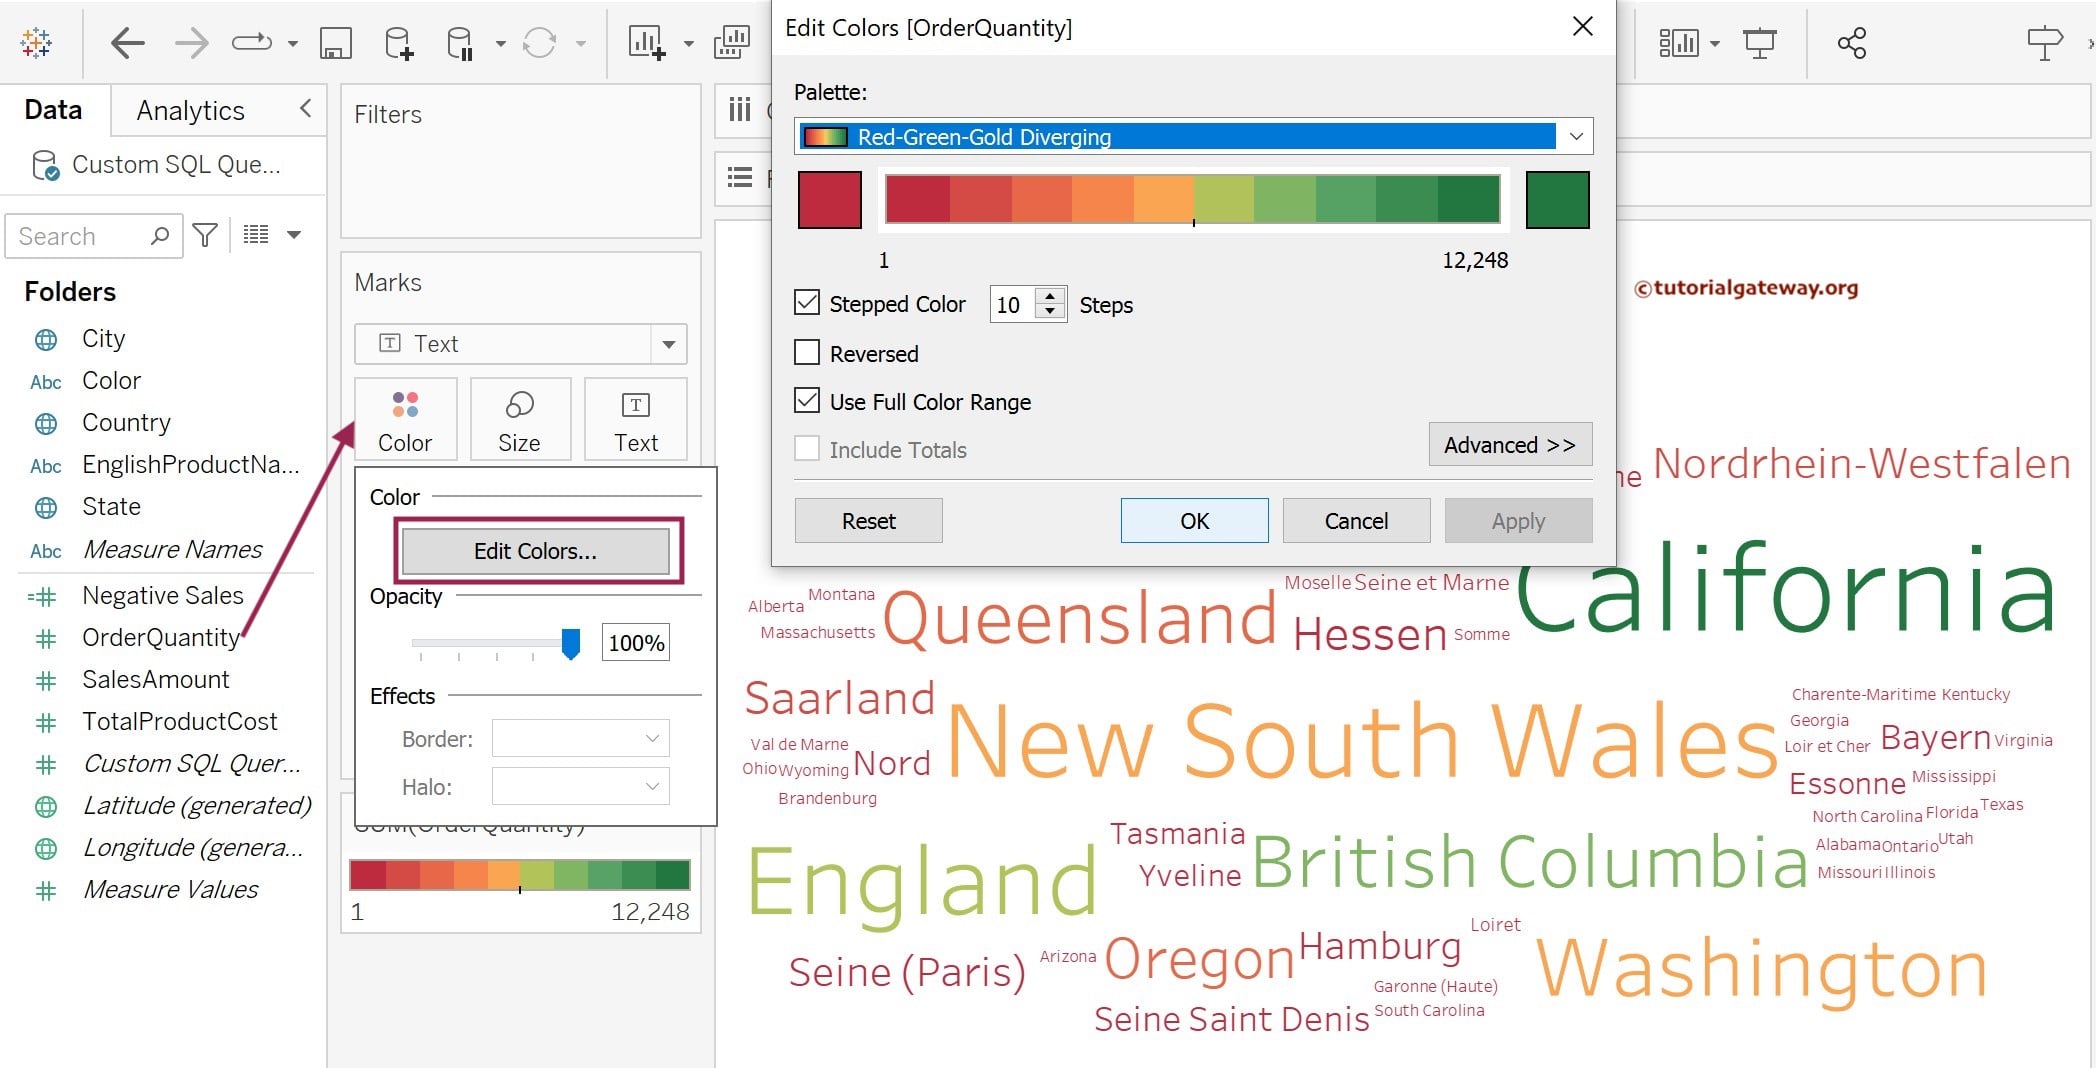
To change the Word Cloud Colors, we replaced the Sales Amount in the Color shelf with the Sum of the Order Quantity. Now, Tableau Word Cloud will display the state names with the highest orders filled with Dark Blue and the Least orders in light blue. Next, click the Color shelf and press the Edit Colors.. button to change the Word Cloud colors. Here, we have chosen the Red-Green-Gold Diverging color with 10 steps.
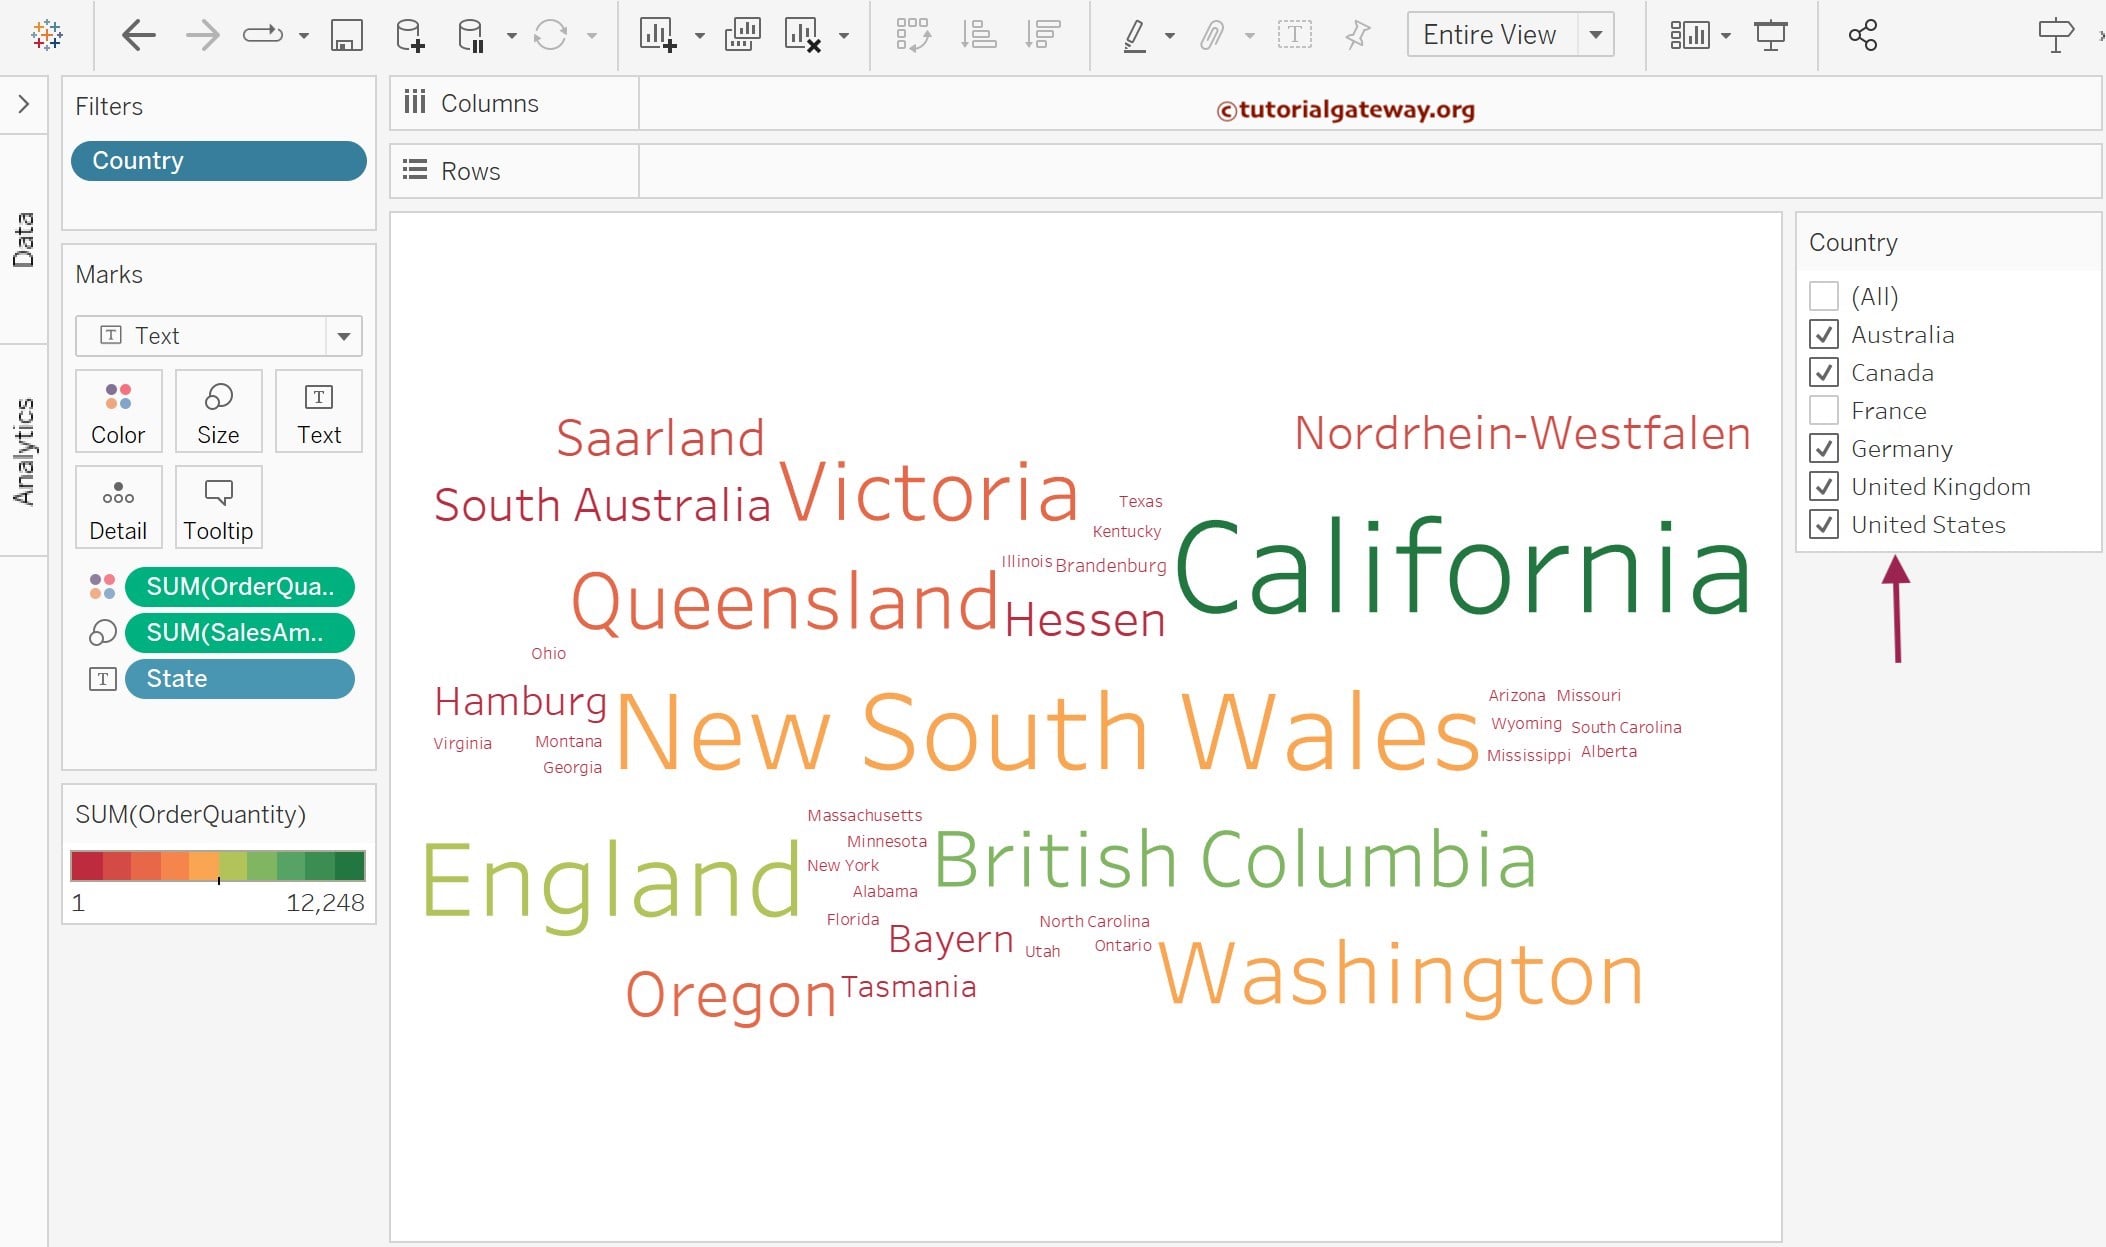
After the completion, the screenshot below will display the Final Word Cloud Preview. The frequency of the State names with Maximum orders filled in Dark Green and Least orders in red.
How to Add Filters to Tableau Word Cloud?
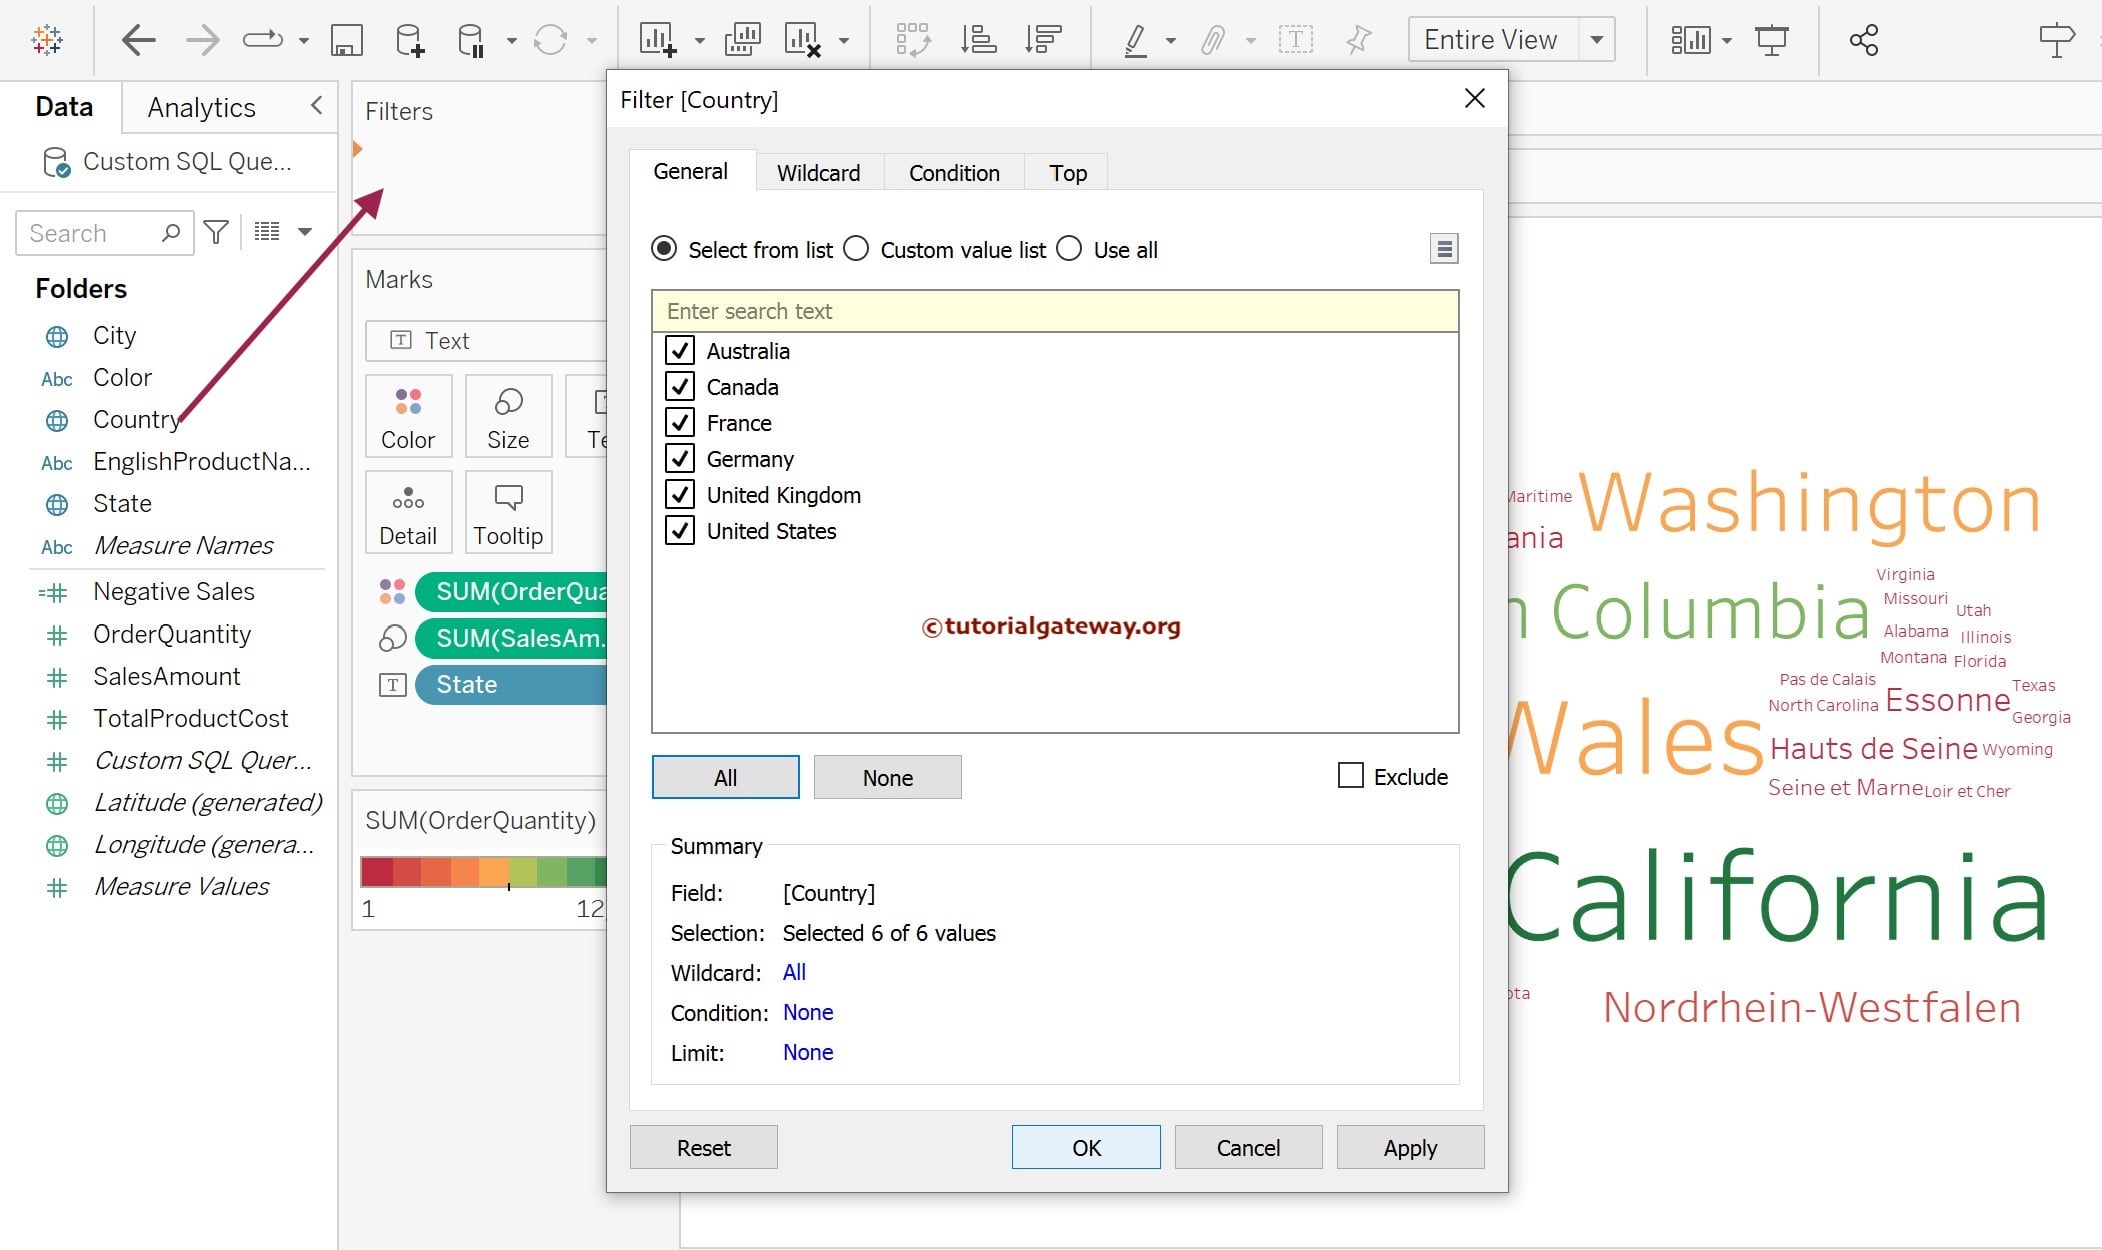
Apart from creating a static word cloud report, you can add interactivity by adding filters. Drag and drop the Country Dimension to the Filters shelf, which will open the following window. To demonstrate, let me select All and click the OK button to add Measure Filter from the list.
Next, you have to click the down arrow beside the Country and select the Show Filter option to display the list of available fields on the right side of the chart.
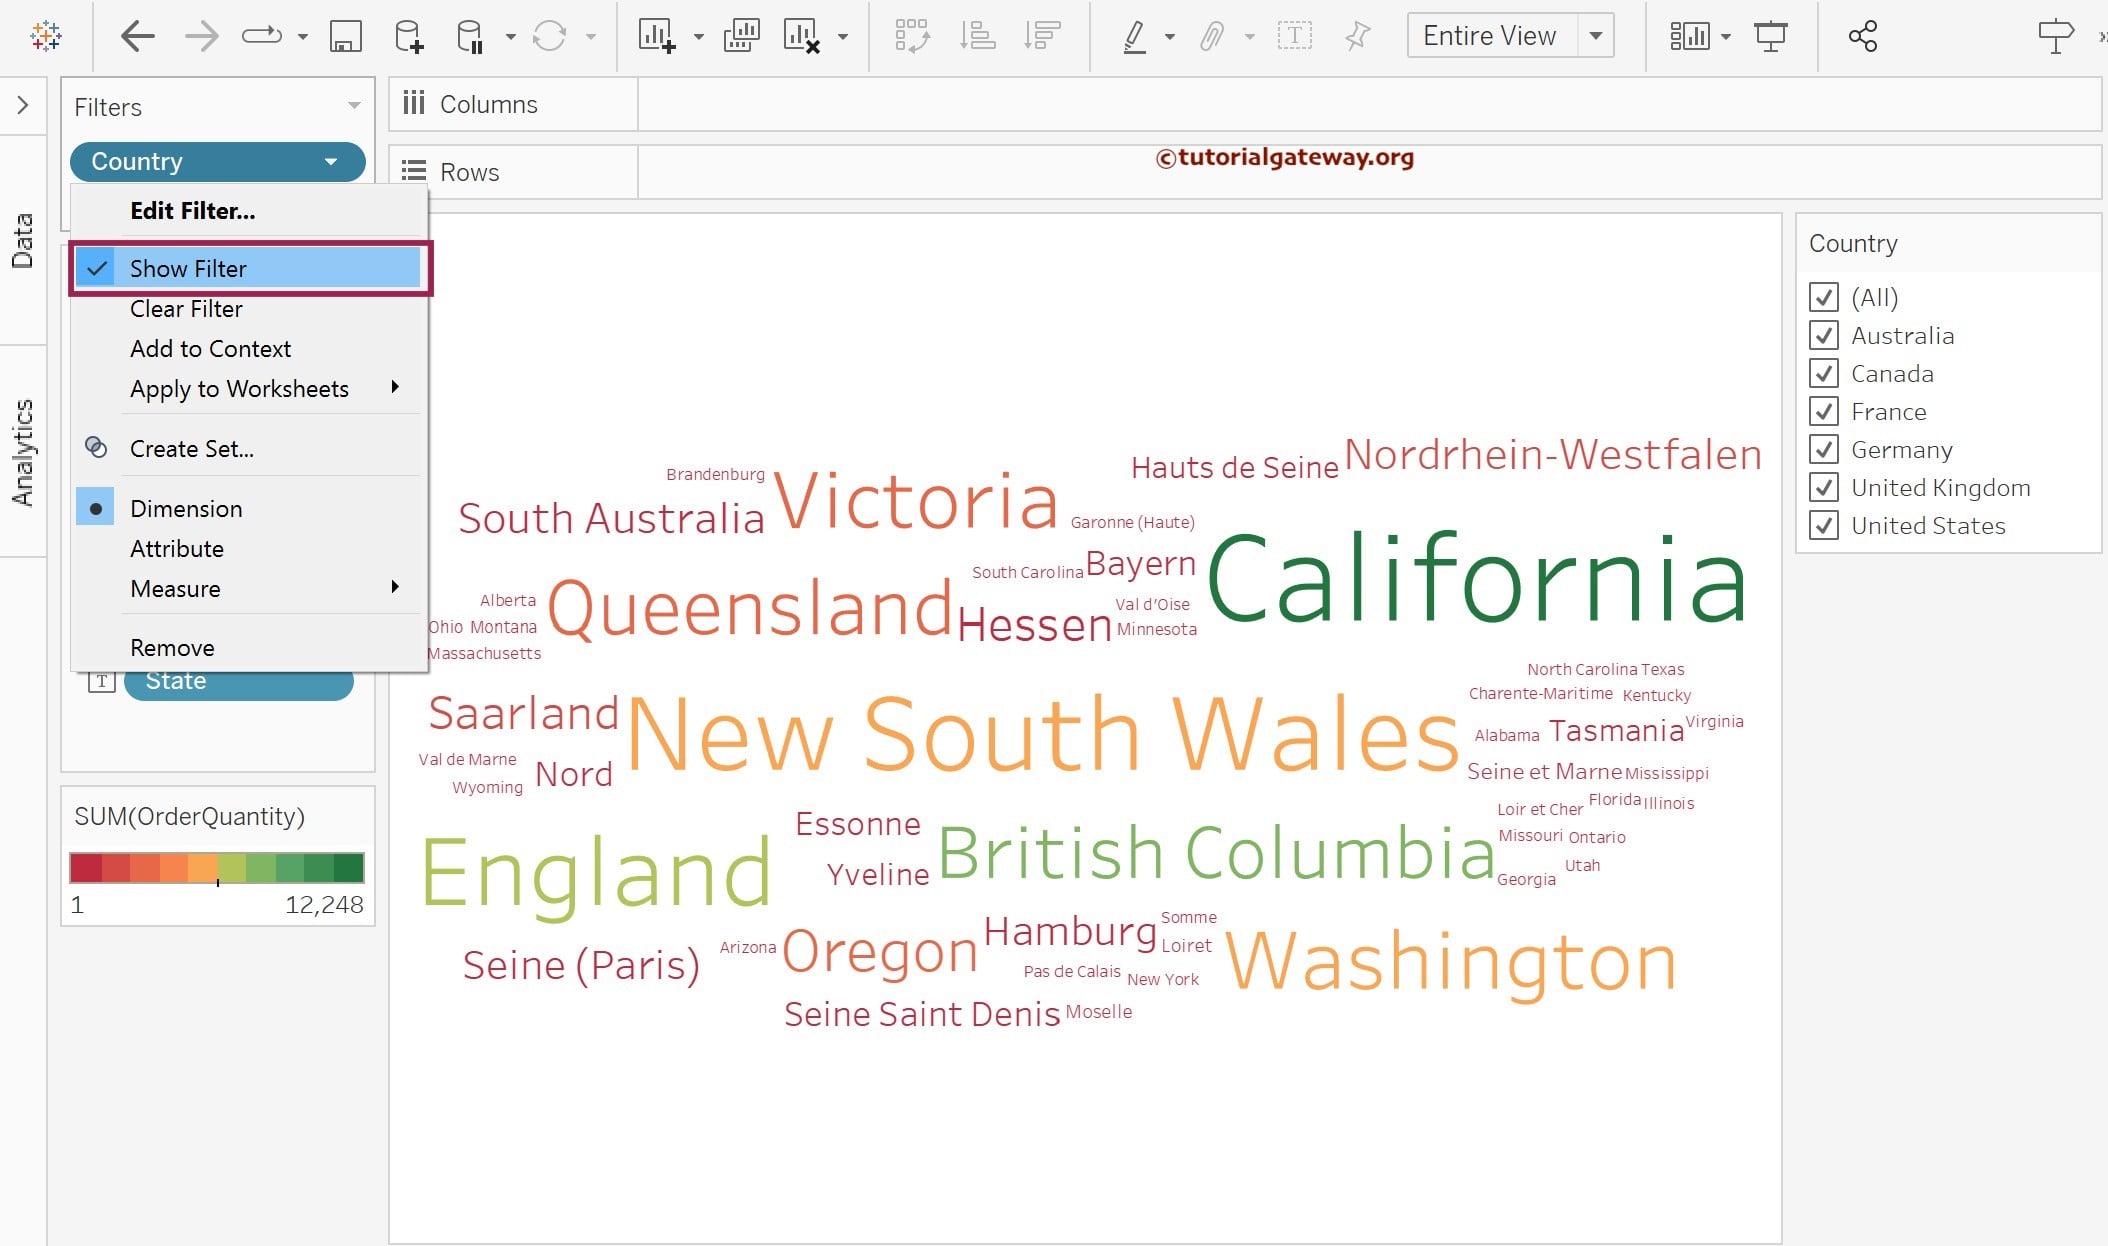
You can select or deselect the required Country names, which will replicate in the Tableau Word Cloud. The following screenshot shows the state-wise sales of Australia, Canada, Germany, the United States, and the United Kingdom. You can experiment by unchecking a few more countries.