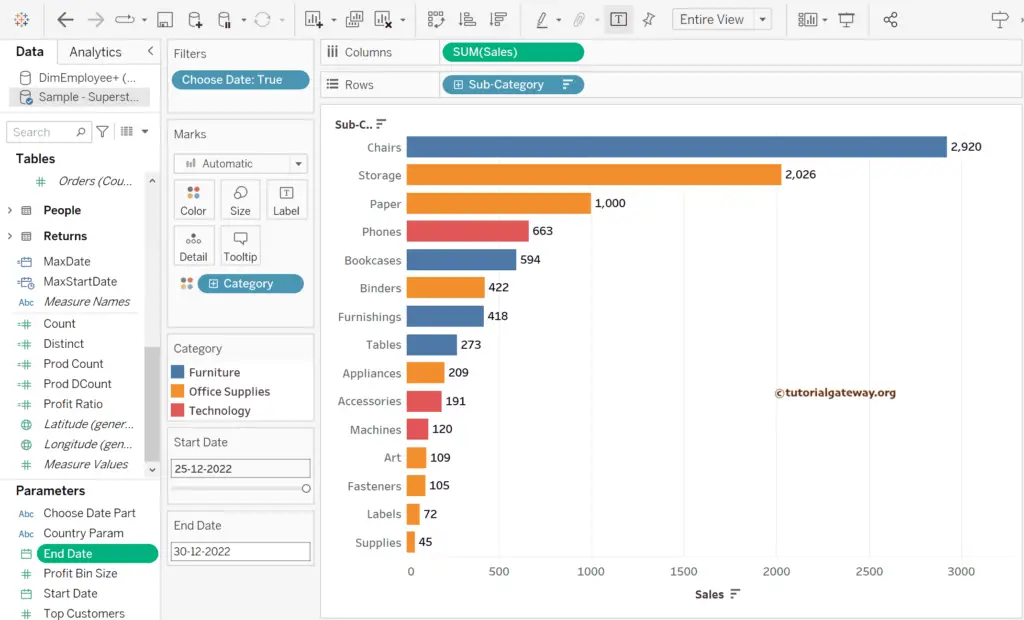
This Tableau article explains how to use the Start and End Date filter to restrict the report from showing the records between those dates using the parameter with an example. In general, finding the sales between the start and end dates is the most common scenario to evaluate the business.
To demonstrate the Tableau Start and End Date filter using Parameter values, we used the Sample Superstore Excel file. Please visit the Excel Source article to understand the Data Source.
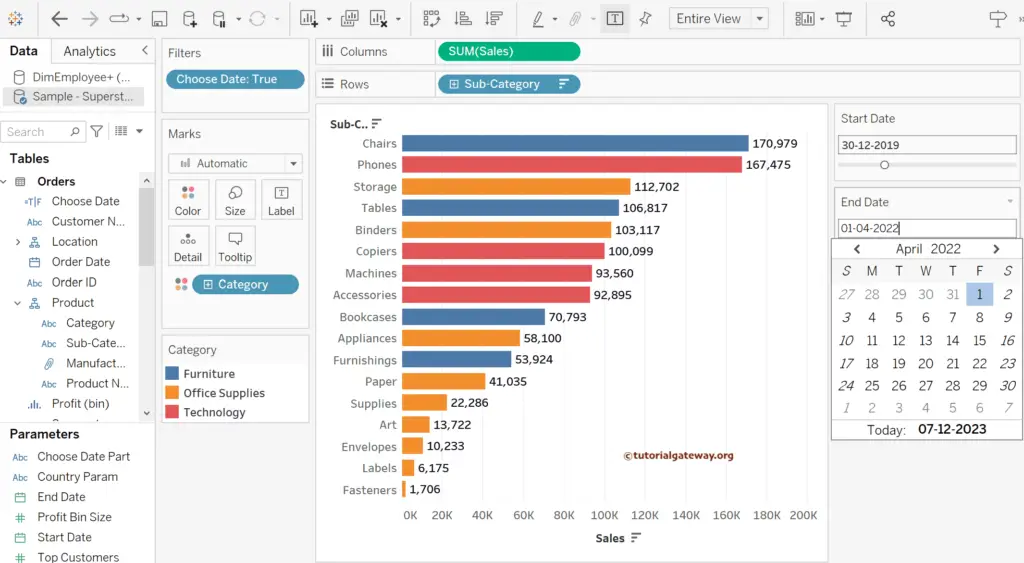
Drag and drop the Sales Measure to the Columns shelf, and the Sub-Category dimension to the Rows Shelf will generate the Bar Chart. Otherwise, please change the Marks type to Bar. Next, add the Category to the Color Shelf and use the T button in the toolbar to add data labels to the Bar Chart. For the remaining charts in Tableau, please click here.
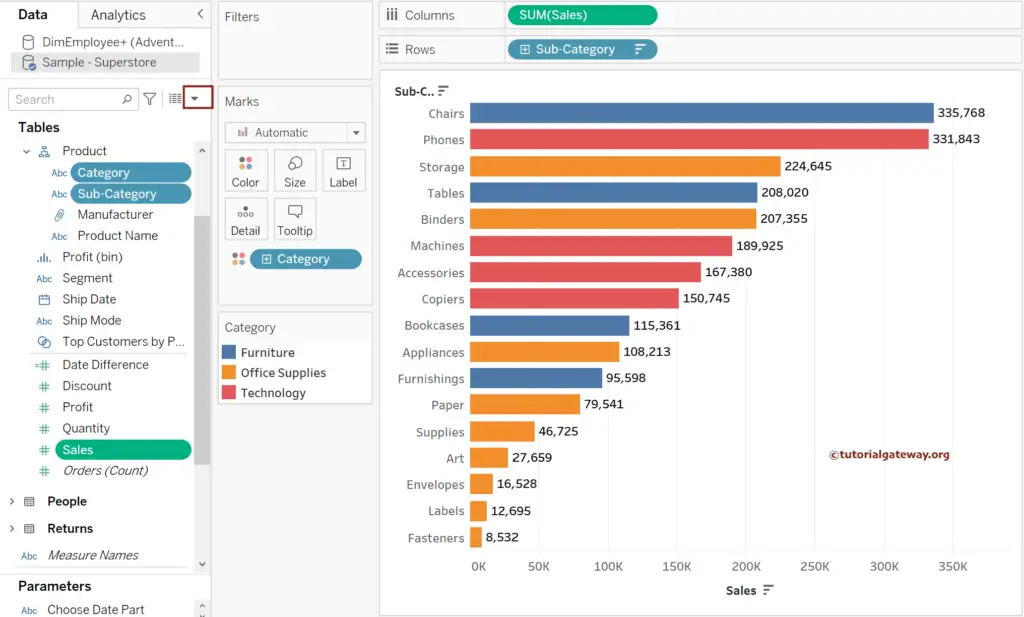
Tableau Start and End Date Filter using Parameter
To fulfill this requirement, we need two parameters to select the Start and End dates and a calculated field to write the expression with parameter values. So, click the down arrow (marked red), choose Create, and select the Parameter option from the context menu.
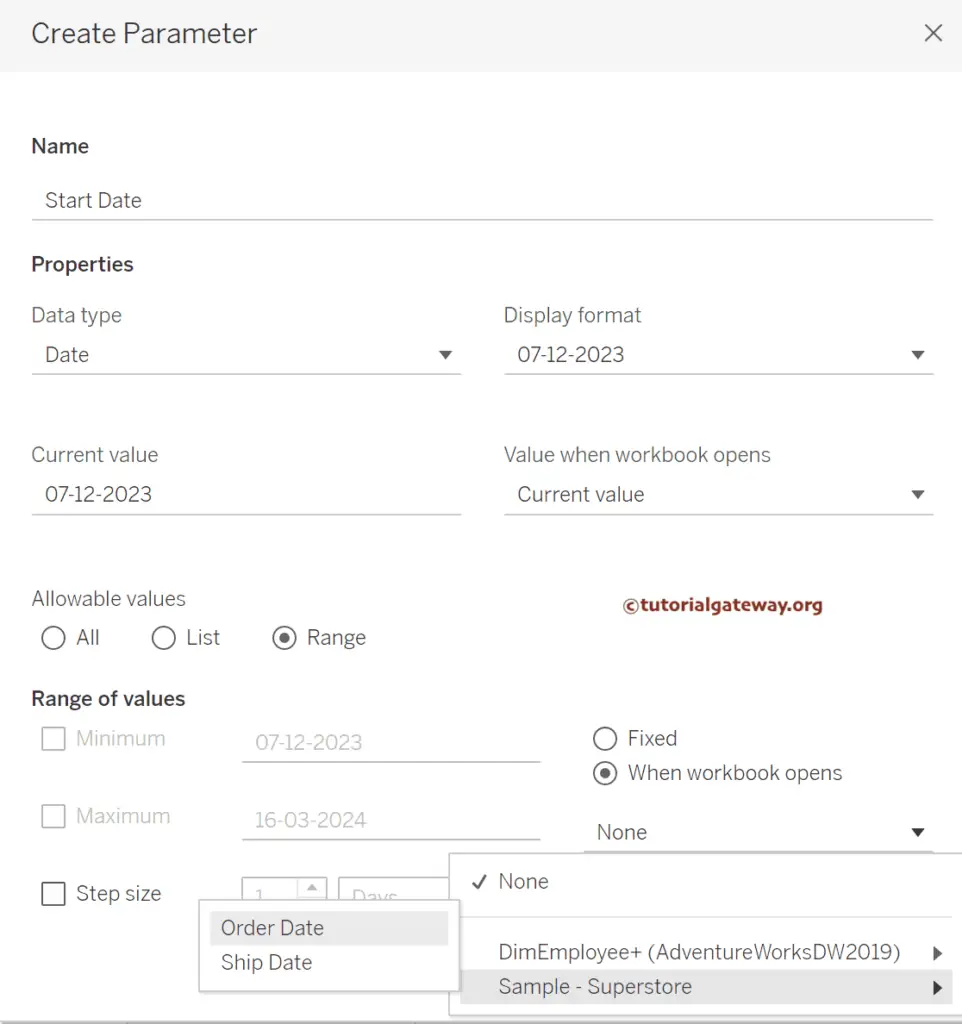
It will open the following window. Please change the name to Start Date, Data type to Date or DateTime, and set the Allowable values to Range. If you have an idea of minimum and maximum dates, then enter them. Otherwise, click the down arrow beside the Add value from the button, choose the Data Source, and then select the Date field (Order Date). It will automatically find the Minimum (Start) and Maximum (End) dates from the Order Date field.
The display format has multiple options to choose from. Please choose the required date format, and it will reflect the user’s chosen parameter value.
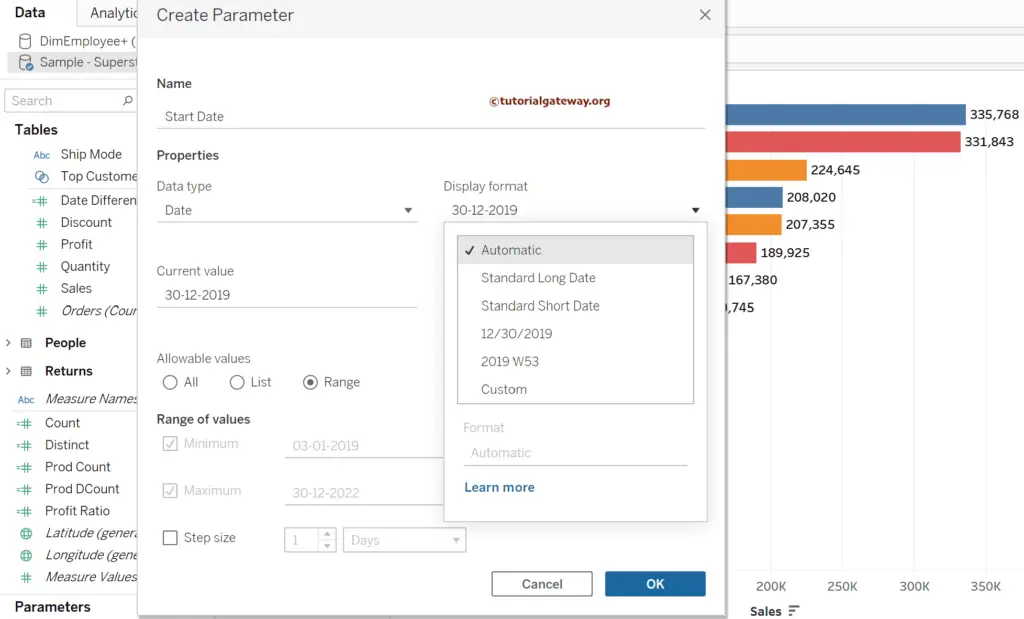
Instead of creating a new one for the End Date, click the down arrow beside the Start Date parameter and choose the Duplicate option. Next, rename it to the End Date.
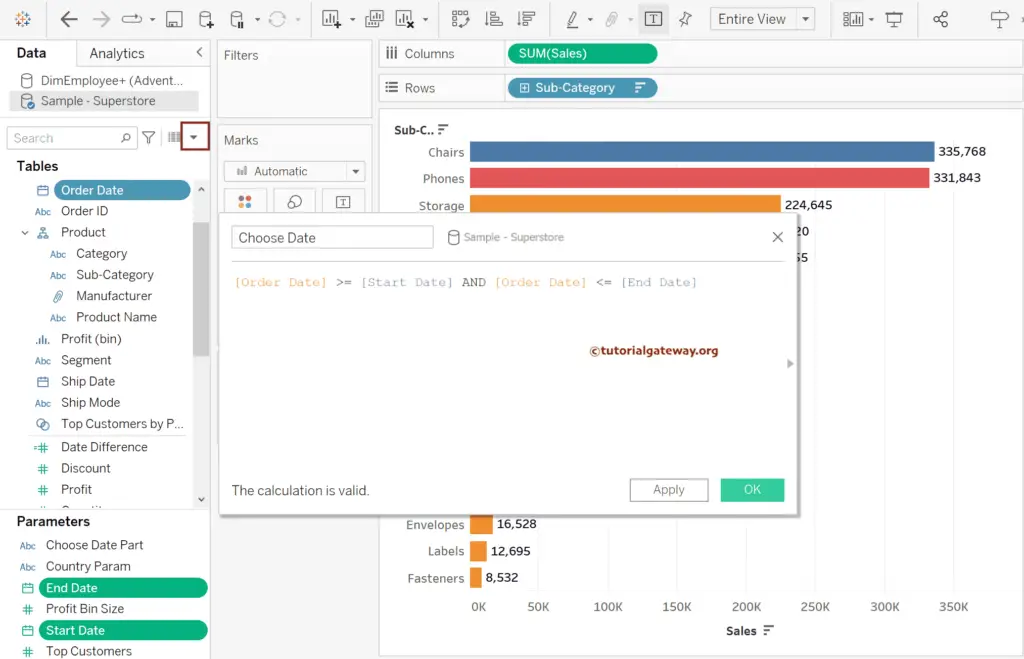
We need a Tableau calculated field to utilize these start and end date parameter to filter the report. So, click the red marked down arrow and select the Create Calculated Field.. option to write the below expression. For all the built-in functions >> Click Here!
The following Choose Date Calculated Field expression uses the Logical AND operator to check whether the Order Date is between the user-selected Start and End dates.
[Order Date] >= [Start Date] AND [Order Date] <= [End Date]
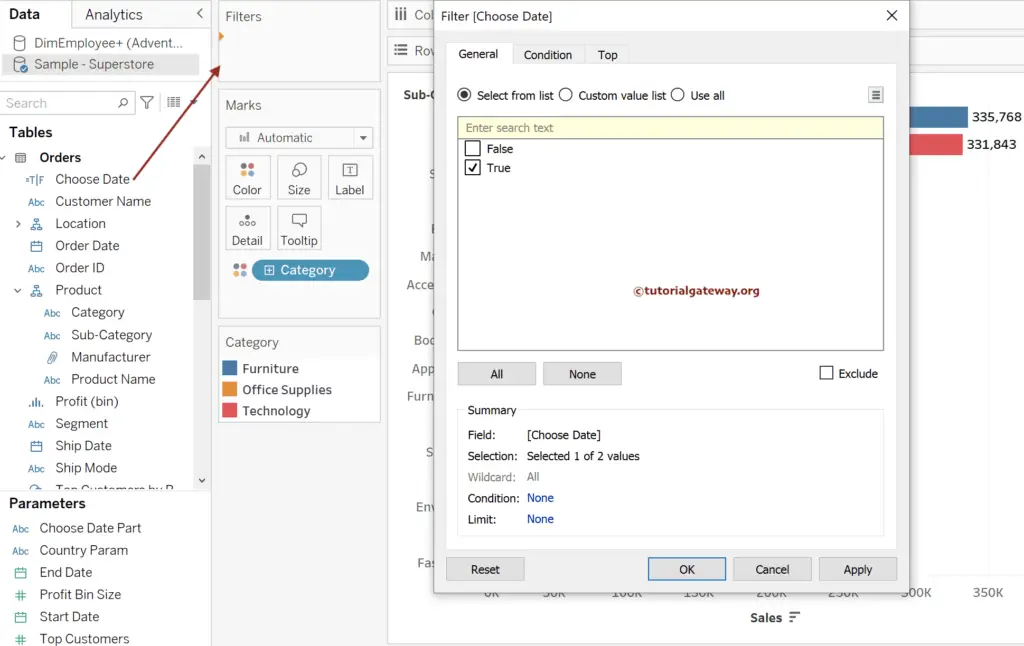
Please add the Choose Date Calculated Field to the Filters Shelf, which automatically opens the following window. Please checkmark the True option and click OK. It means the report has to display subcategory sales if the order date is between the start and end date.
Next, click the down arrow beside the Tableau Start Date and End Date parameters and select the Show Parameter option to see & filter the report. Let me choose some random dates to see the sales between those dates.
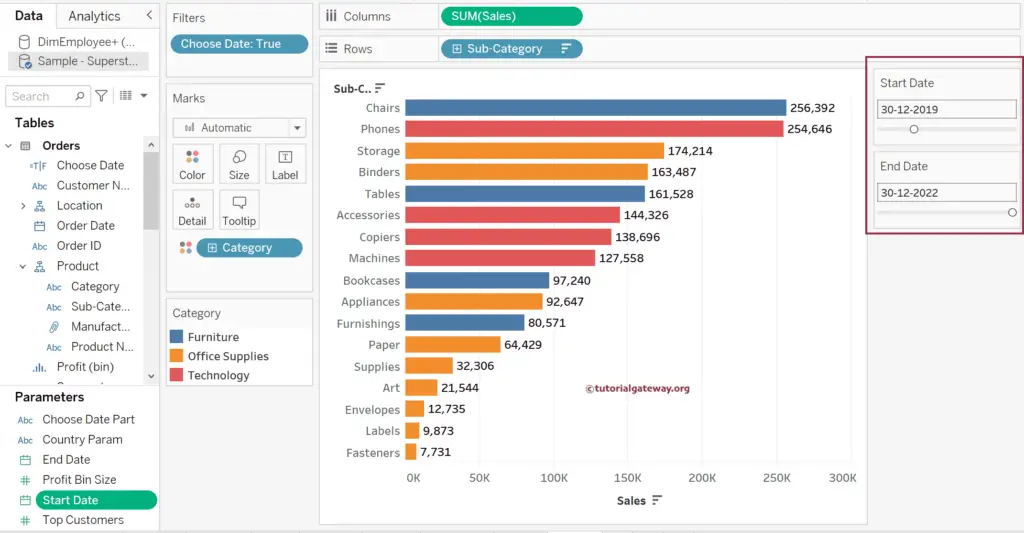
By default, the date parameters use the Slider option, and you can drag it to change the dates. Let me select the Type In option.
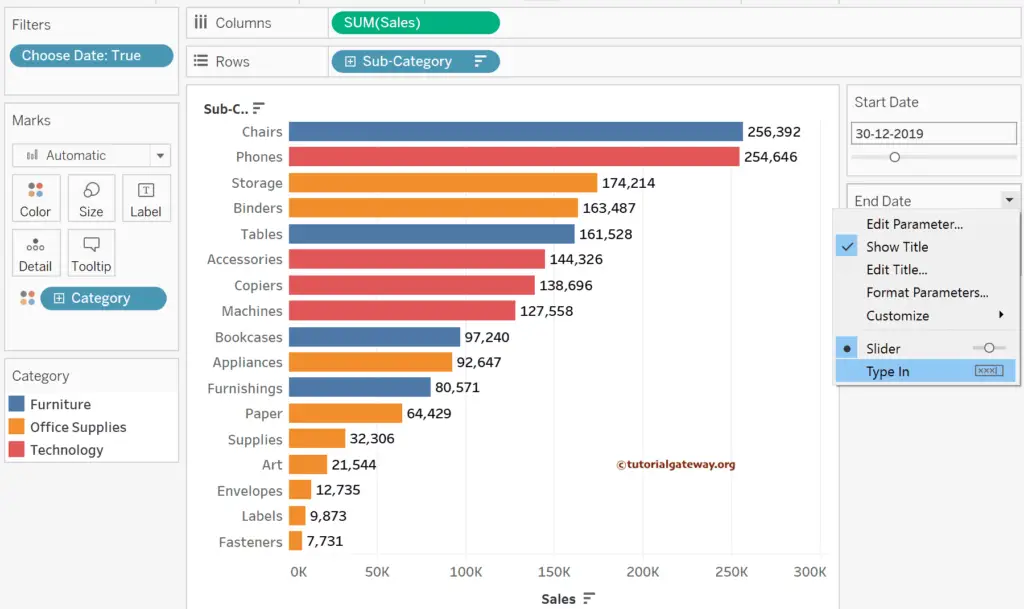
Now, you can see the standard calendar to select the dates.
How can the default Start and End Date Parameters be set to filter Tableau reports?
You can set the default dates when the report opens. For instance, every time the report opens, it must show the sales of the last five days. For this, you need two more calculated fields.
MaxDate: It returns the maximum Order date within the report.
{FIXED : MAX([Order Date])}
MaxStartDate: Subtract five days from the maximum Order date.
{ FIXED : DATEADD('day', -5, MAX([Order Date]))}
Next, edit the Start Date parameter and choose the MaxDate as the Value when the workbook opens. Similarly, edit the End Date parameter and choose the MaxStartDate as the Value when the workbook opens.
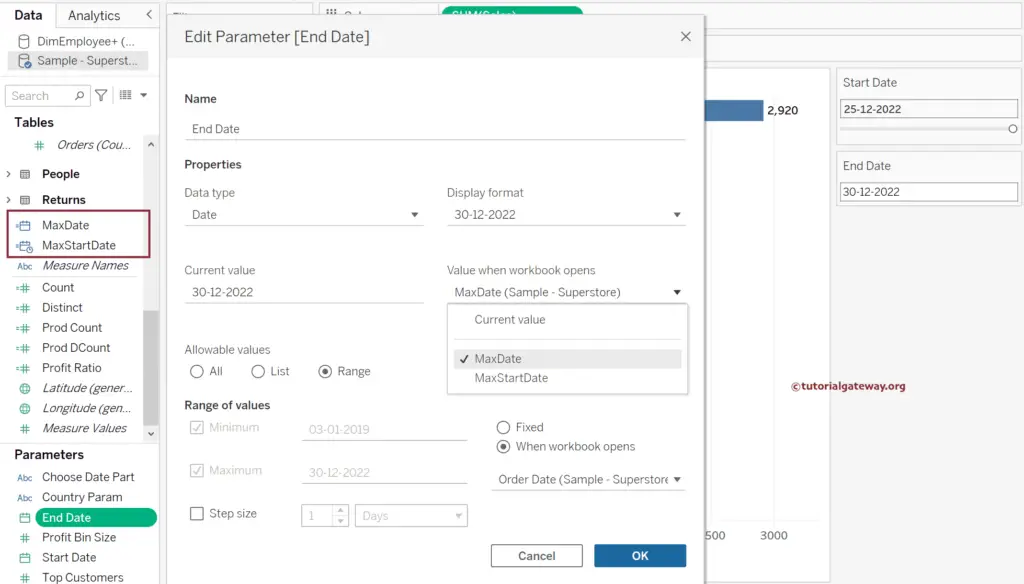
The Tableau report shows the end date as the maximum order date and the start date parameter precisely five days before to filter the bar. You can use a slider or calendar to change those default dates. If you want the start to be a week before, replace -5 in the expression with -7.
