Tableau Forecasting uses the exponential smoothing technique to predict the future trend of the numeric values. It requires a date field and measure to find the future values. This article explains how to create and use Tableau Forecasting with an example.
We used the Sample Superstore Excel sheet to demonstrate this Tableau Forecasting example. Please visit the Excel Source article to understand the Data Source.
Tableau Forecasting
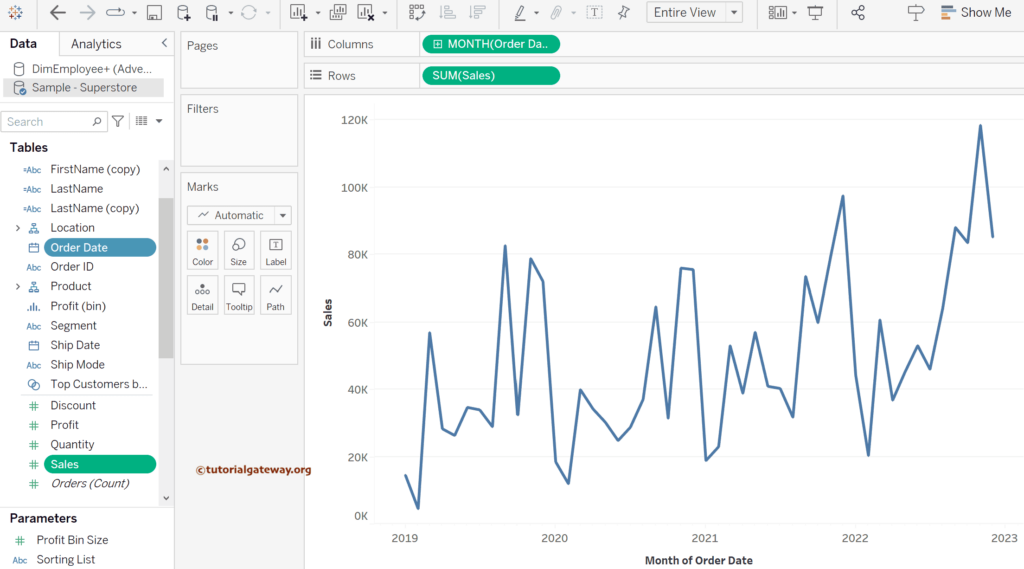
To demonstrate the Tableau Forecasting, drag and drop the Order Date to the Columns Shelf and Sales Measure to the Rows shelf to create a line chart. Otherwise, use the Show Me window or change the Marks type to the line. By default, the order date picks the year, and the chart shows the sales by year.
So, within the Columns Shelf, click the down arrow beside the Year(Order Date) and choose the Month because we want to forecast the sales by Month. It will create the following line chart. For the remaining charts in Tableau, please click here.
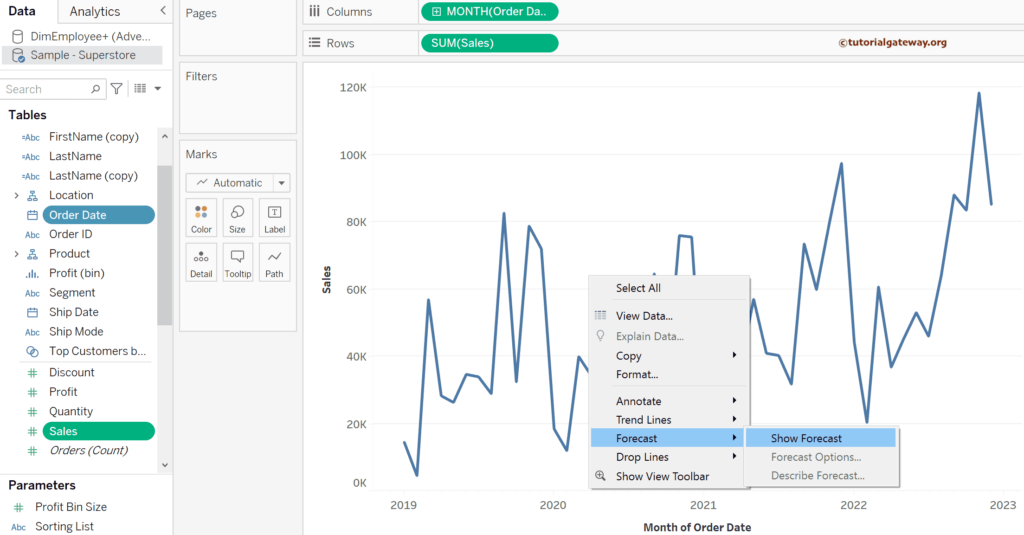
To forecast the data, right-click on the line chart and choose the Forecast option. It has three options: Show Forecast, Describe Forecast, and Forecast Options.
Show Forecast
To show the forecasting in Tableau, we must choose the first option, i.e., Show Forecast.
Now, you can see the monthly sales forecast.
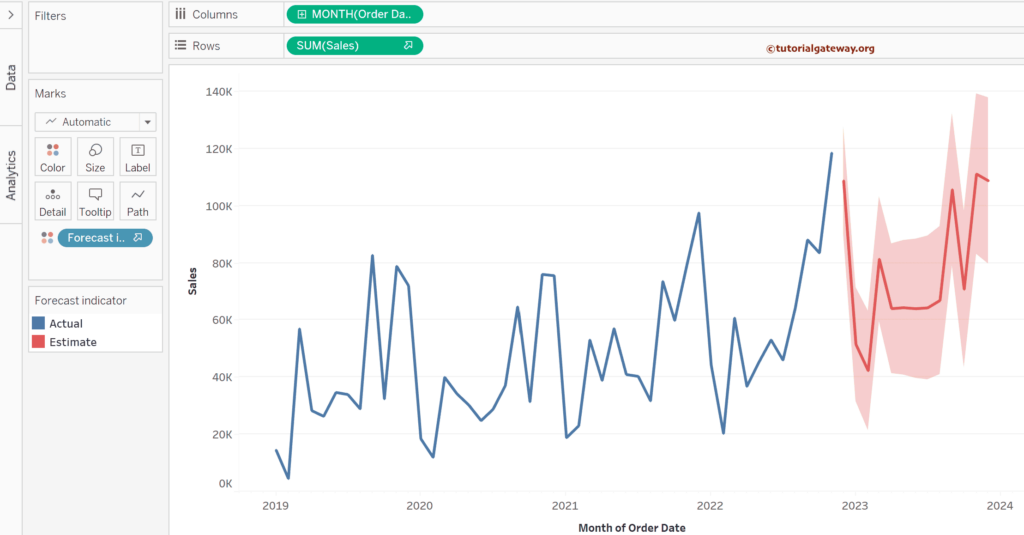
It will show the sales forecast for the date field. It uses all the default Forecasting options. So, it would be best if you used the Forecast Options to change them as required.
Describe Forecast
The describe option will show all the information about the Tableau forecasting. It includes the number of months it predicts, based on which dates it predicts, which measure it uses, how many months it ignores, etc, and also shows the seasonal effect.
Please use the above window and choose Describe Forecast to see the below window. If you look at the summary, it is forecasting for the next 13 months based on the data it has from 2019 to 2022.
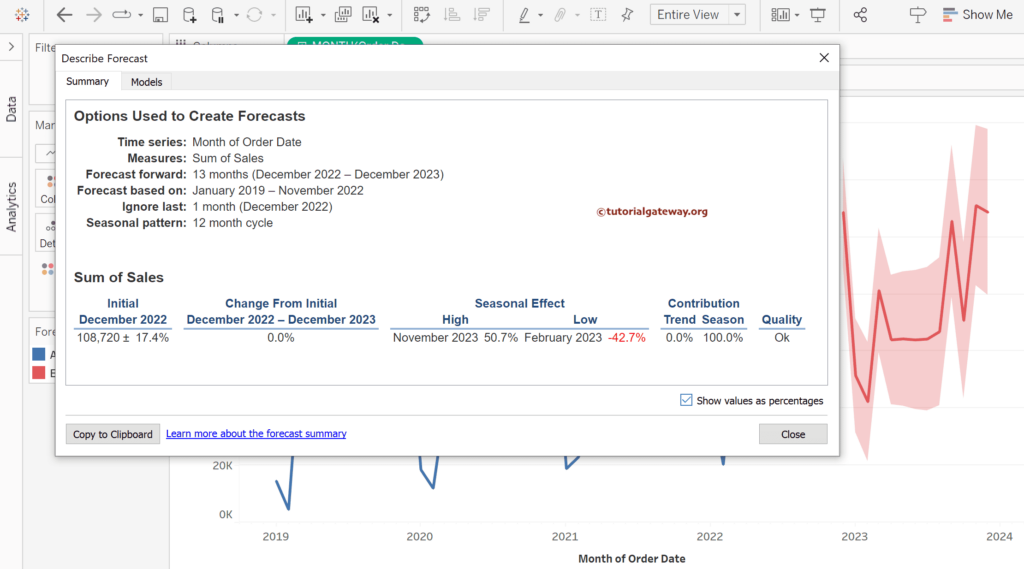
Tableau Forecast Options
It has all options like how long it has to predict, months ignored, and changing the prediction interval. Here, you can also choose the Forecast Model. By default, Tableau automatically selects the most suitable forecast model from the available ones that will generate the highest quality of data forecast.
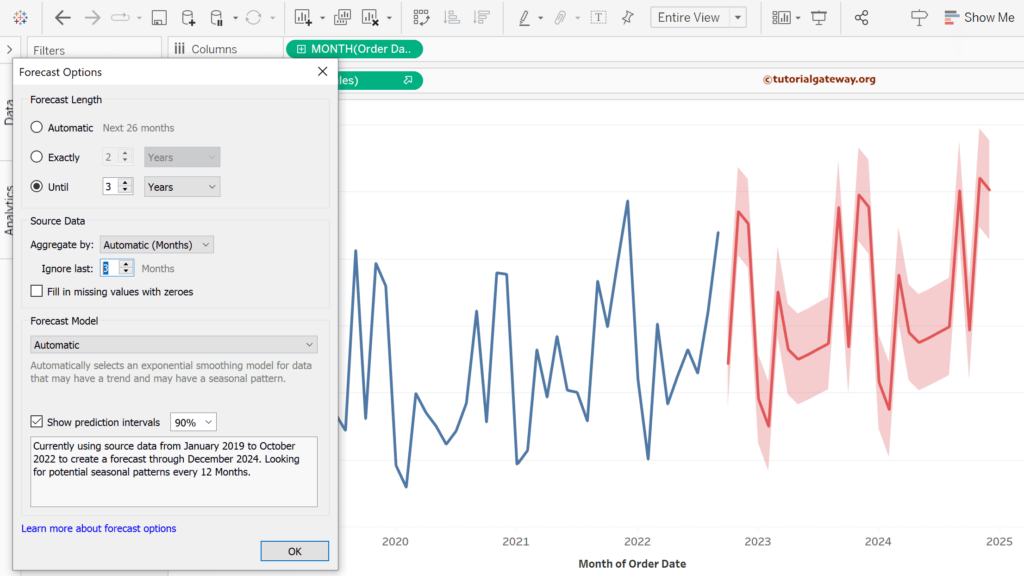
Click Forecast Options to open the window shown below. Let me change the Forecast length from Automatic to Exactly 2 Years and Show Prediction intervals from default 95% to 90%. Please notice the changes in the report.
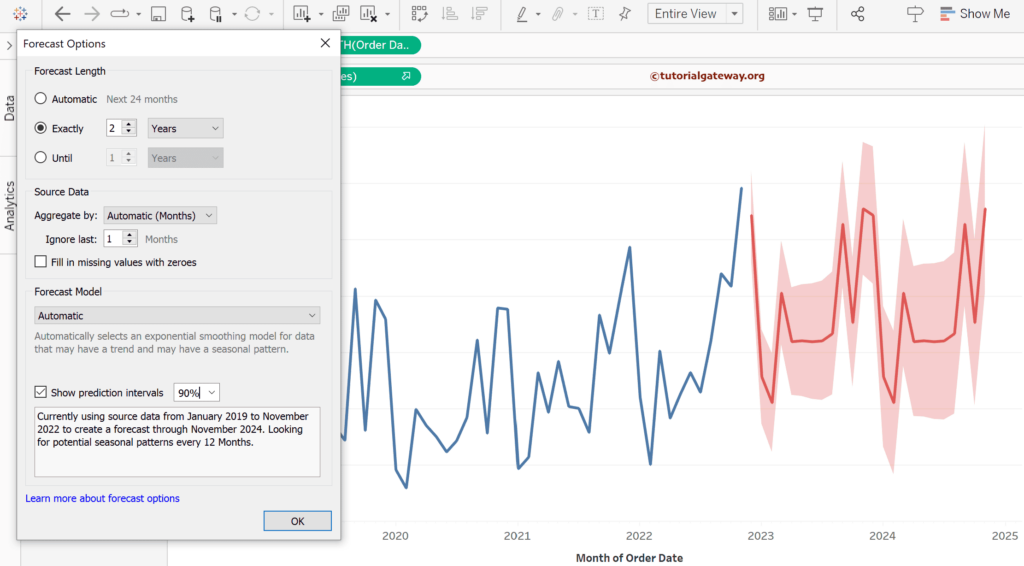
Let me change the Ignore last month from 1 to 3 and check the change in the red line area.
