Tableau Filters are used to restrict the data as per the client’s requirements. For example, we can exclude a region from the display, or we can display the top 10 performing records or low-performing records using Filters.
Before we start our example, it is essential to understand the Order of the Operations in which Desktop will execute the filters in our workbook. In this article, we will show you how to create basic Tableau filters with examples. For this demo, we created two Hierarchies representing the Country and Products. The screenshot below will show you the dimensions and measures preview.
Type of Filters in Tableau
The following is the list of available filter types, and they are.
- Conditional
- Context
- Data Source
- Extract Filters
- Filters on Dimensions
- Filters on Measures
- Filters in Dashboard
- Quick Filters
- Keep and Exclude options
- Selection
- Slicing
- Top and Bottom
Creating Tableau Filters
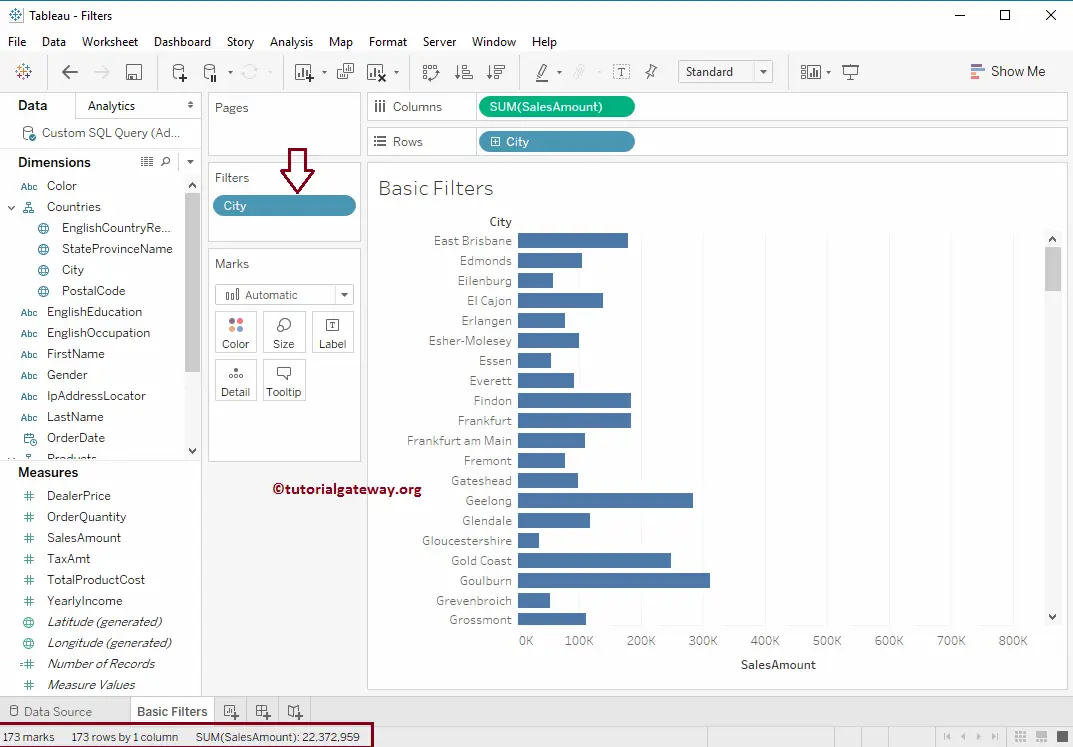
To demonstrate filters, first, drag and drop the City Name from the Dimension Region to the Rows Shelf and the Sales Amount Measures region to the Columns Shelf. By default, it will generate the Bar Chart, as shown below. Please remember that we have 269 Rows in our Report.
Also, visit the Hierarchies and Data Labels in Reports article to understand the Tableau Data Source of a Report.
- Parameters
- String Parameters
- Start and End Date Filter using Parameter
- Date Calculation using Parameter
- Dimensions as Parameters to Filter the Report
Create Filters using the tooltip Keep Only
The Desktop allows you to select individual data points or a group of data points from the report. Once you pick the data points, you will get the Keep Only and exclude options. Selecting either of the two means you are using the Tableau Filters.
For example, in the screenshot below, we are selecting 16 random cities from the bar chart. Next, we are using the Keep only option. It means we are using the filter stating that Cities with the selected names should be displayed.
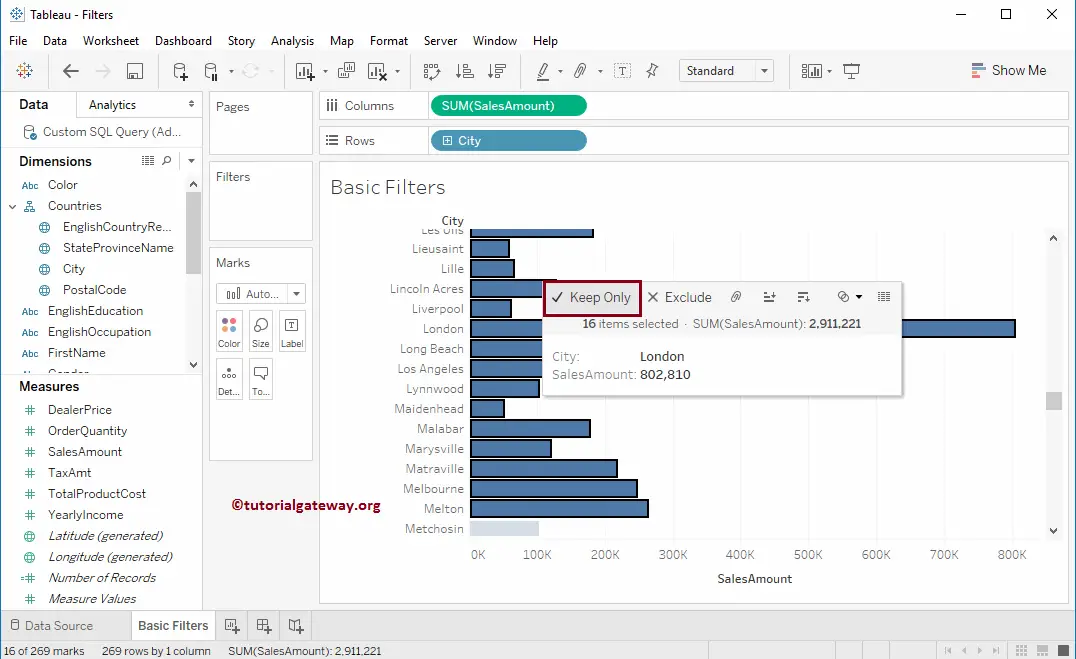
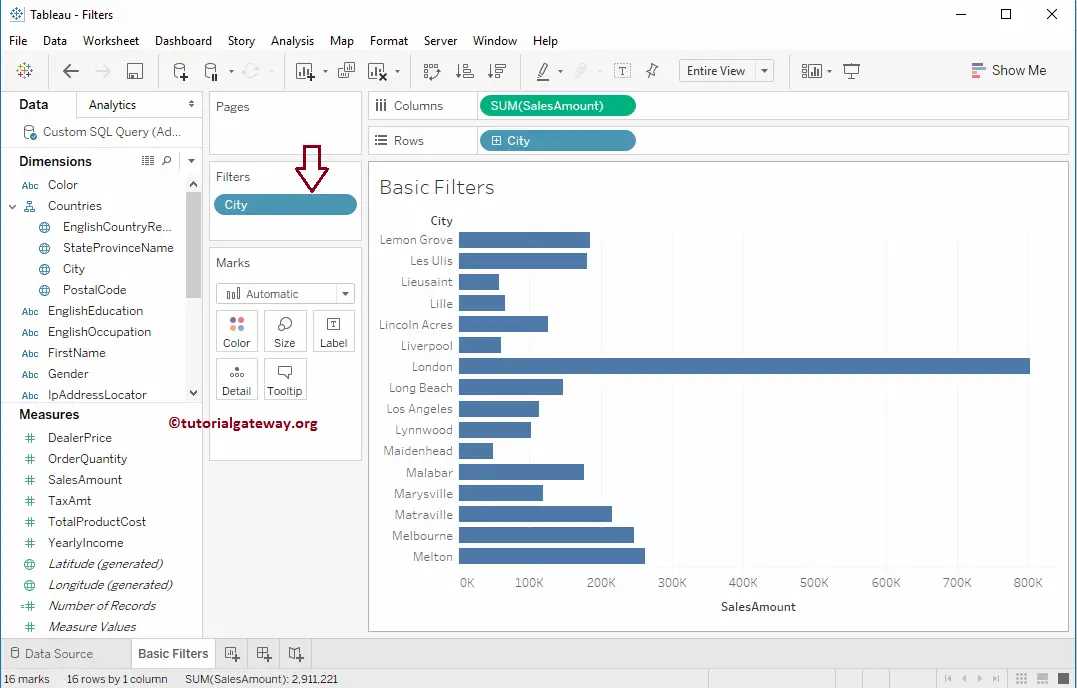
As you can see, the report displays the records that we selected in the previous step. Most importantly, the City dimension appeared on the Filters Shelf.
Create Tableau Filters using the tooltip Exclude option
In this example, we will use the Exclude Option. Here, we are selecting the first 96 Cities from the bar chart. Next, we are using the Exclude option from tooltip to remove those records from the bar chart. It means we are using the filter stating that Cities with the selected names should be restricted from the display.
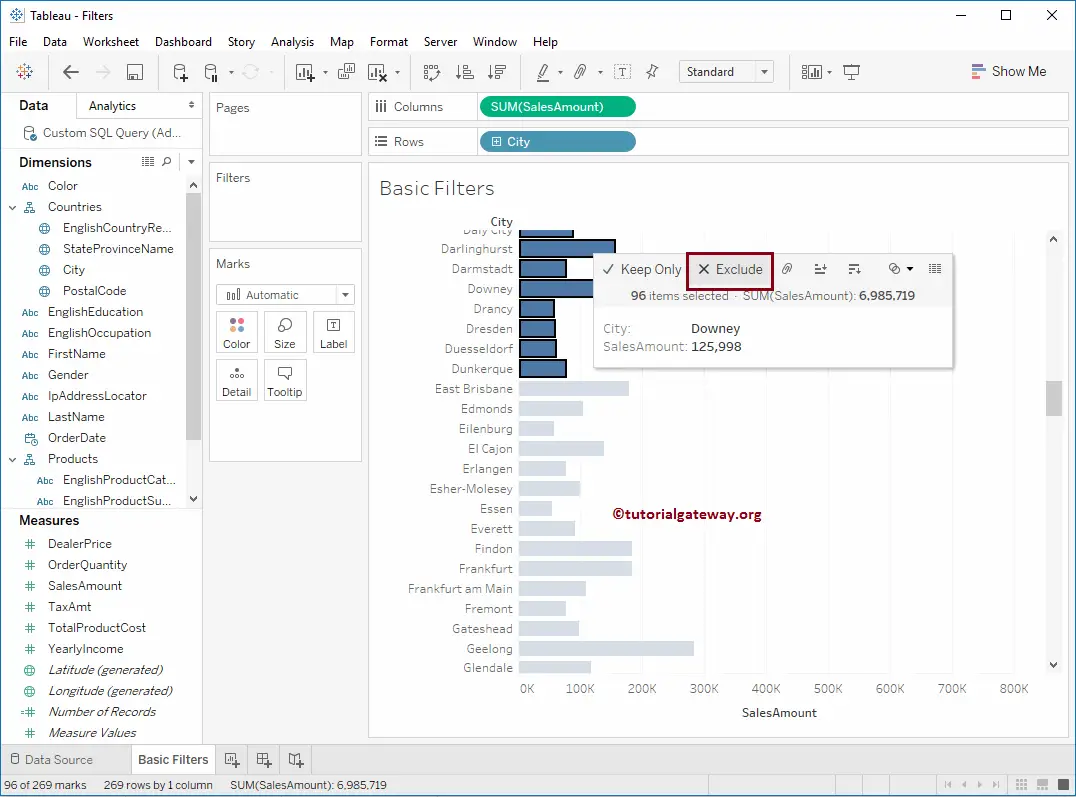
You can observe that the report displays the cities starting with E.
Though the above examples are enough to understand the basics. I want to provide two more samples using the Maps. It might be useful for further reference.
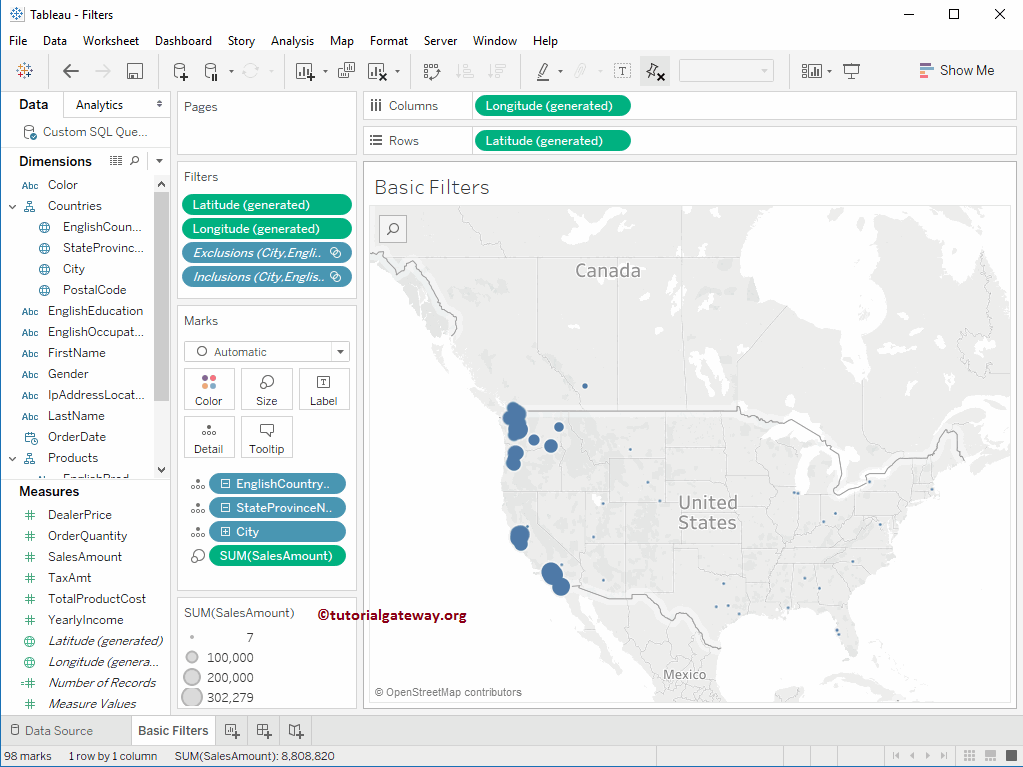
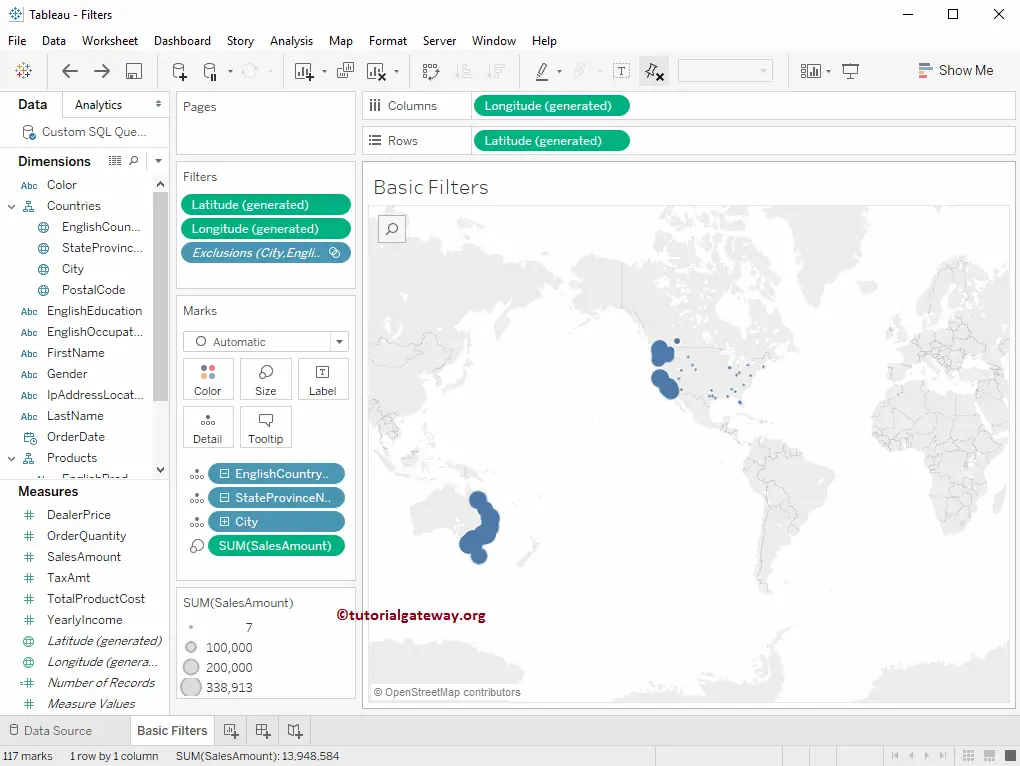
Creating Filters in Tableau Maps
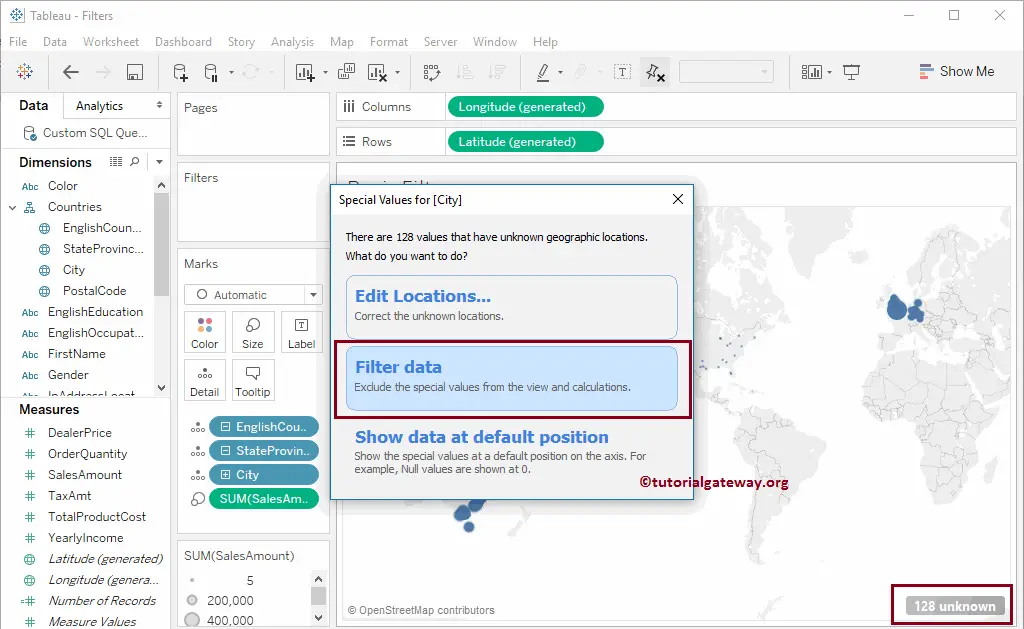
Drag and drop the Sales Amount Measures region to the Columns Shelf and the City Name from the Dimension Region to the Rows Shelf. By default, the desktop will generate the Bar Chart. So, please change it to a Map using the Show Me Shelf. Otherwise, double-click the City and add the Sales amount to the size, which will create a map for you. As you can see, the map states that there are 128 Unknown regions.
Double-click on it, which will open the following window with multiple options. It is an entirely different topic; we will discuss the possibilities in the Maps section. For now, we are choosing the second option. It means we are applying the filters on the Google Map and insisting the Map not show those 128 regions.
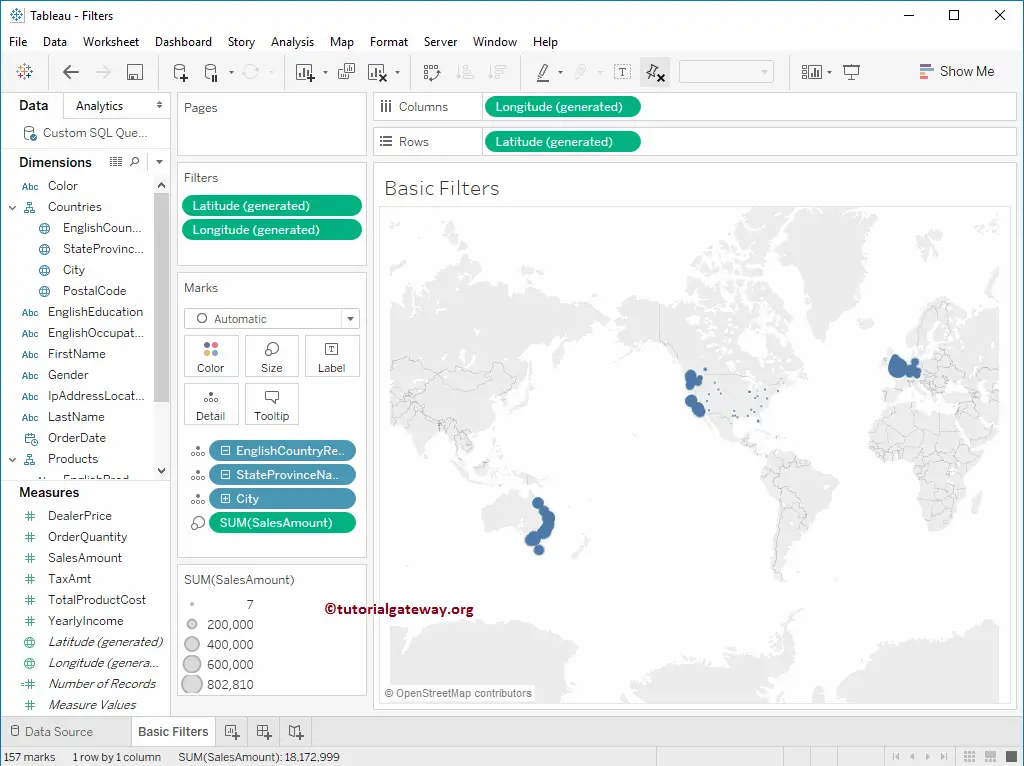
Now you can see the Map that excluded those 128 regions. It is also called filtering map data.
Create Tableau Map Filters Using the Exclude Option
We are selecting the data points from the European region from the Map. Next, we are using the Map Exclude option to create filters. It means we are using the condition stating that the Sales Amount with that Region should be restricted from the display.
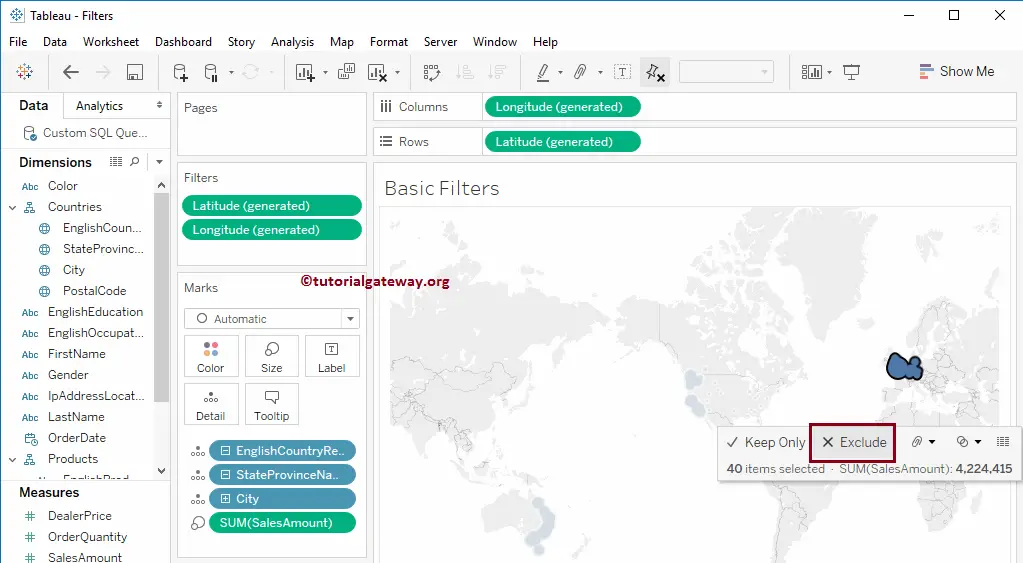
Now you can see the map without the European data.
Create Map Filters Using the Keep Only Option
We are selecting the data points from the United States Region from the Map. Next, we are using the Keep Only option. It means we are using the Tableau conditional filter, stating that the Sales Amount with the United States Region should only be displayed.
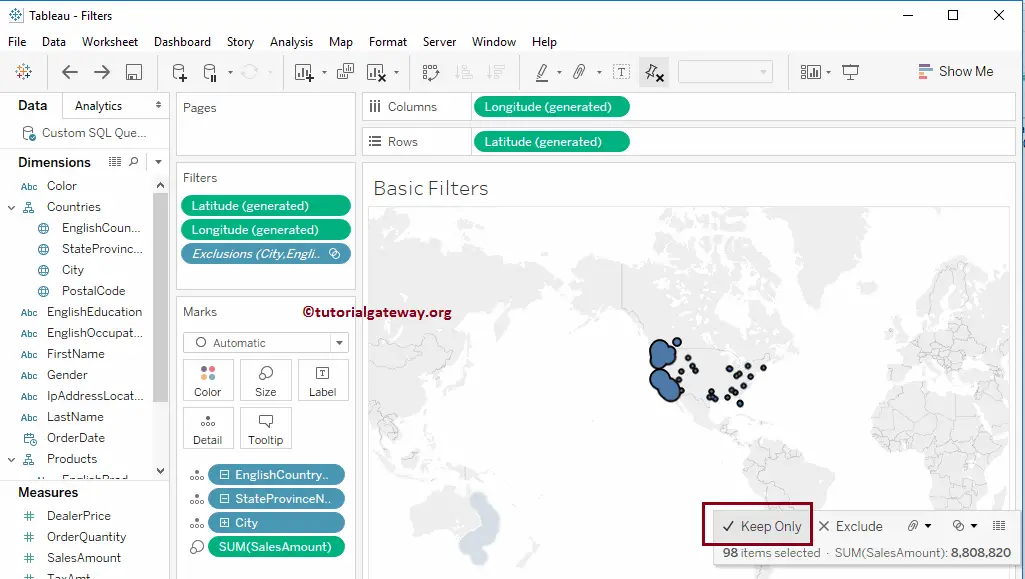
The below screenshot will show the Map.