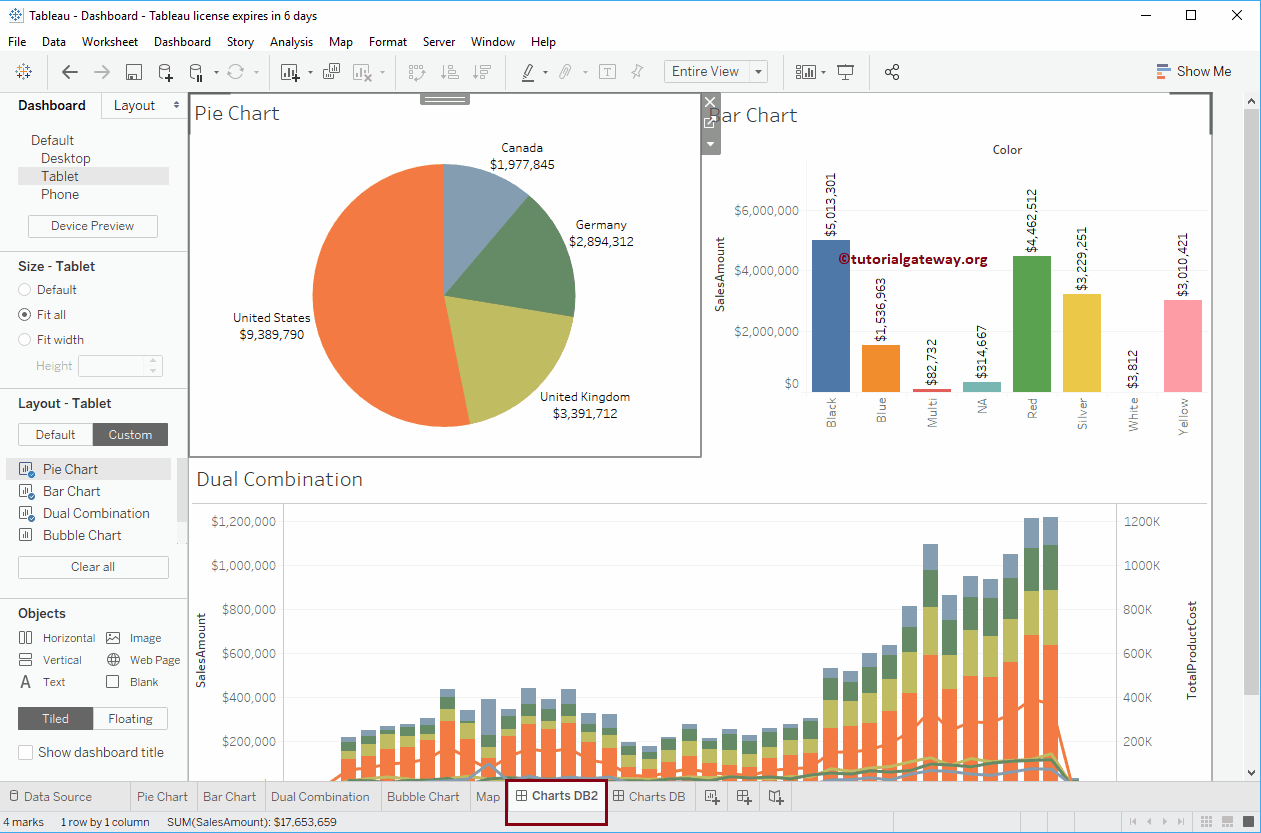
This article will show you How to create Filters in Tableau Dashboard with an example. For this demo, we will use the dashboard shown below. When designing a dashboard, user interaction is essential. Instead of showing a static report, filters allow end users to drill down into the reports based on their requirements.
Filters on the dashboard allow users to focus on a particular area, adjusting all or some charts based on a particular category or region. For example, filtering the sales dashboard based on product category, color, group, state, city, country, etc. So, we must provide a filter to navigate further into those sections.
It is the dashboard that we created in our previous article and we use it to create filters. So, please refer to the article in Tableau under the same.
Create Filters in the Tableau Dashboard
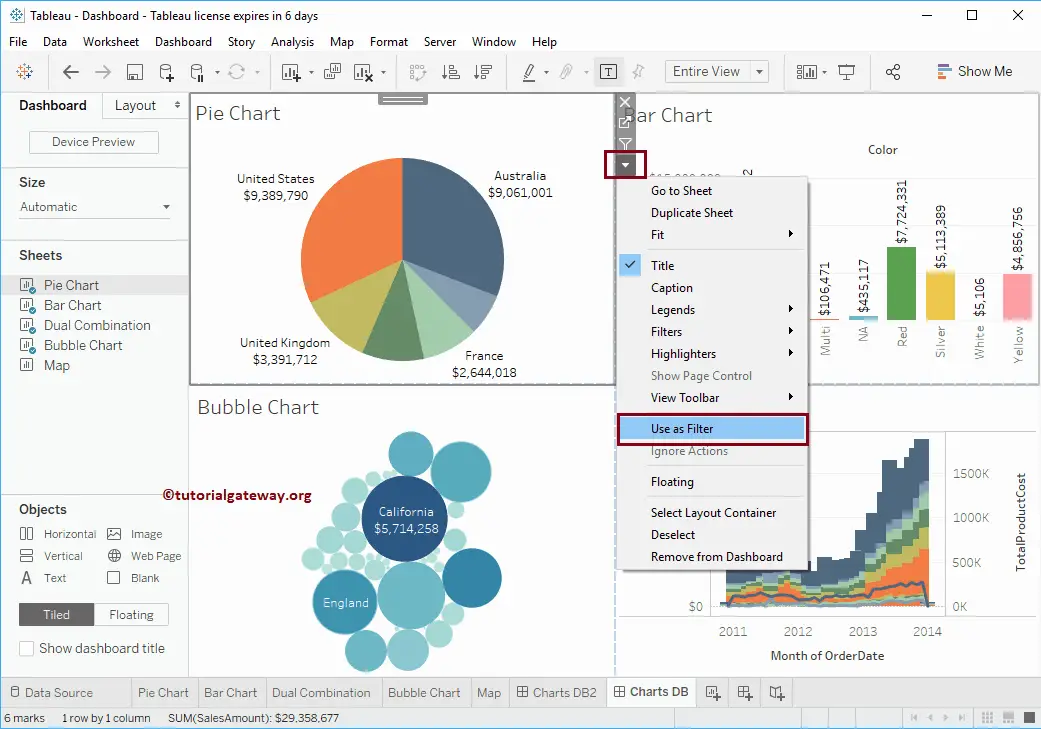
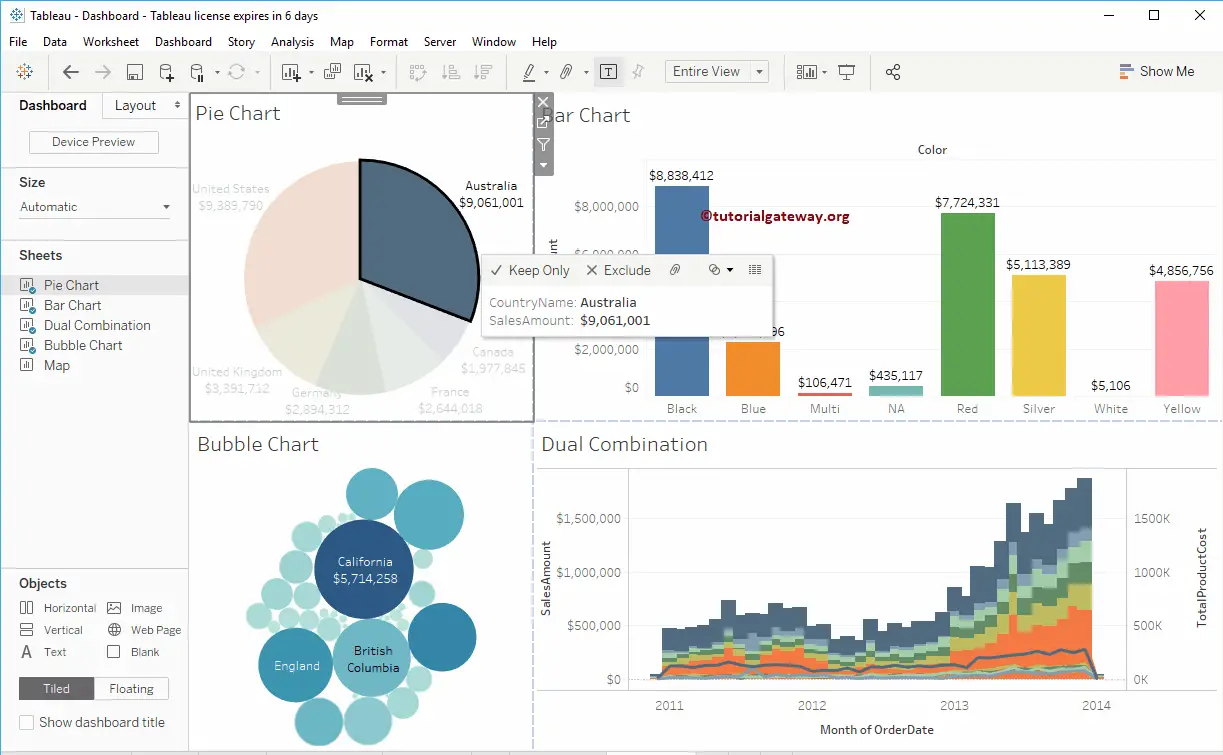
There are multiple ways to create filters on the Dashboard. The first approach is that we can use a dashboard item (Sheet or Chart) as the Filter. To demonstrate the same, we will use a Pie Chart as a filter for this dashboard. To apply the same, Please select the Pie Chart and click the Use as Filter button.
Or click on the Down arrow and select the Use as Filter option from the drop-down menu, as we have shown below.
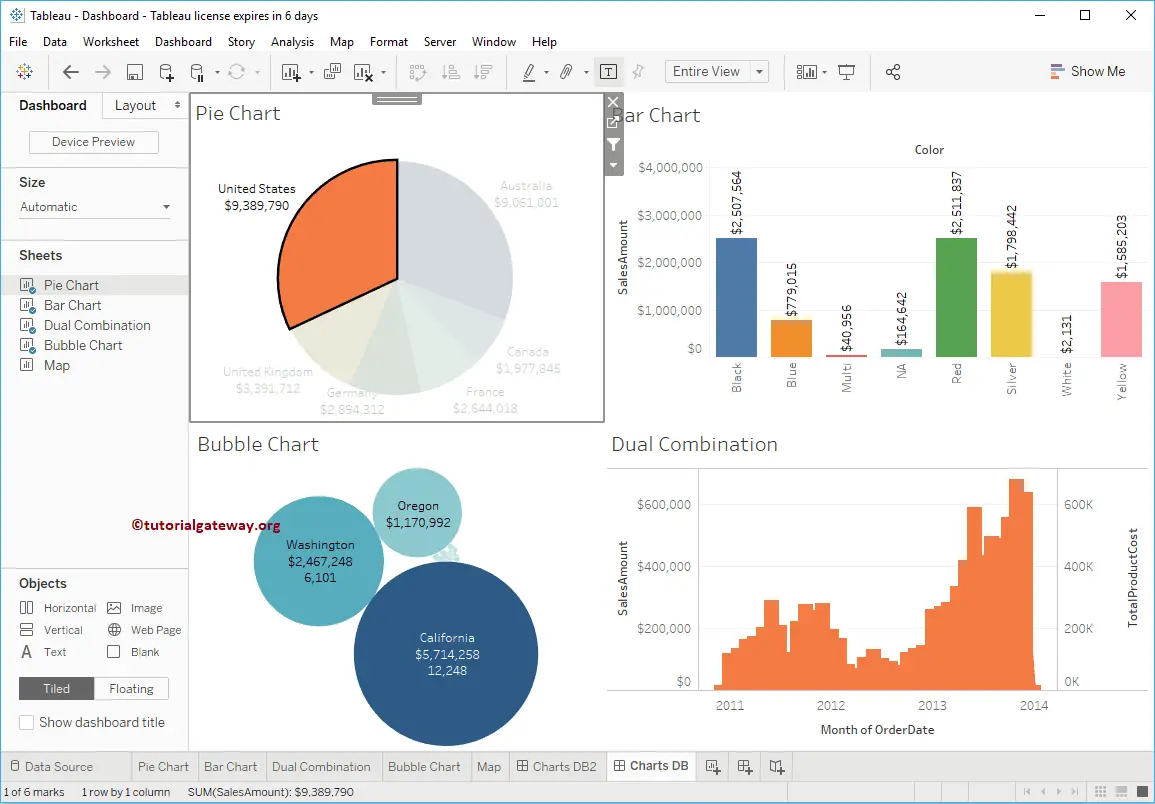
Either way, it will convert the Pie chart as a Dashboard Filter. The screenshot below shows that data in all the other charts were formatted when I was selecting the United States. I mean, they are displaying data that belongs to the United States. Please try Germany and other countries as well.
Remove Filters in Tableau Dashboard
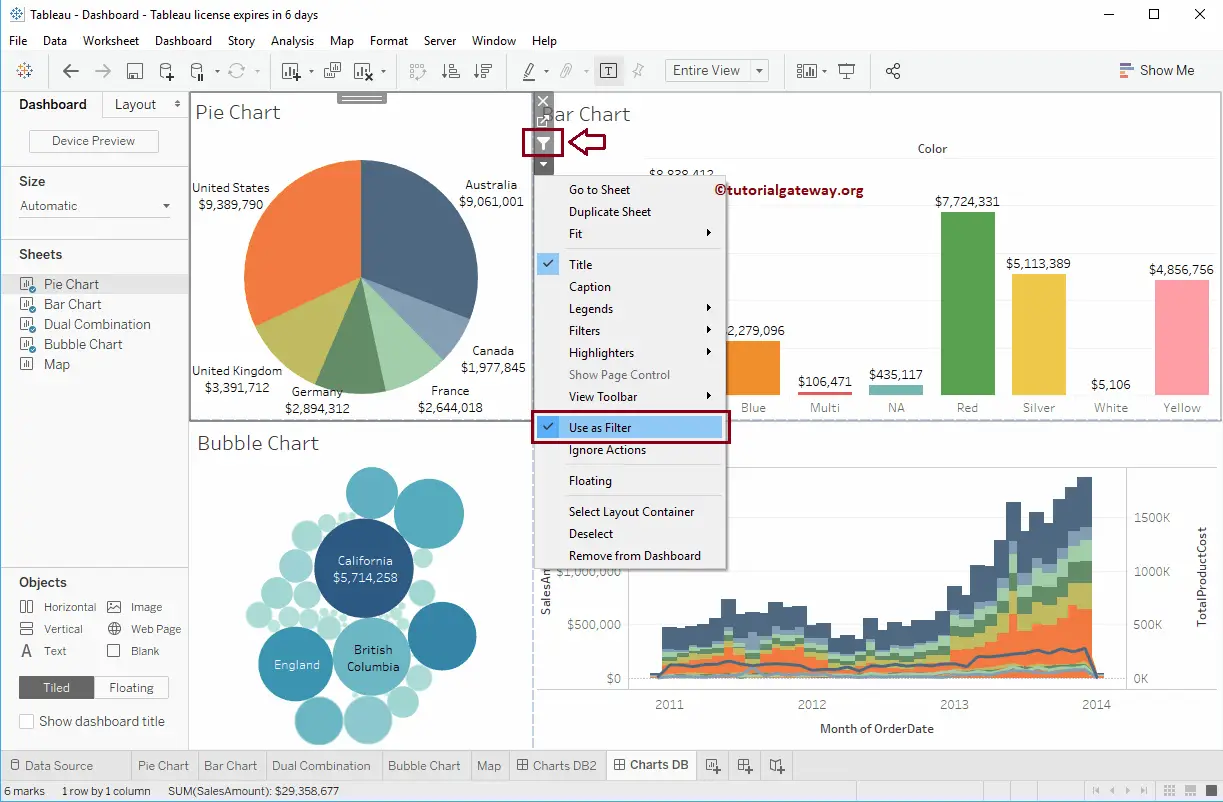
To remove this filter, you can select the Filter button or uncheck the Use as Filter option from the drop-down menu. Let me remove it.
Now you see, there is no impact on dashboard sheets even though I selected Australia from the Pie Chart.
The second approach to create Filters on Tableau Dashboard
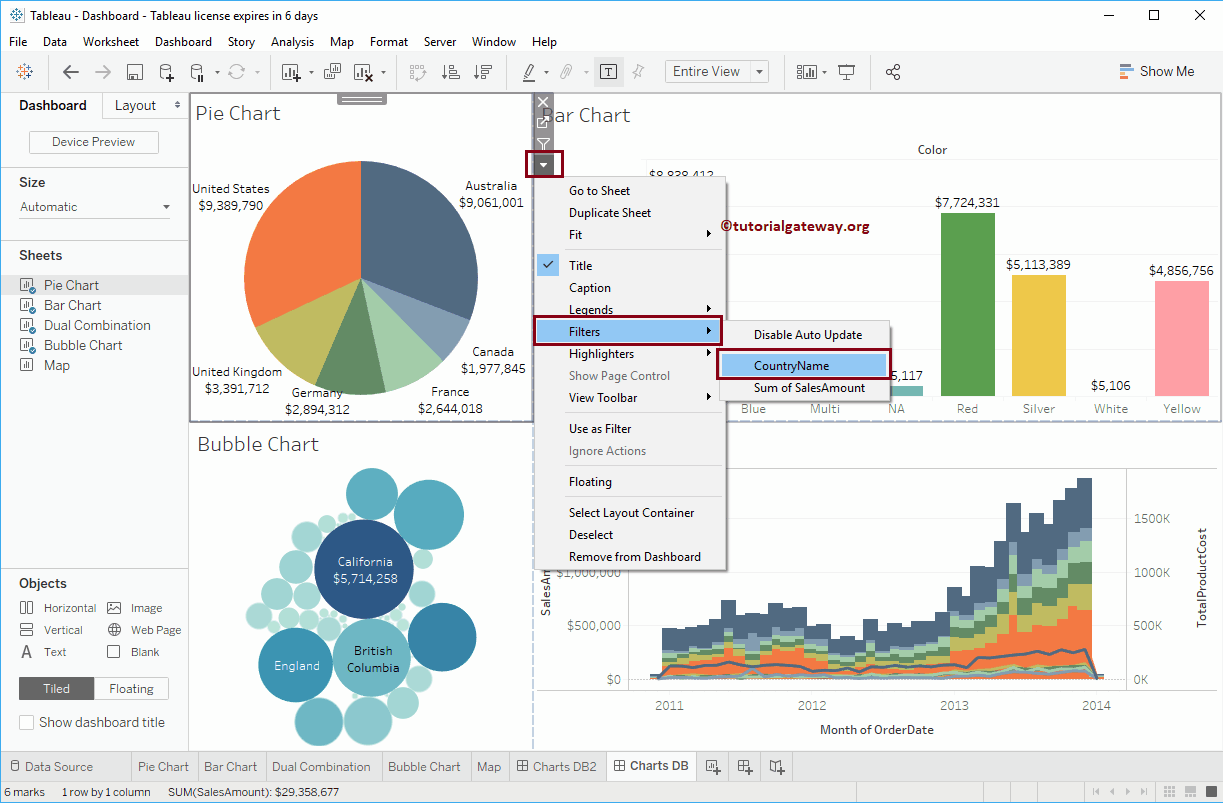
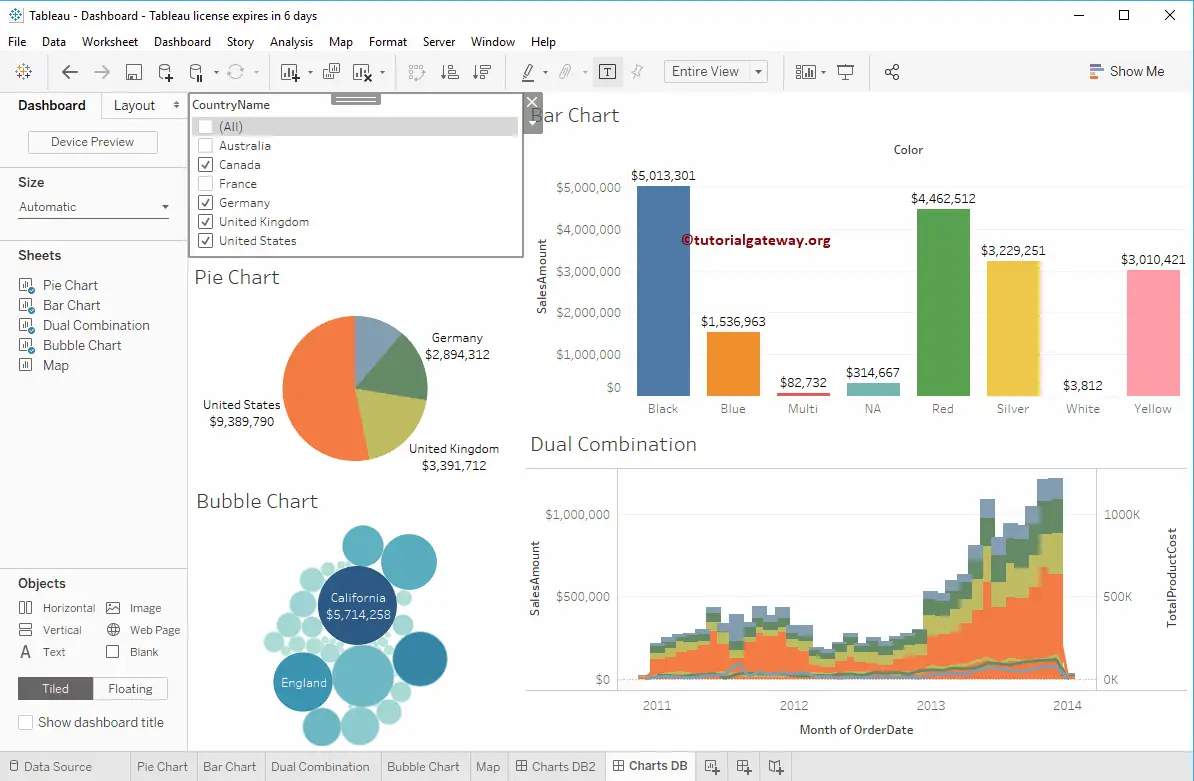
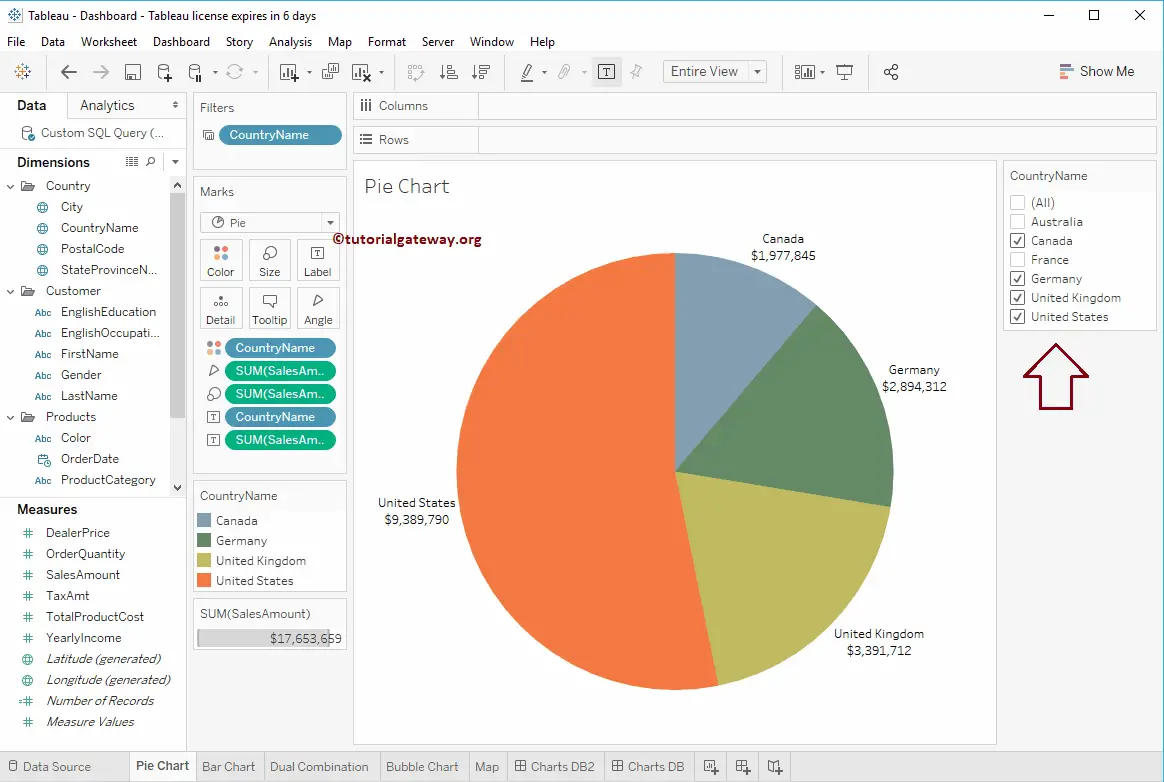
We can also apply filters on individual items (Sheets or Charts) in a dashboard. Again we are using a Pie Chart for demonstration. To apply the same, select Filters, and then select the Country name or whatever field you want.
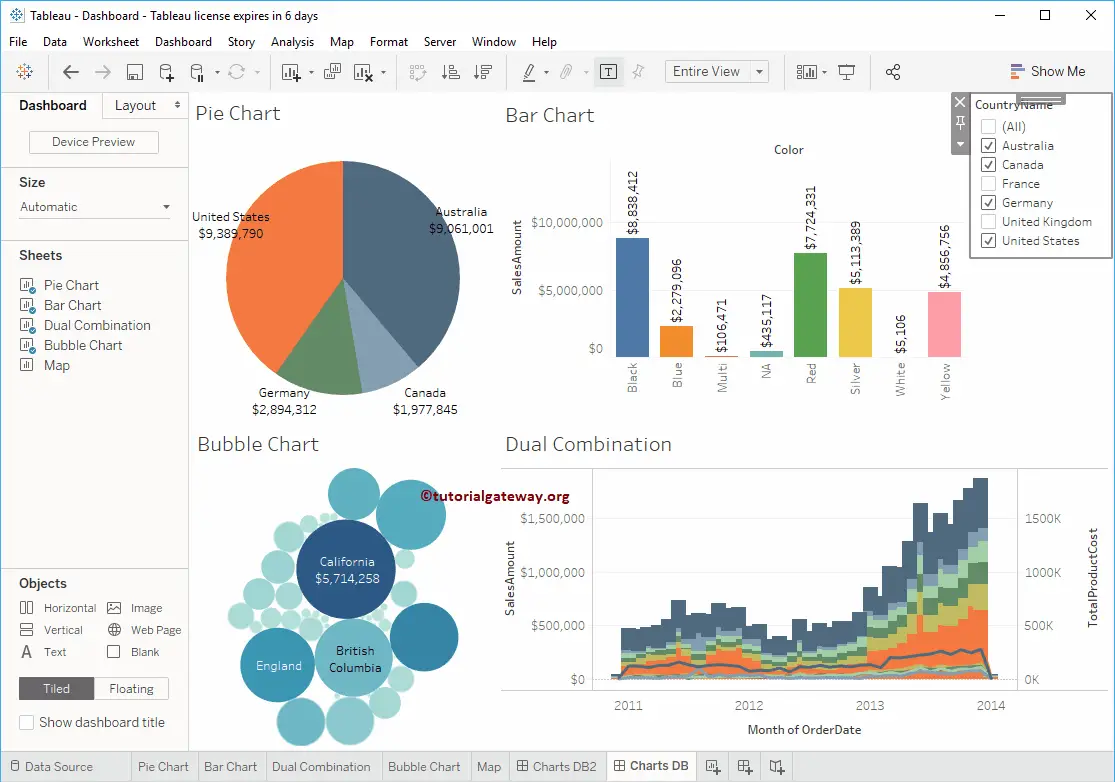
Now you see the Filter on the right side of the dashboard. Let me uncheck a few countries. From the screenshot below, you can see that Dashboard Filters apply only to the Tableau Pie Chart, and all the remaining charts are unaffected.
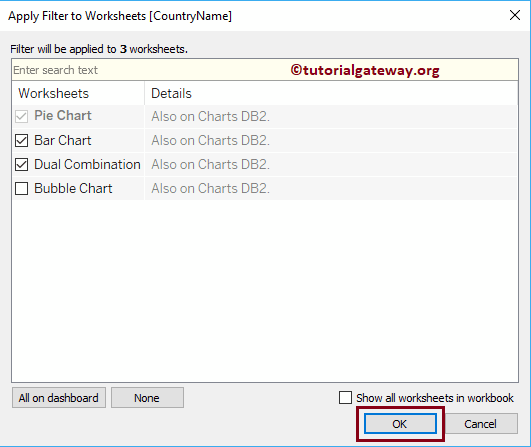
You can also convert this into a complete worksheet filter. To do so, select a filter and click on the down arrow to open the drop-down menu. Please select Apply to Worksheets and then select the Selected Worksheets.. option.
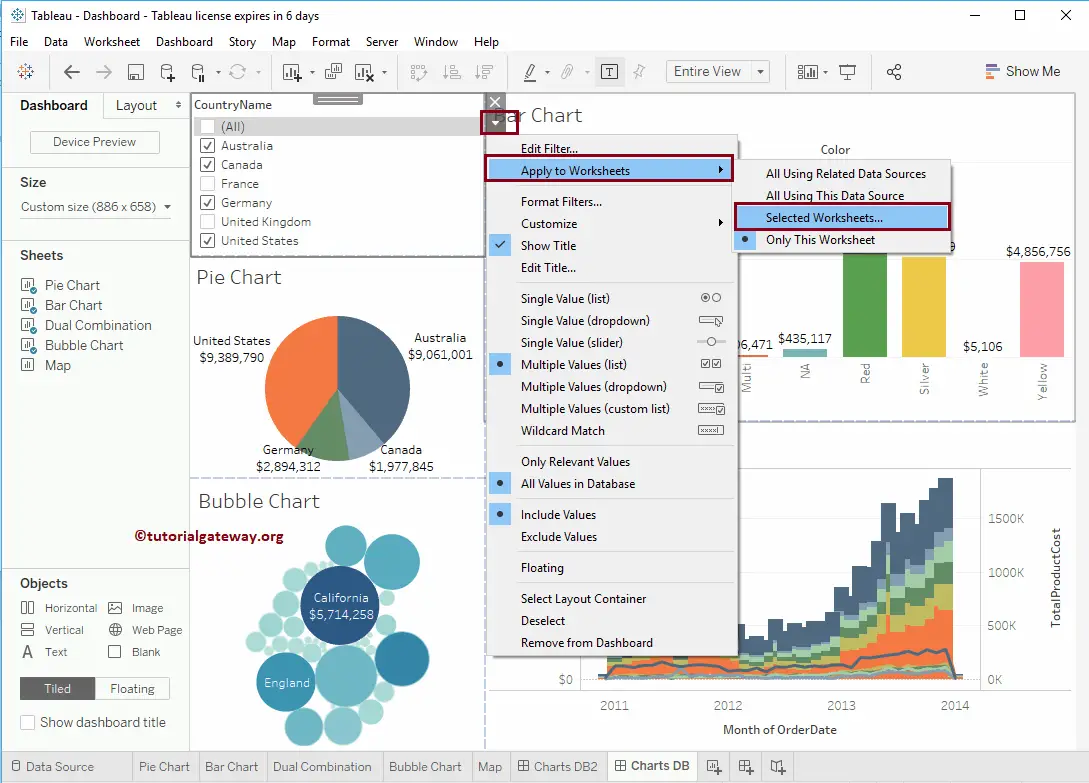
It opens the Apply Filter to Worksheets window. Please choose the Sheets that you want to apply.
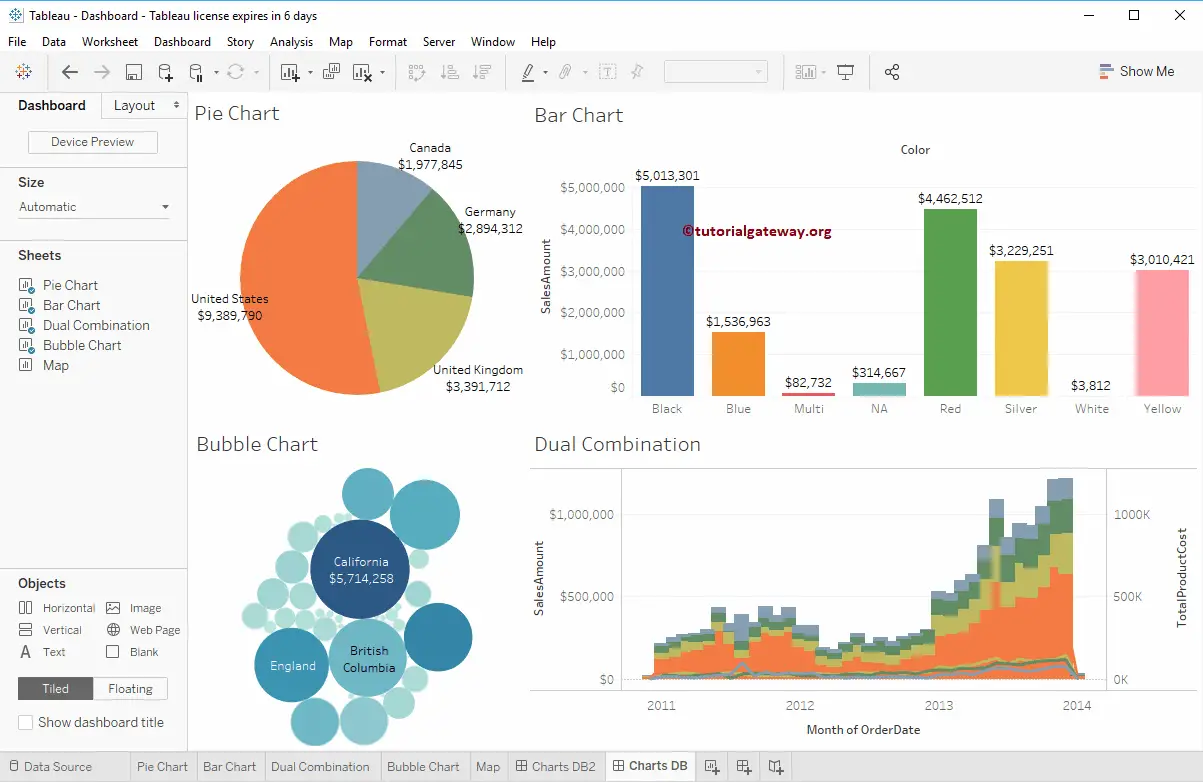
Let me uncheck a few countries. From the below screenshot, see that the Filters are applied to all the existing charts.
A third approach to create Filters on the Dashboard
Instead of applying filters on the Tableau dashboard, we can use the ones that we created in an individual worksheet.
Let me create one on a Pie Chart. Please refer to the Introduction article to understand the concept.
And you can see the impact on the complete dashboard.
Let me open another dashboard that we created in our previous article. You can see that the same filter is affecting this dashboard as well.