This article shows you how to create a Tableau Discrete Area Chart with an example. Instead of a continuous area, this discrete area chart will further divide the area into multiple sections.
We need one date field and at least one measure to create this Discrete Area chart. So, select the Order Date and the Order Quantity Measure and click on the discrete area charts option from the Show Me window to generate a chart for you.

It looks like a regular area chart.

How to Create a Tableau Discrete Area Chart?
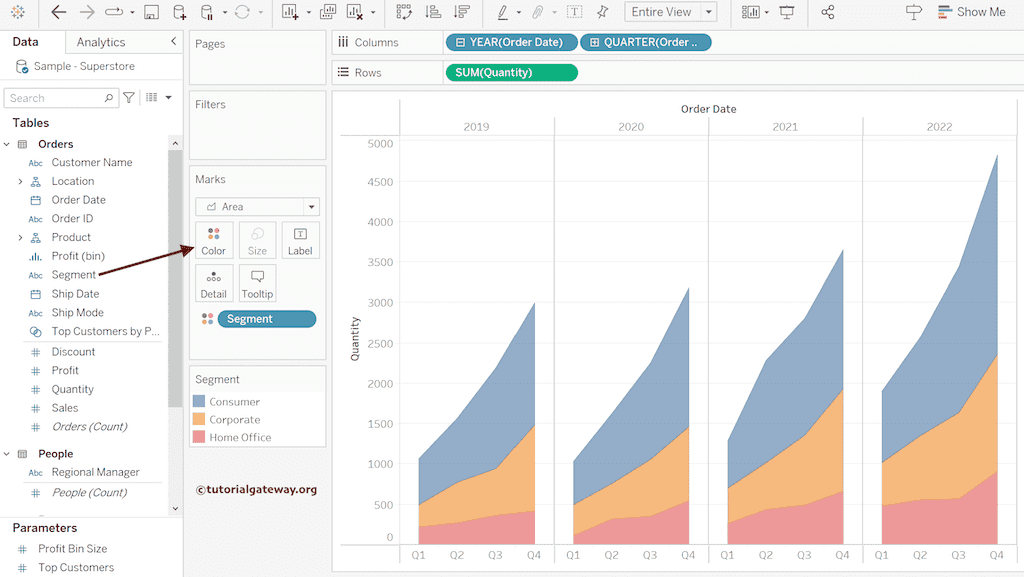
Click the plus button beside the Year to expand the column shelf’s date hierarchy. Now, you can see the Discrete Area Chart that displays the orders by year and quarter. Drag and drop the Segment field to the Color shelf to add colors to the discrete area chart.
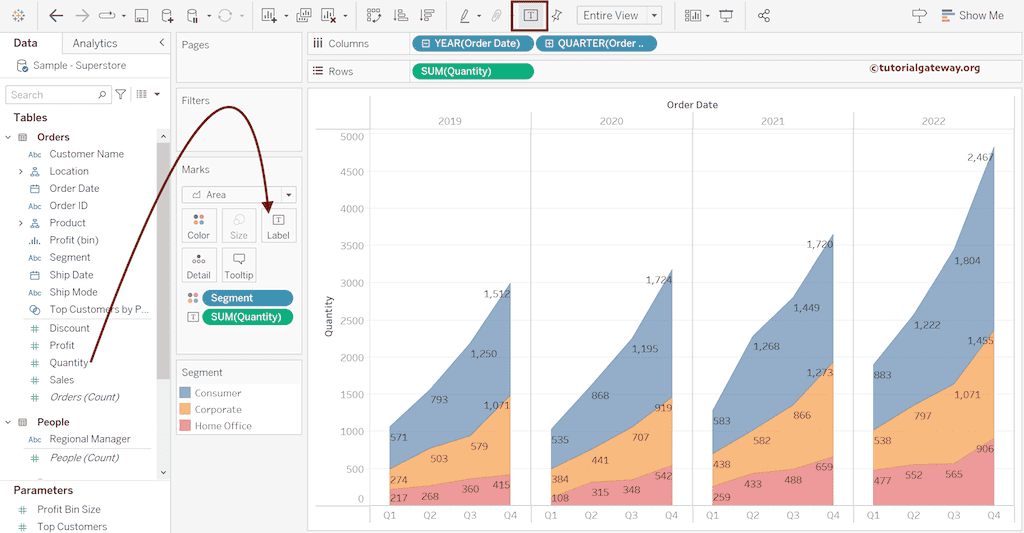
Click the T button or add the Quantity Measure Value to the Label Shelf to add data labels to the discrete area chart.
Expand the date to see the Yearly, Quarterly, and Monthly orders.

Multiple Measures
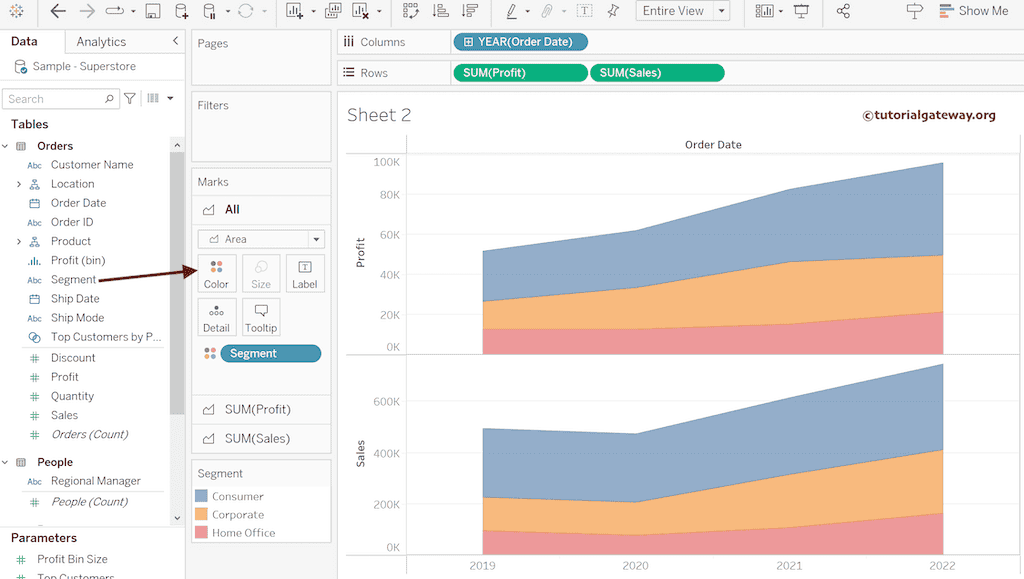
Select the Order Date Dimension, Profit, and Sales Measures and click the above-mentioned chart in the Show Me window to generate two discrete area charts on two axes.
From the screenshot below, we have added the Segment field to the Color Shelf of All (sales and profit) to divide the area chart further.
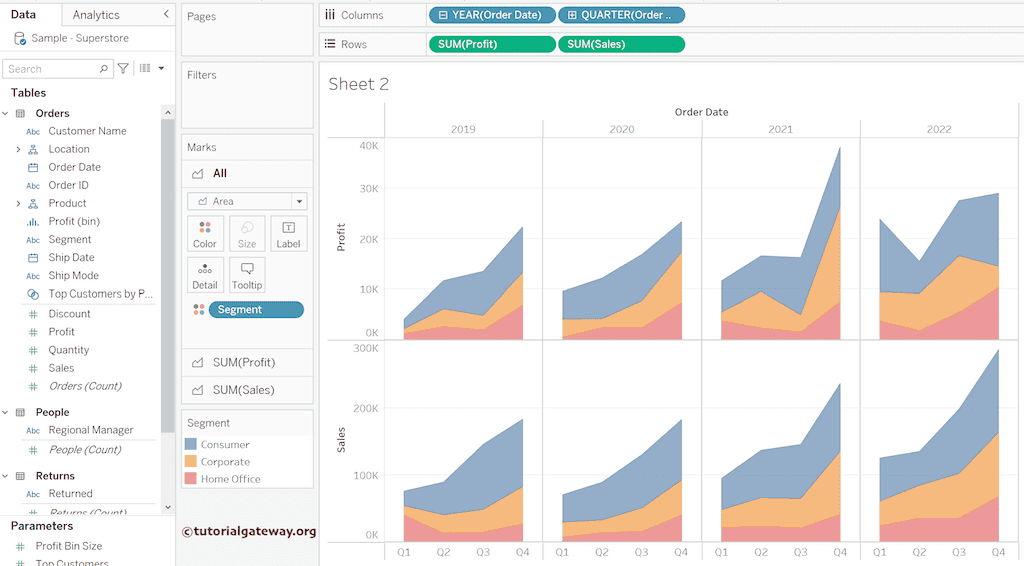
Expand to Quarterly to see the Tableau discrete area chart for profit and sales in two axes.