In Tableau, Cumulative Sum, also known as Running Total, is calculated by adding up the row values in a column in a step-wise manner. The result of the Tableau Cumulative Sum at any step(row) is the sum of all the preceding rows within a column.
This article shows how to use this Tableau RUNNING_SUM() function to calculate the cumulative sum or total for the entire Table or a particular section (Category) and use parameters as the filters to find user-chosen year or quarter with examples.
To demonstrate this Tableau cumulative sum calculation, Drag and drop the Order Date from the Sample Superstore Excel Sheet into the Rows shelf. By default, it selects the Year. Click the Plus button to expand the Order Date to Quarter or drop the Order Date again to the Rows shelf. Next, double-click the Sales to add the Measure Values.
Tableau Cumulative Sum Example
In Tableau, you must use the RUNNING_SUM() function to calculate the cumulative sum or total. There are two options, and the first is to create a calculated field using the Analysis Tab and write the following expression.
RUNNING_SUM(SUM([Sales]))
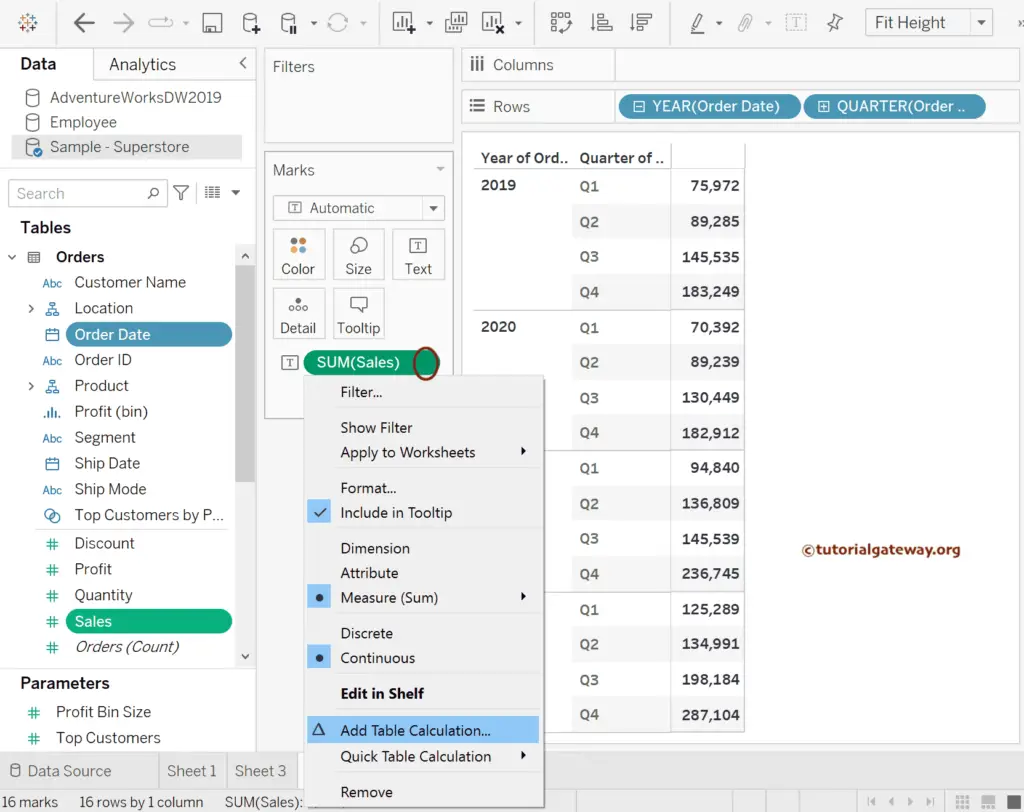
The second option is to click the down arrow beside the SUM(Sales) in the Marks shelf and choose the Add Table Calculation option. Please refer to RUNNING_SUM() and other Functions articles in Tableau.
It will open the following Table Calculation window. Please change the Calculation Type to Running Total and the aggregate function to sum. If you want the cumulative average, select the avg.
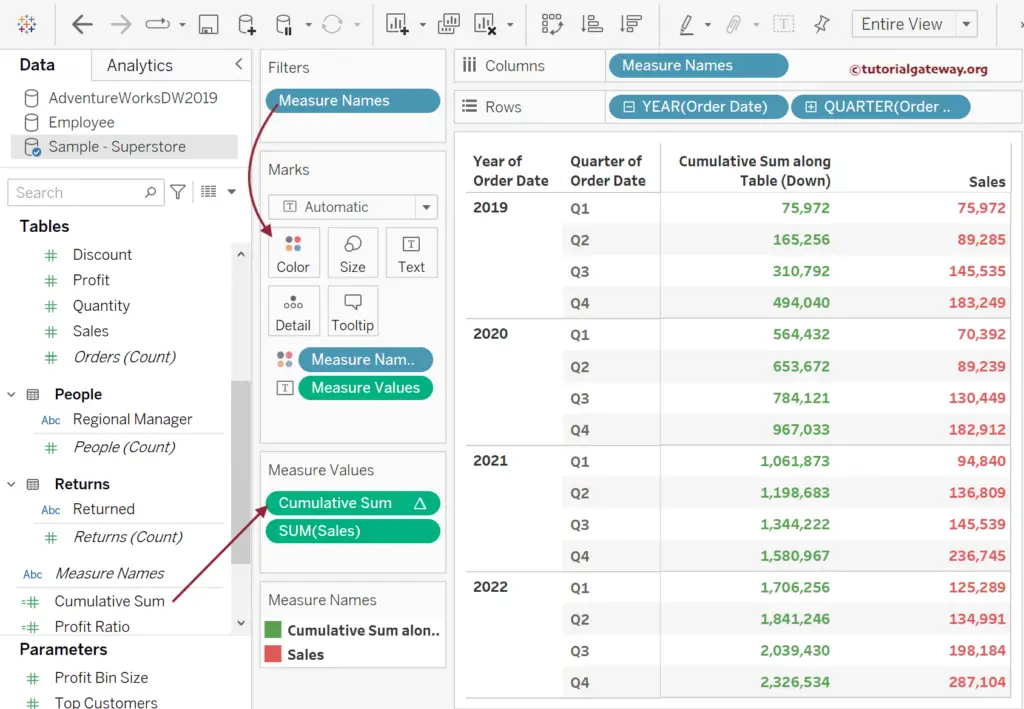
Let me choose the Compute Using to Table(down). If you observe the Tableau report, it already shows the cumulative sum for the whole Table.
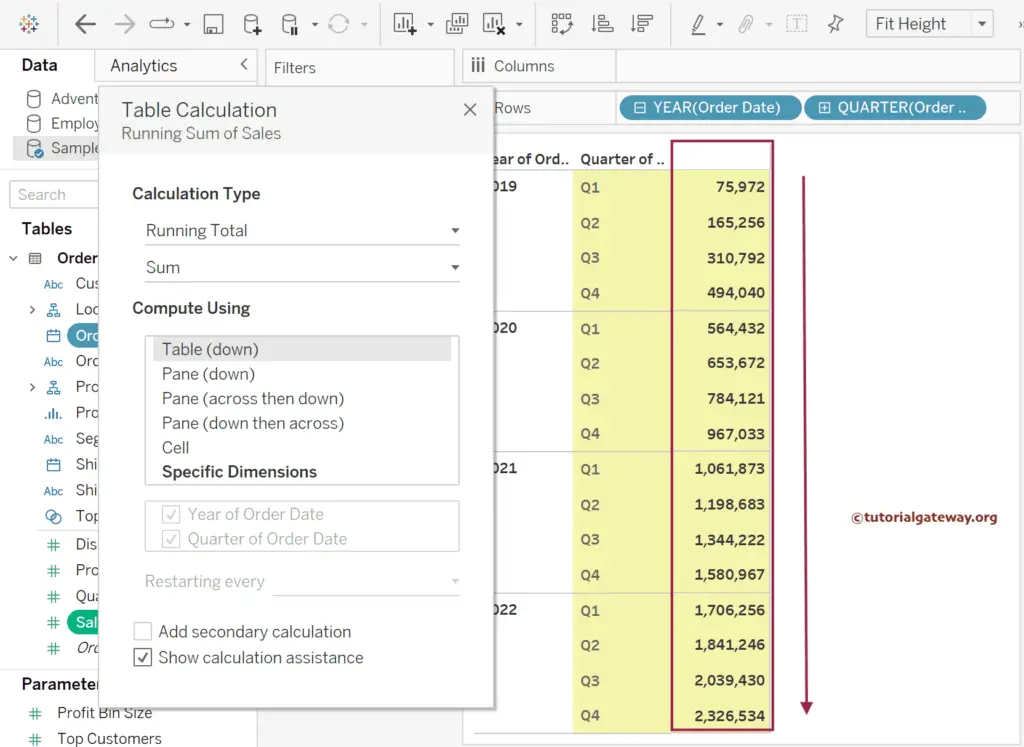
Double-click the Sales to add the Measure one more time. For instance, 2019 Q2 Sales = 75, 972 (Q1) + 89, 285 (Q2) = 165, 256. If you see the 2022 Q4 value = 2,326,534, that is the cumulative sum of all quarters from 2019 to 2022.
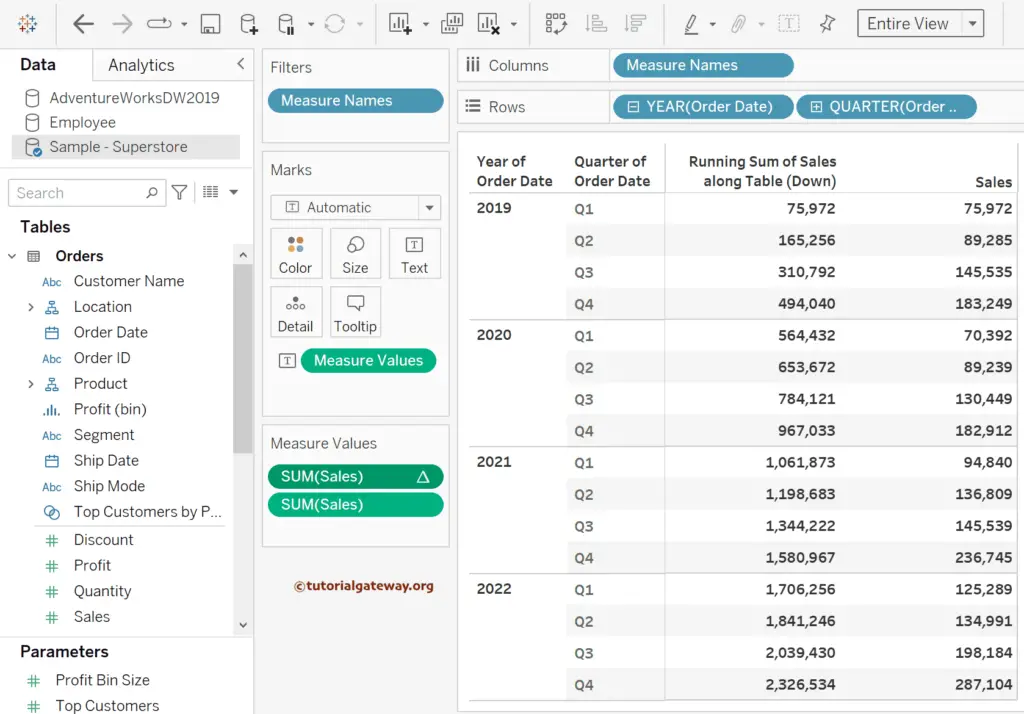
Please remove the SUM(Sales) table calculation and create a calculated field (first option). Name it as Cumulative Sum and write the following Tableau expression.
RUNNING_SUM(SUM([Sales]))
Next, add this field to Measure Values and the Measure Names to the Color Shelf. The result is identical for the two approaches.
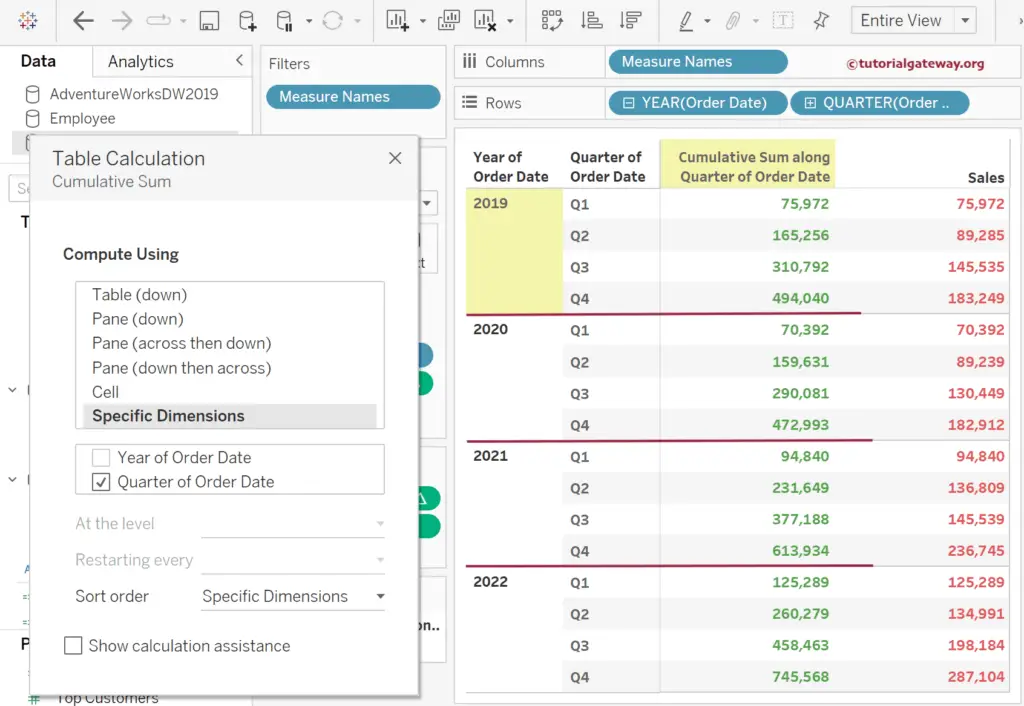
Click the down arrow beside the Cumulative Sum and choose the Edit Table Calculation option. Next, change the Table calculation from Table (down) to Specific Dimension and select Quarter of Order Date. Tableau will calculate the cumulative sum for all quarters in each year. The total value will restart each year.
TIP: Even the Pane(down) will show the same result.
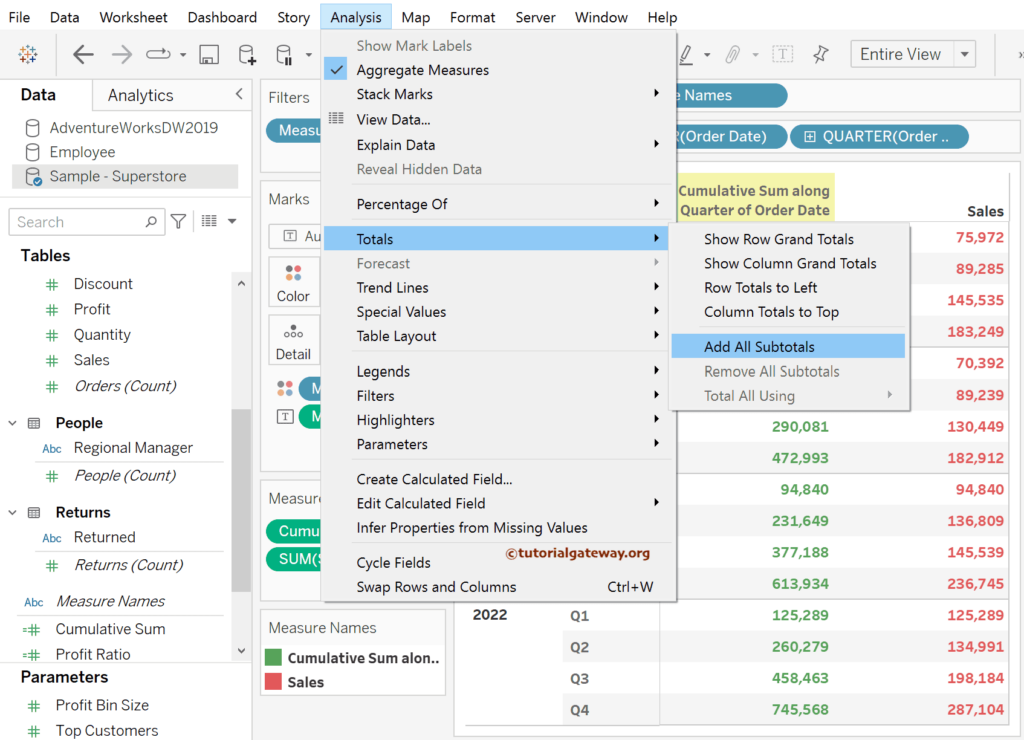
Use the Analysis Tab to add the Subtotals.
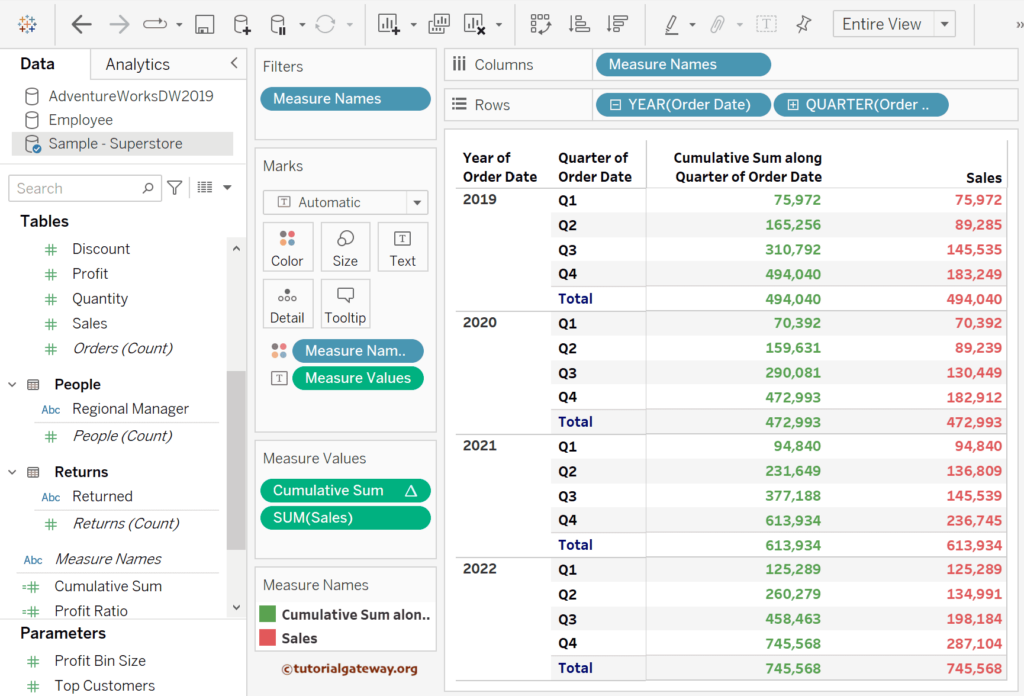
The screenshot below shows the Tableau cumulative sum result in a table with subtotals.
Let me add the Category to the Column shelf to divide the values further. The report will calculate and return the cumulative sum for each Category.
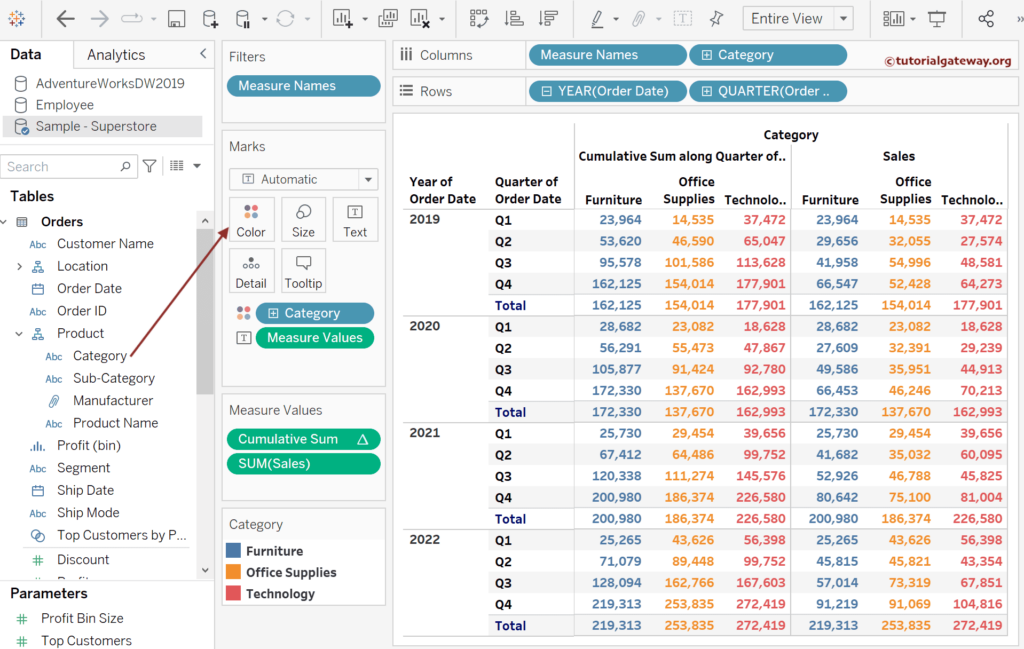
Tableau Cumulative Sum using Parameters
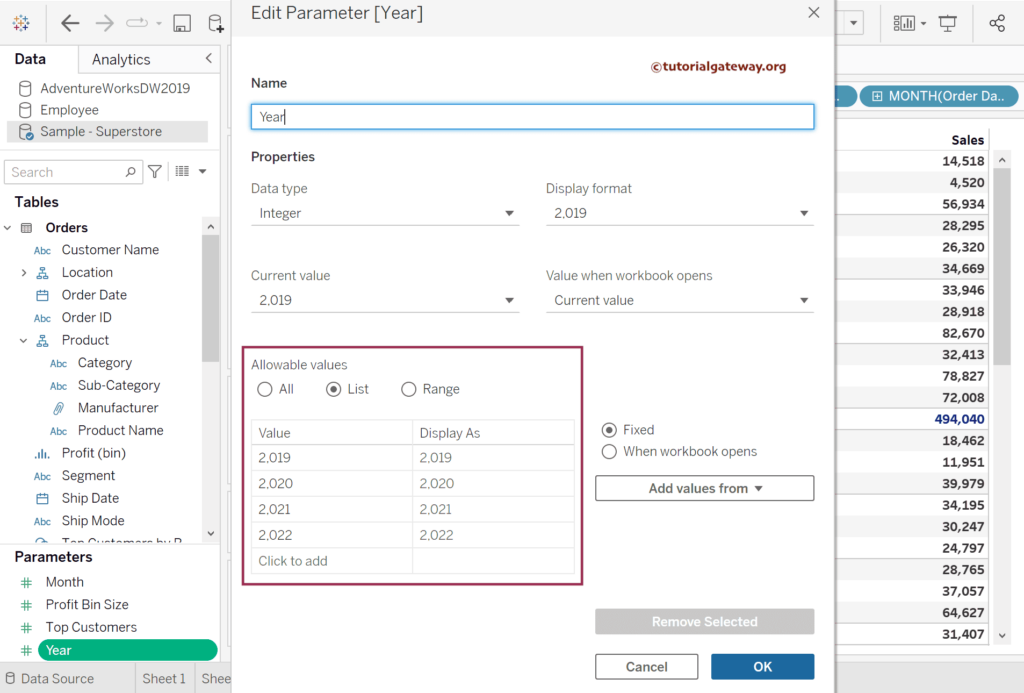
This example shows how to use the parameters as filters to display the cumulative sum of user-selected years and quarters. For this demonstration, we must create two parameters: one for the Year and the second to choose the Month number. So, use the Analysis Menu to select the Create Parameter option.
Please change the Data type to Integer and add the required year numbers to the list.
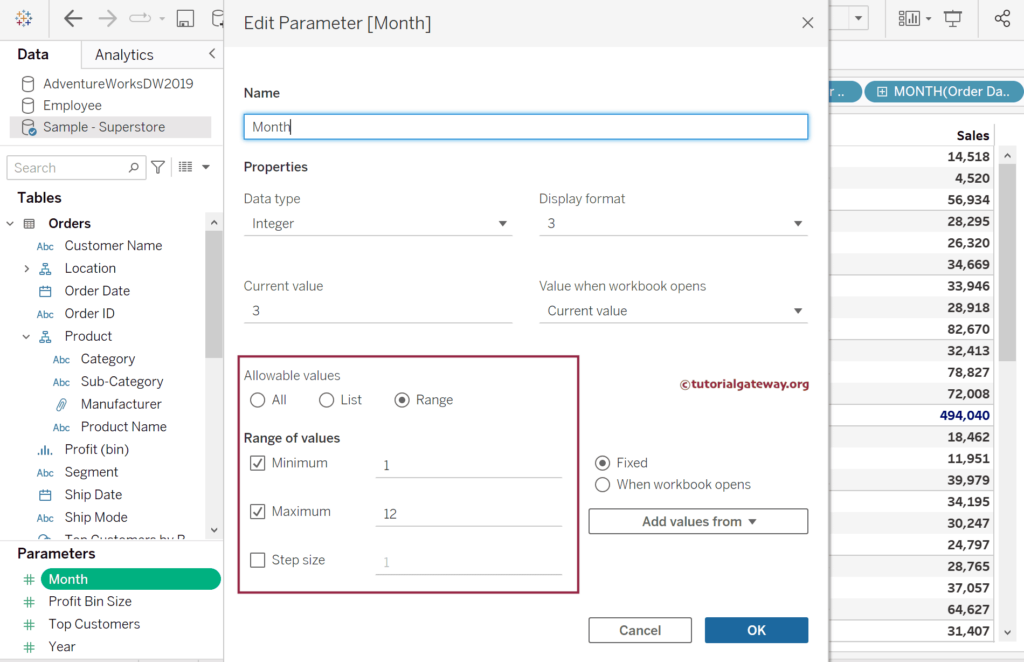
Similarly, create one more parameter for Month and choose the Range with Minimum 1 and Maximum 12 or enter the 12 numbers as the list.
The last step is to create a calculated field or edit the existing one. Let me make a new one named Cumulative Total and add the expression below. Please change the Compute using the option to Pane(Down).
RUNNING_SUM(SUM(
IF DATEPART('year', [Order Date]) >= [Year] AND
DATEPART('month', [Order Date]) >= [Month] THEN [Sales]
ELSE 0
END
))
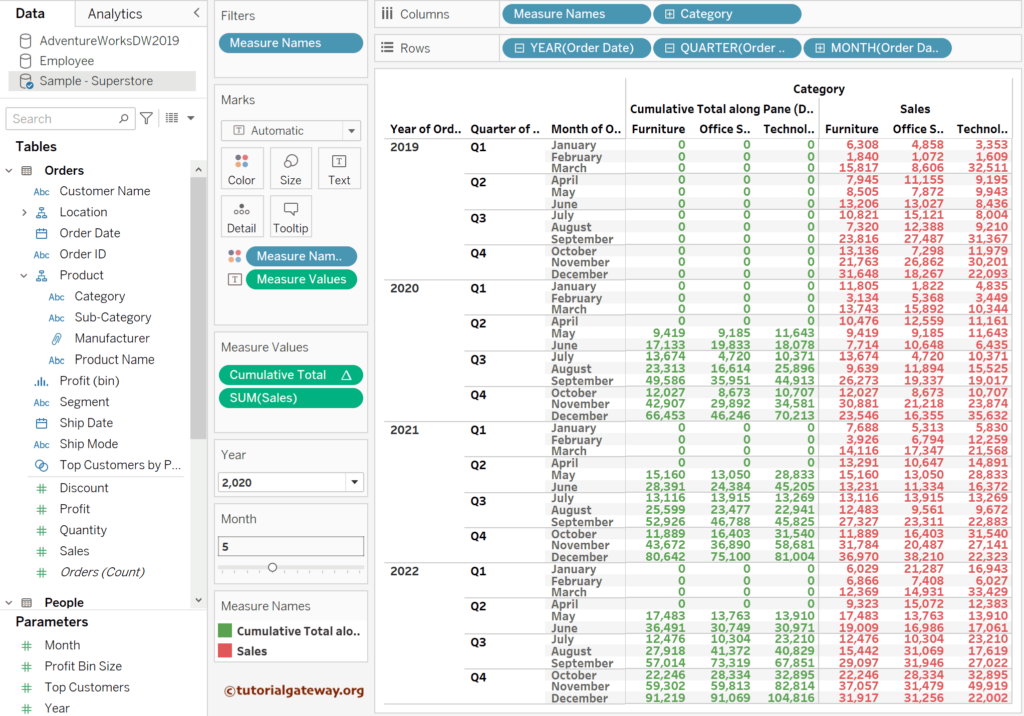
Next, click the down arrow beside the Month and Year parameters and choose the Show Parameter option from the context menu. If you observe the screenshot below, it shows Zeros for the first three months.
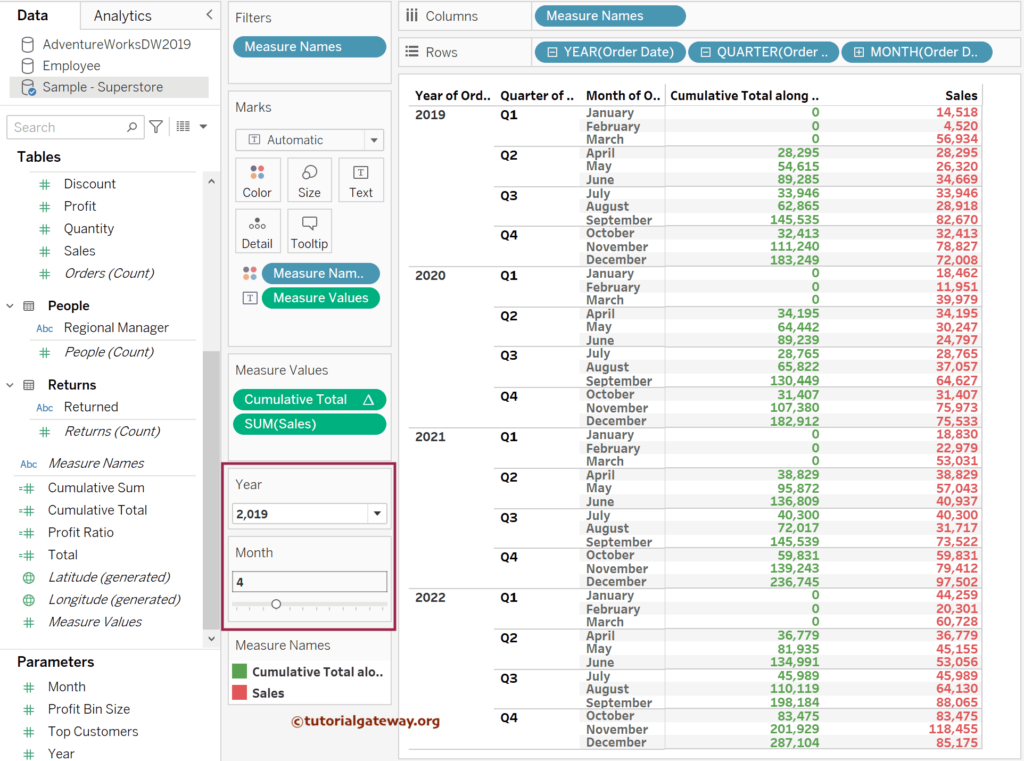
Suppose I change the Year to 2020. Tableau will calculate the cumulative sum from 2020 to 2022 for the month numbers 5 to 12.
