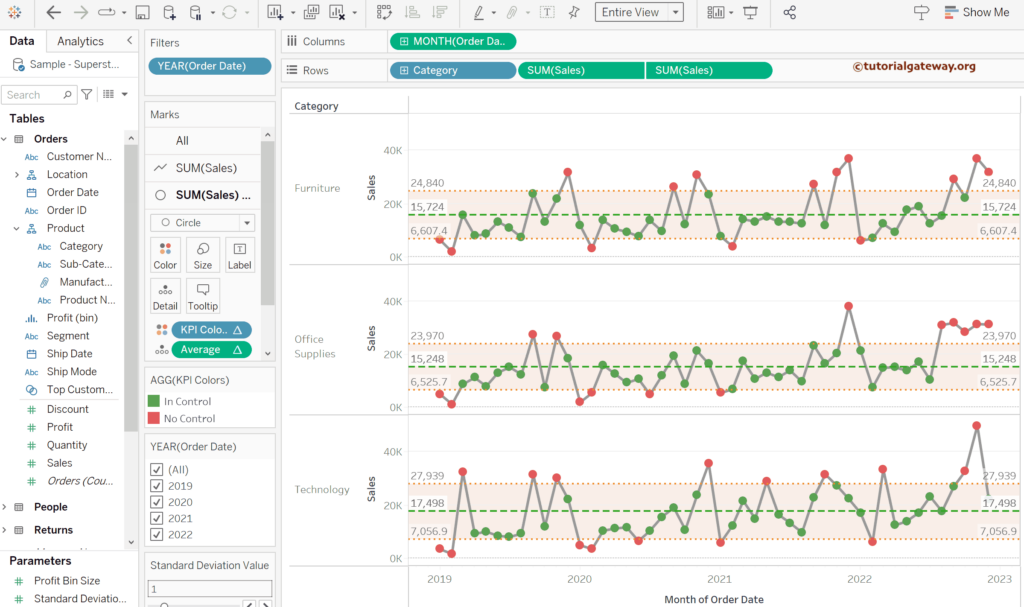
The control chart in Tableau helps study the sales or profit changes over time. It always has an average line (Central), the upper control line for the upper limit (Maximum), and the lower control line for the lower limit (Minimum). One can consider the values above the upper control and below the lower control as abnormal and should focus on that area. This article shows the steps involved in creating a Tableau control chart with an example.
To demonstrate this Tableau control chart example, we used the Sample Superstore Excel sheet. Please visit the Excel Source article to understand the Data Source.
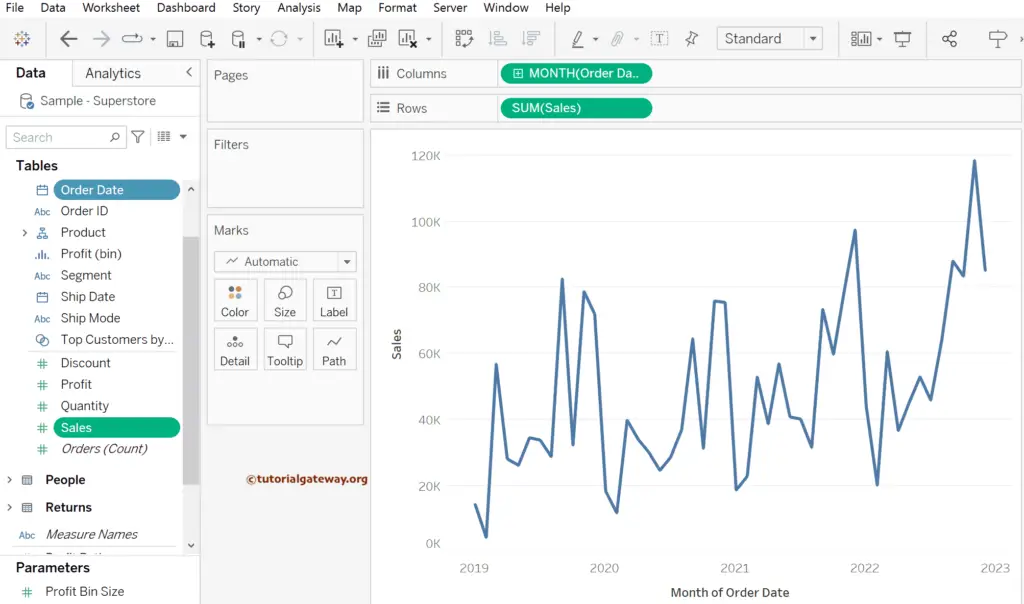
Drag and drop the Sales Measure to the Rows shelf and the Order Date field to the Columns Shelf. Next, click the down arrow beside the YEAR(Order Date) and choose the MONTH (instead of Year). By default, it creates a line chart. For the remaining charts in Tableau, please click here.
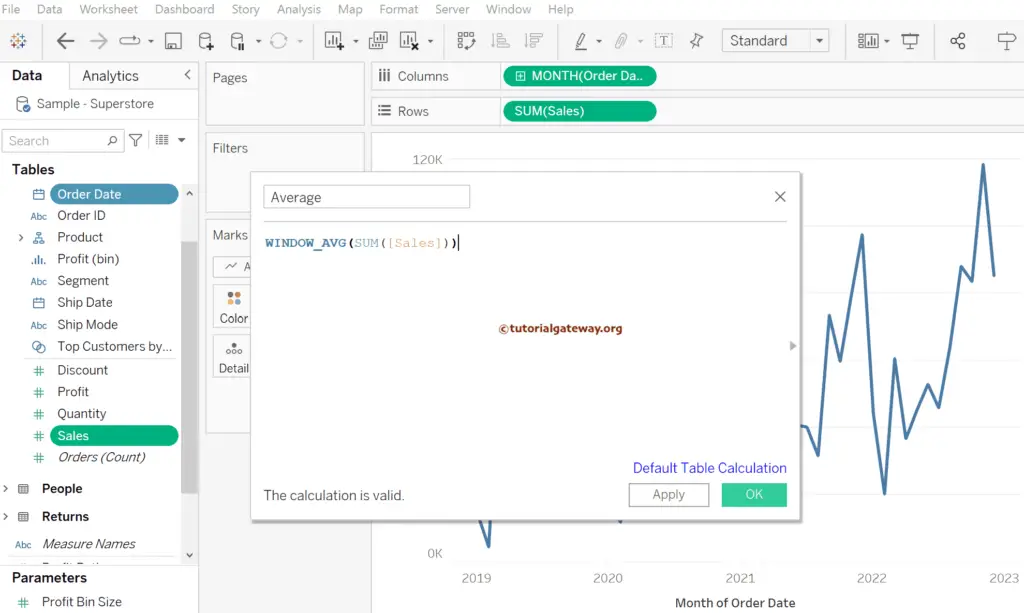
Our job is to create a Tableau control chart; for this, we need to find the window average. So, we need a calculated field to write the expression. To do this, right-click the empty space within the Measures shelf to select the Create Calculated Field.. option. Otherwise, use the Analysis Menu option.
How to Create a Tableau Control Chart?
The below expression will return the window average (whole report or table) of the sum of sales.
WINDOW_AVG(SUM([Sales]))
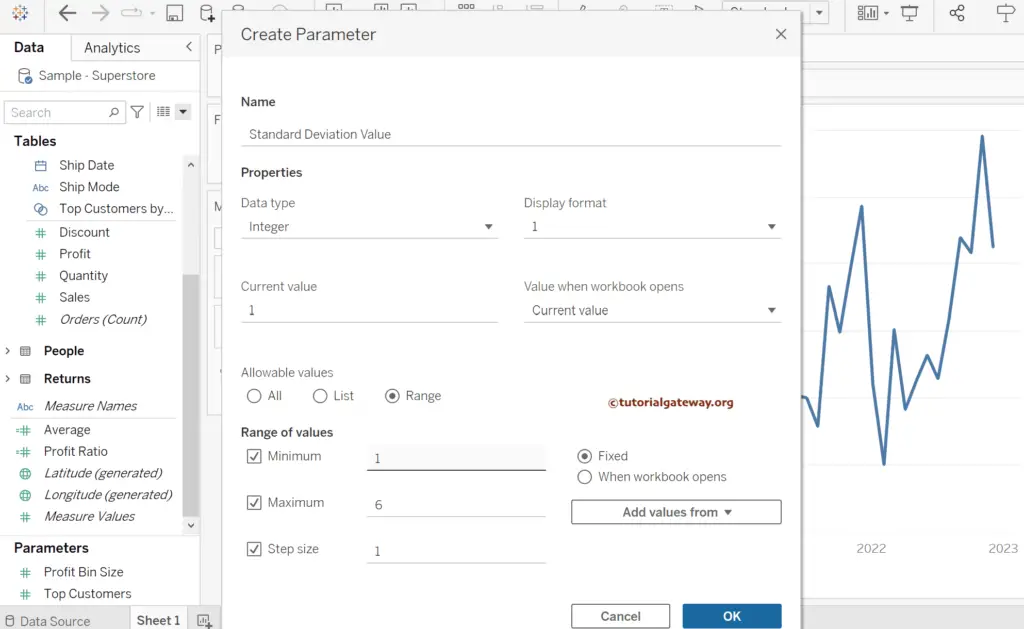
Instead of using the fixed value as the Tableau Control Chart standard deviation, we will create a parameter that user can choose their own value. To do so, right-click on the Measures shelf empty space and select the Create Parameter option to open the following window.
Let me use the Standard Deviation Value as the parameter Name, integer as the Data type, and use the range of values from 1 to 6 of step size 1.
Next, create two more calculated fields for the Upper Limit and Lower Limit of Tableau Control Chart with the corresponding expressions.
Upper Limit
[Average] + [Standard Deviation Value] * WINDOW_STDEV(SUM([Sales]))
Lower Limit
[Average] - [Standard Deviation Value] * WINDOW_STDEV(SUM([Sales]))
To use these calculated fields in the reference lines, we need them to be in any part of the Tableau Control Chart. So, drag the Average, Upper Limit, and Lower Limit calculated fields to the details section of the Marks shelf. Next, click the down arrow beside the Standard Deviation Value parameter and choose the Show Parameter option from the context menu.
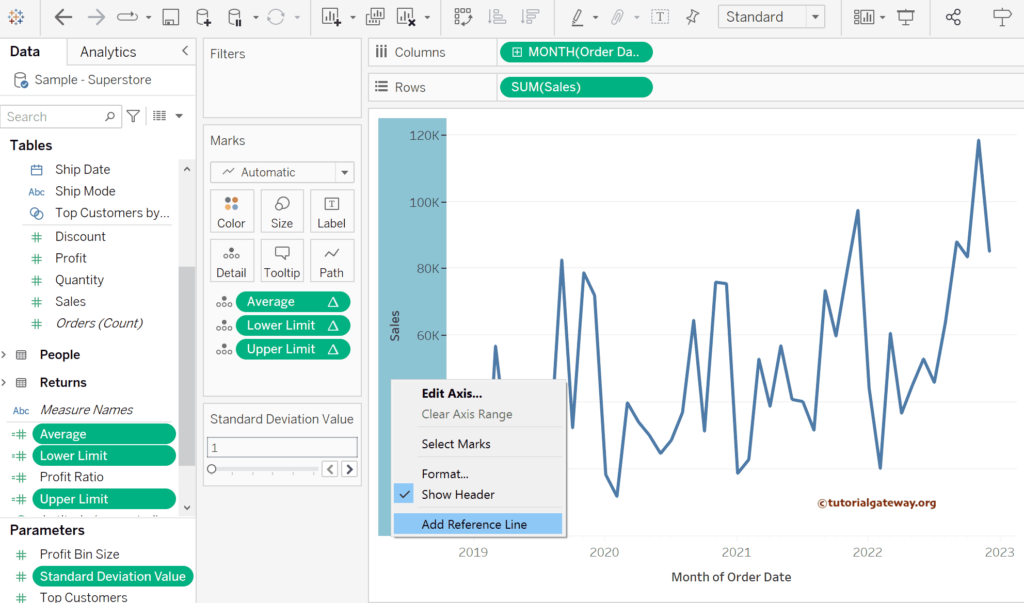
If you observe the below report, it looks the same with no changes. The next big step in creating a Tableau control chart is adding reference lines. So, right-click on the Sales Axis (Y-Axis) and choose the Add Reference Line option.
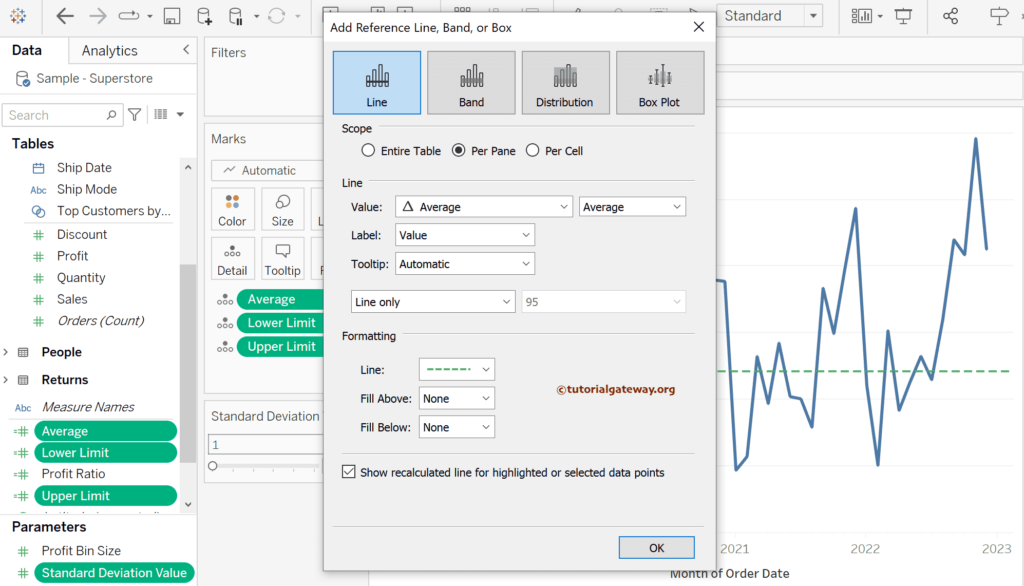
It opens the following Add window. Please use this window to add reference lines to the line chart. First, let me choose the per pane scope value as the newly created calculated field, i.e., Average, and label it as value. Next, we used the green dotted line to show the sales average line. You can notice the same in the report as well.
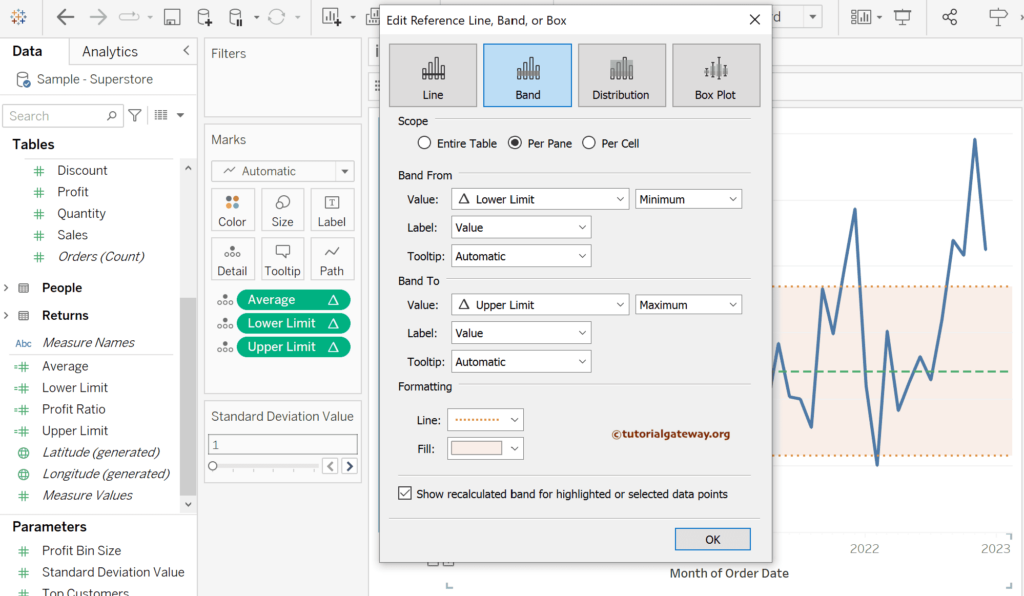
As we need the lower and upper limits, Please edit the reference line, choose the Band option, and set the from value as the Minimum Lower Limit and to value as the Upper limit maximum value. Do some formatting to see them in action.
Add Colors to the Tableau Control Chart
It will create a control chart with a lower limit, average, and upper limit area. However, the chart looks brilliant if you can show the interaction points. So, add the Sales measure to the Rows shelf again. Next, click the down arrow beside the SUM(Sales) and choose the Dual Axis option.
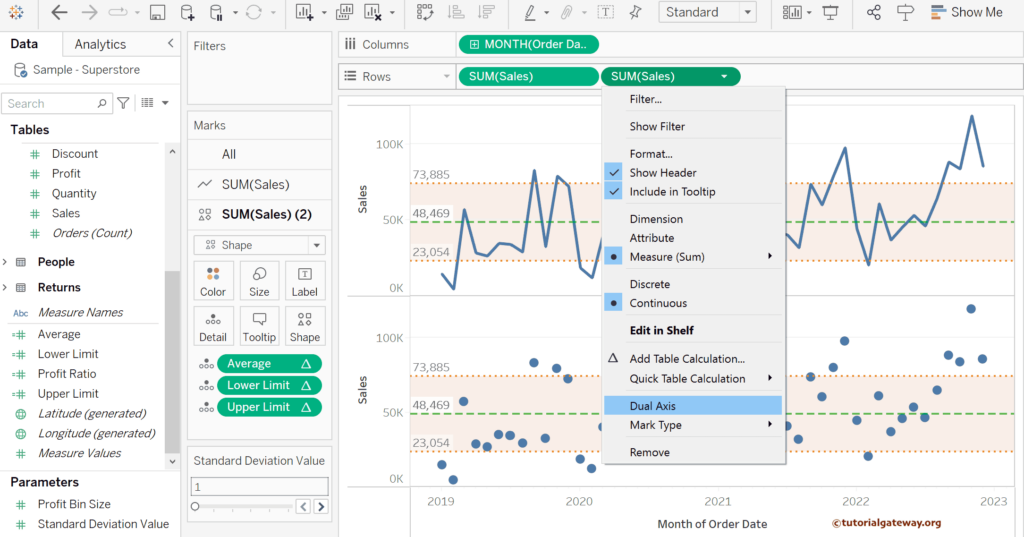
Next, right-click the right side Y-Axis and choose. Synchronize the Axis and uncheck the Show Header option. It will add a dotted circle at each intersection point. With the help of the calculated field, you can add the colors to the dots. I mean red for the out-of-scope sales and green for those within the lower and upper limits.
For this, create a new calculated field with the IF Else expression below. Print the No control message for anything above the upper limit and lower limit; for the remaining, print the In control message.
IF SUM([Sales]) > [Upper Limit] OR SUM([Sales]) < [Lower Limit]
THEN 'No Control'
Else 'In Control'
END
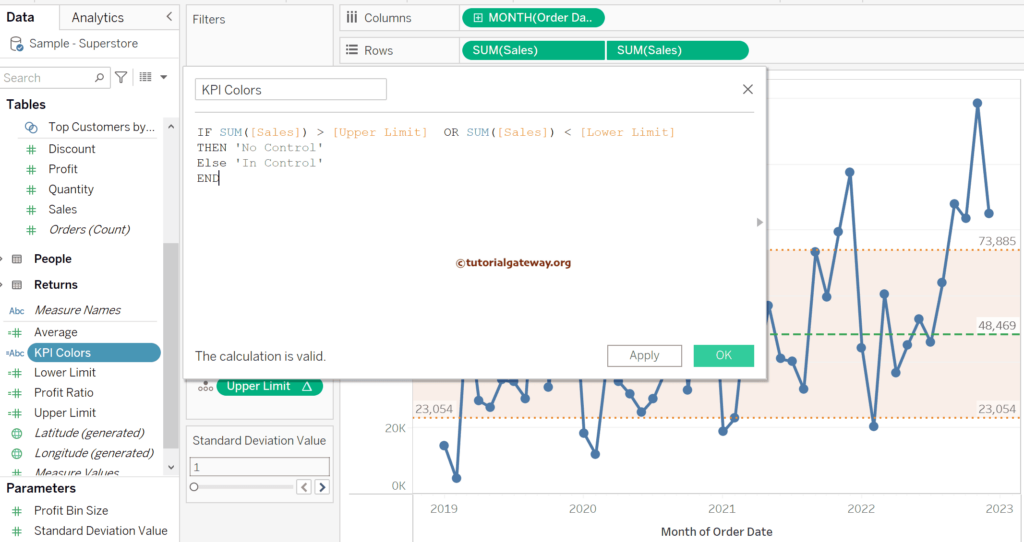
Please add the newly created KPI Colors calculated field to the Color shelf to see the Tableau Control chart.
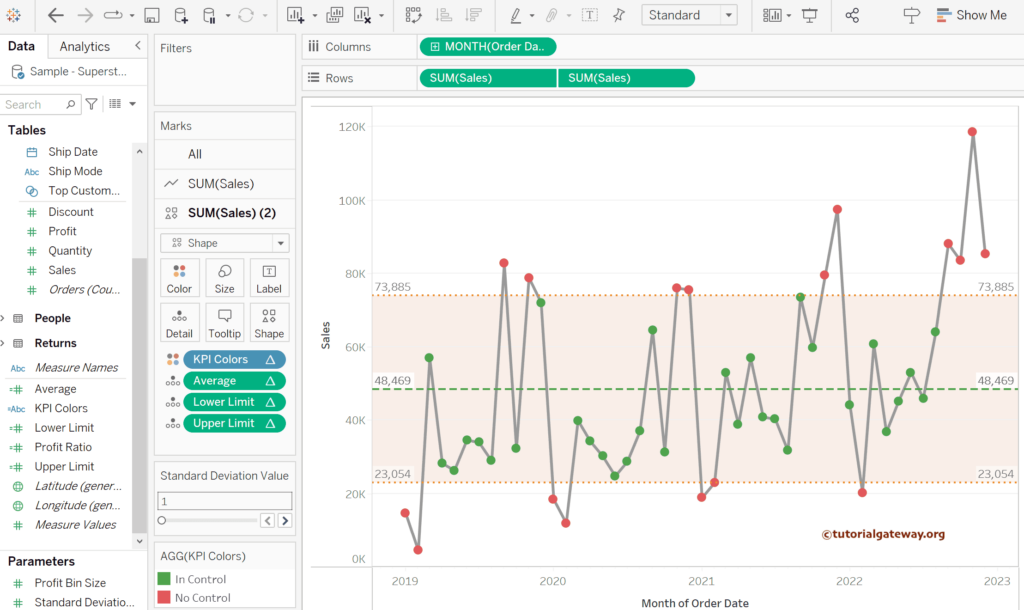
Note: As we used the integer as the parameter data type and step value as 1, it will be difficult to check the standard deviations for the decimals. So, please edit the parameter and change the Data type to Float and the step value to 0.1.
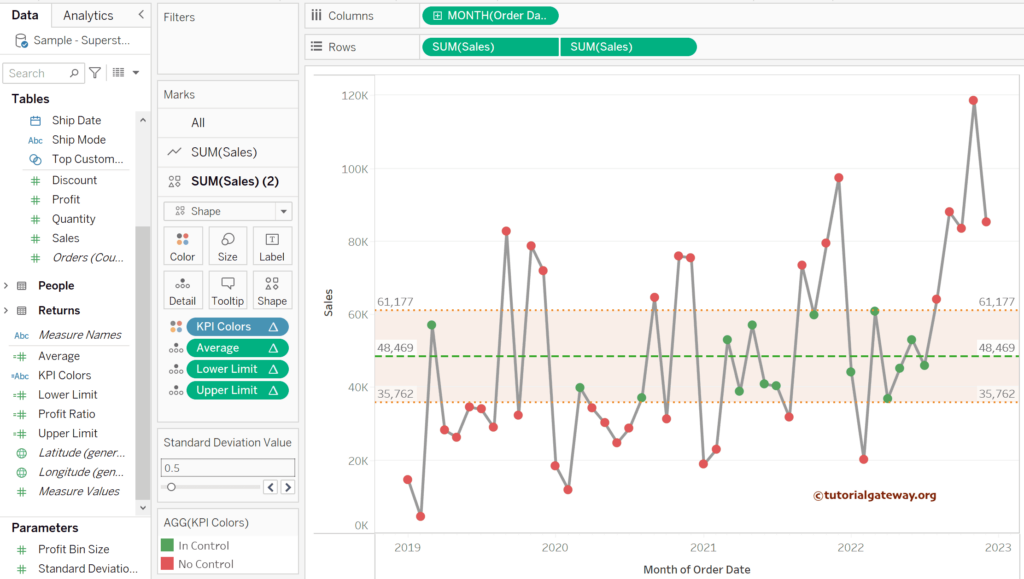
Let me change the Standard Deviation value to 0.5 and see the changes in the average, lower, and upper limits with the amount of red and green dots.
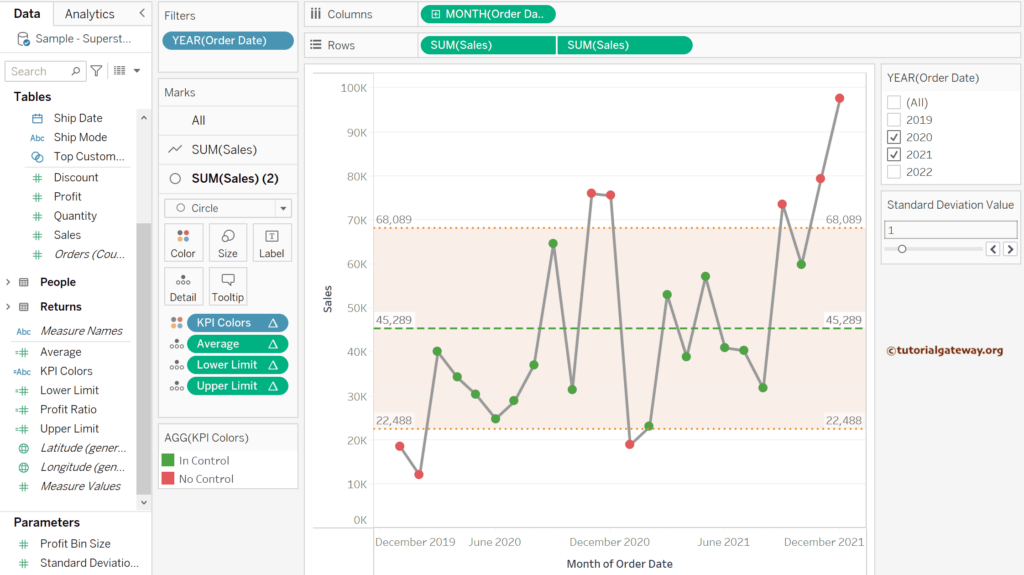
Apart from the above filter, let me add the Order Date to the Filter shelf and choose Year. Next, click the down arrow beside it and select the Show Filter option to see the sales for the chosen years. To demonstrate the Tableau Control Chart with filters, let me check the Years 2020 and 2021.
Add any higher-level dimension, such as the category. You can see the multiple control charts in Tableau, each representing a category.
