This article shows how to create a Tableau circle timeline of order date with an example. It is helpful to show the sales or profit timeline.
How to Create a Simple Circle Timeline in Tableau?
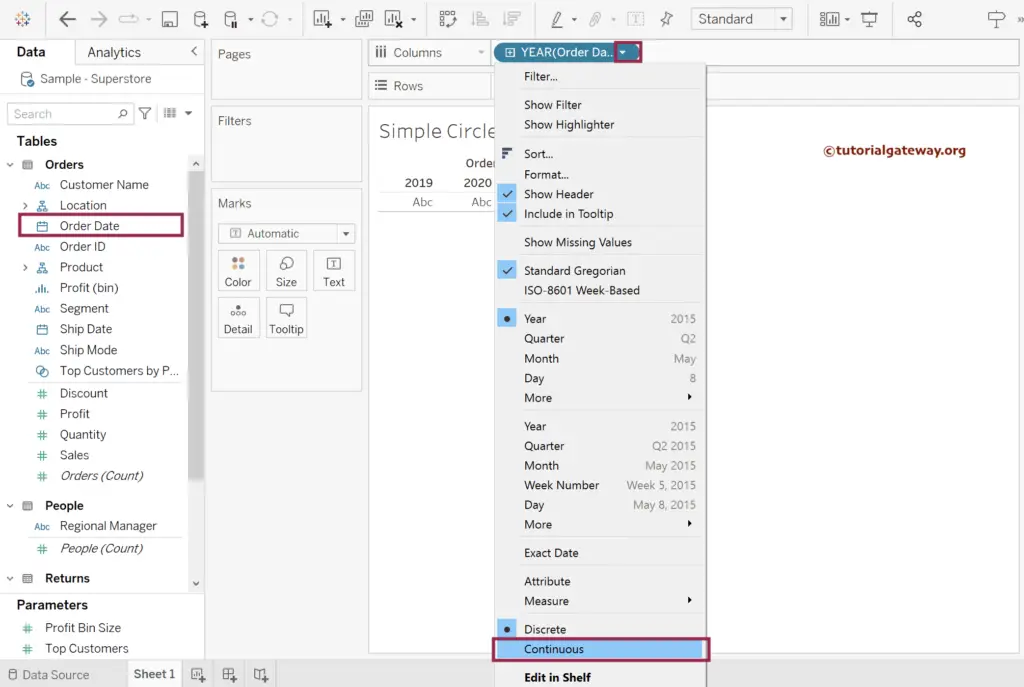
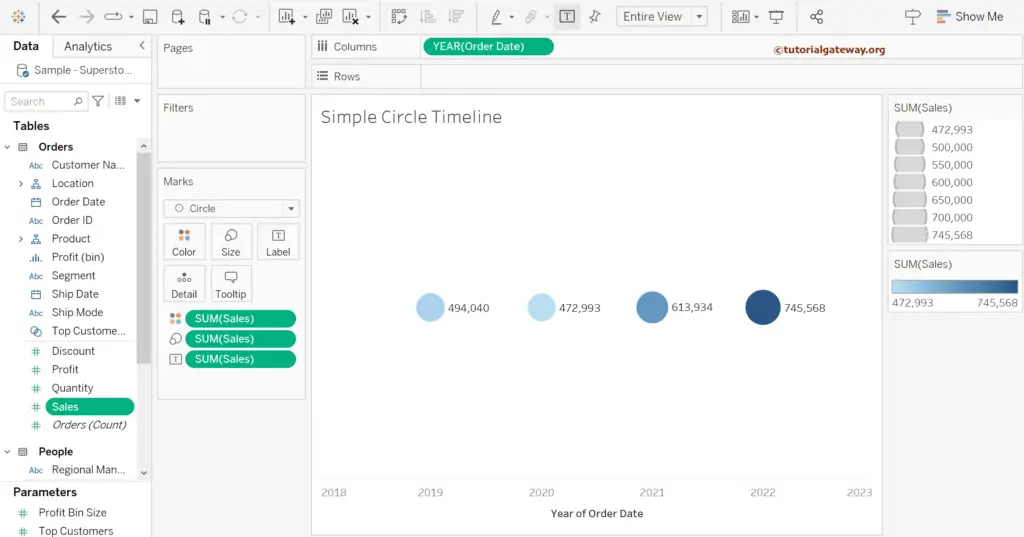
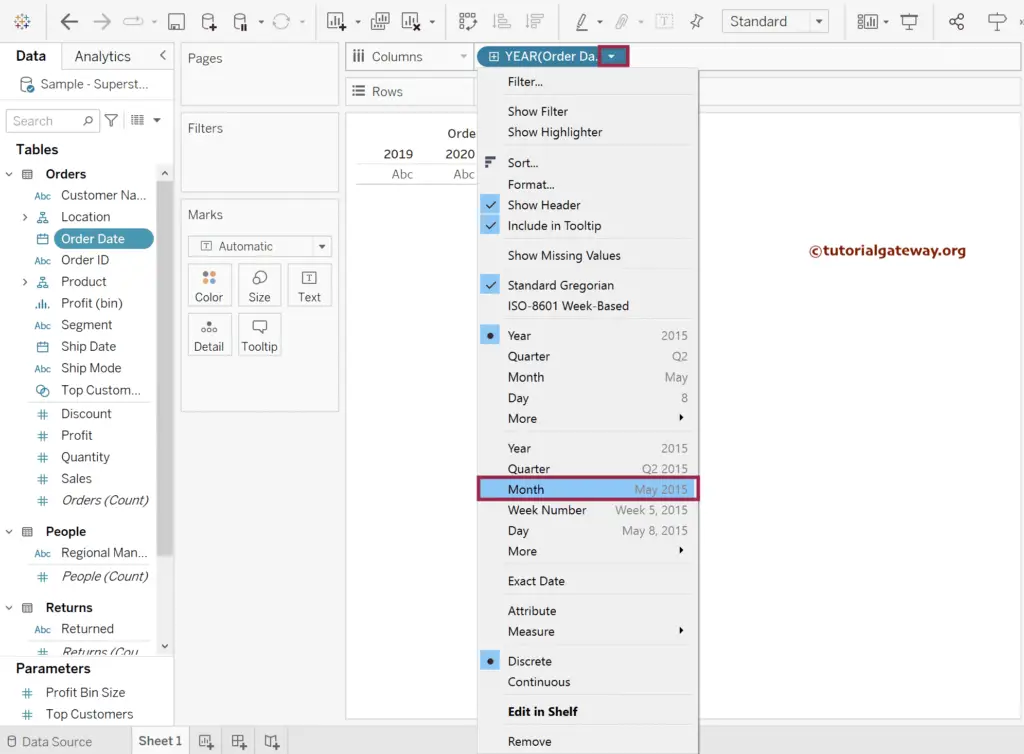
Drag and drop the order date to the column shelf and click the down arrow to change it from Discrete to Continuous.
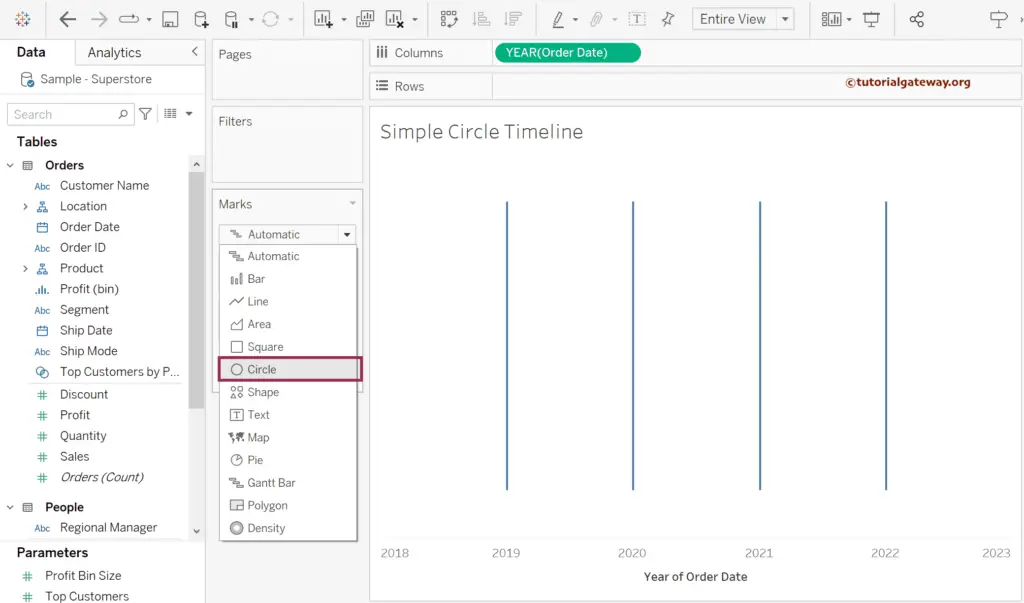
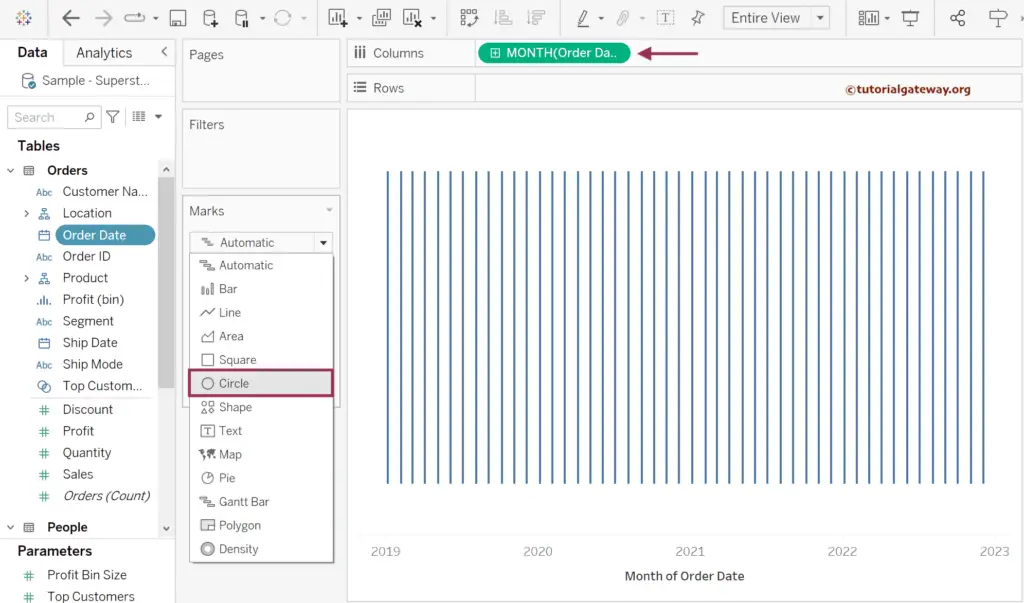
To Create a Simple Circle Timeline in Tableau, please change the Marks from Automatic to Circle.
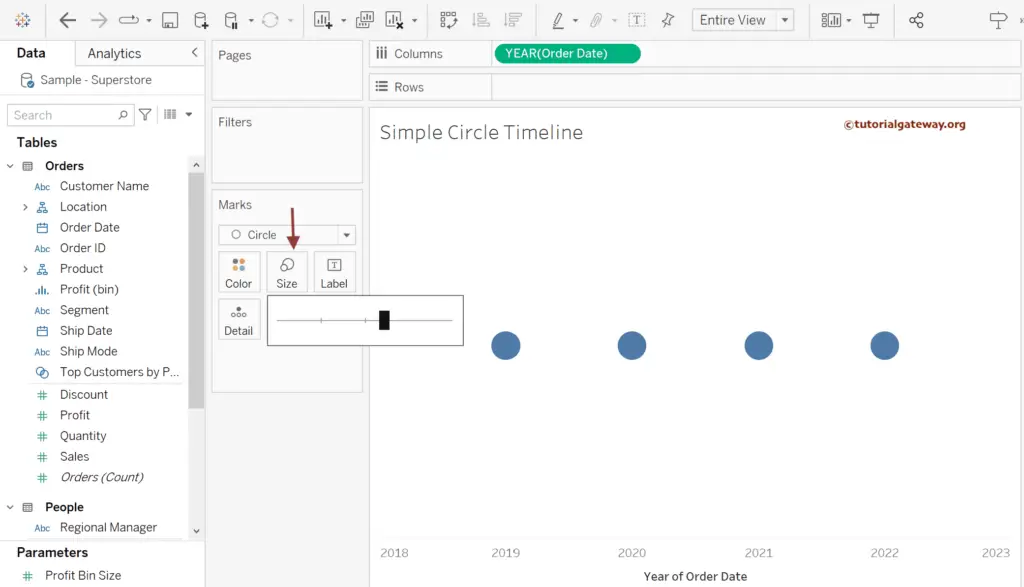
We are using the size help to increase the size of the circles.
Drag and drop Sales to Color, Size, and Label Shelves. It means the circle color and size depend on the Sum of sales and adds a data label to the circle timeline.
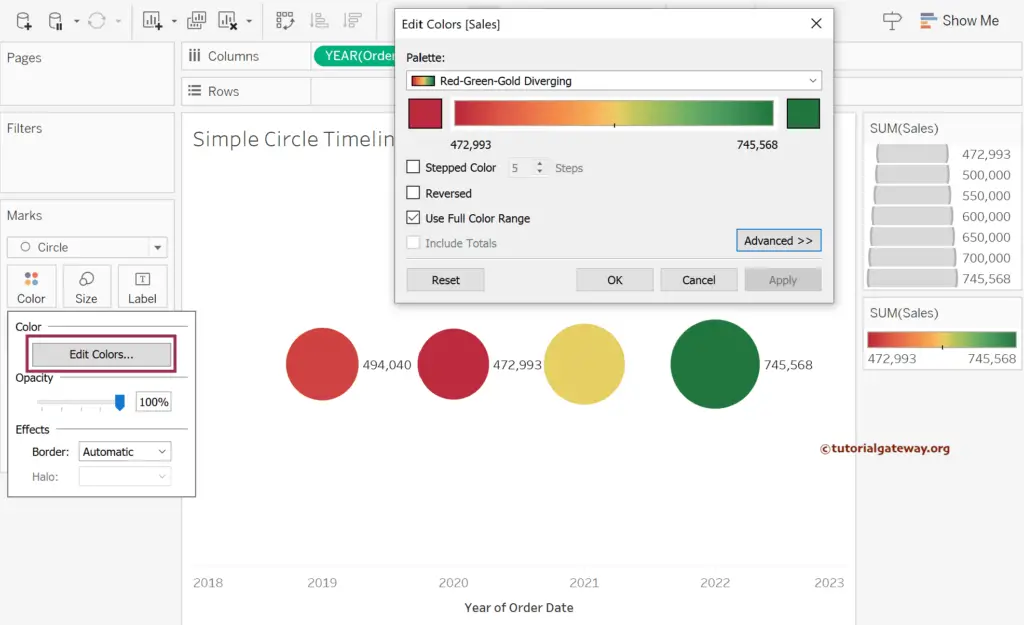
Expand the Color shelf and click the Edit Colors button to change the Palette.
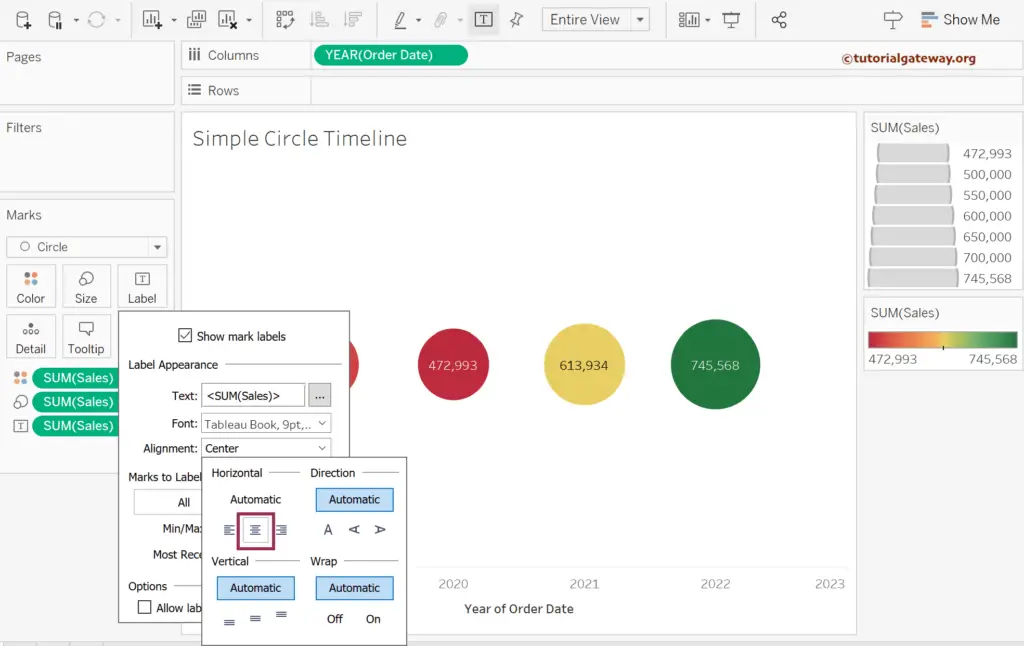
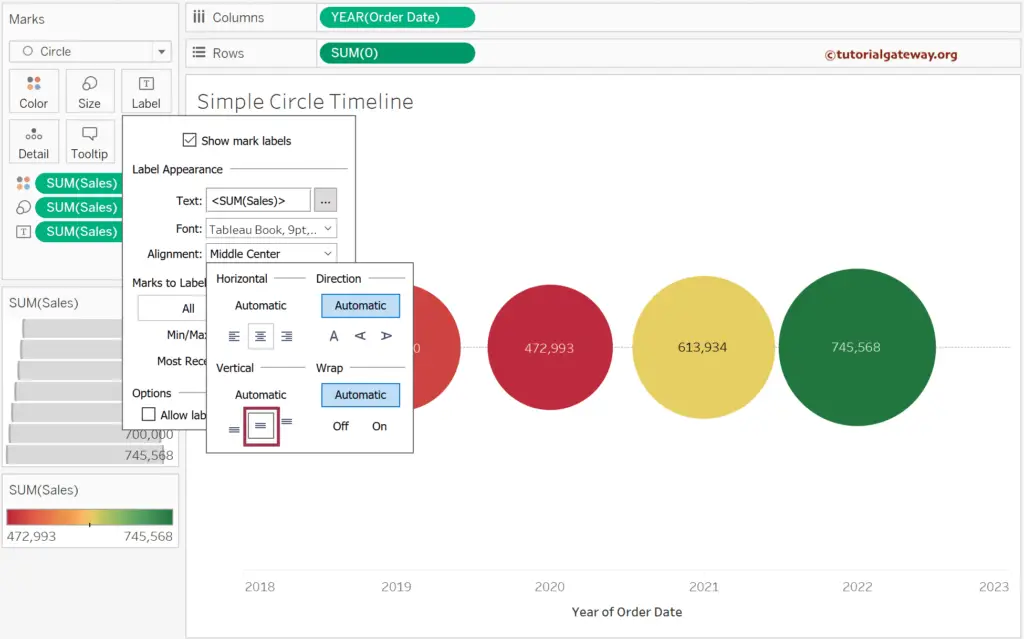
Expand the label shelf and change the Horizontal alignment to the Center to place the data labels inside the circle timeline.
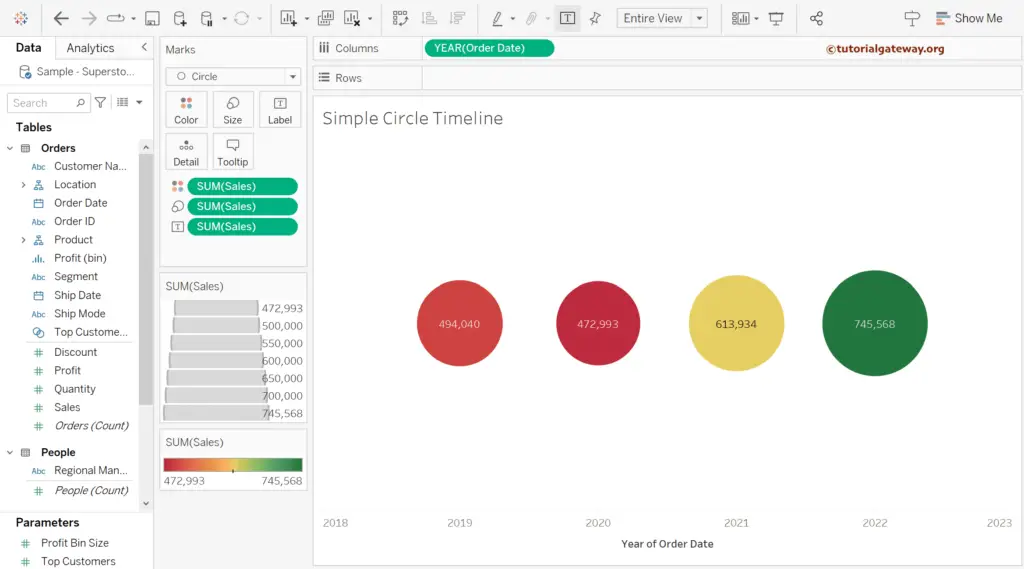
The below screenshot shows the Simple Circle Timeline on the Tableau desktop.
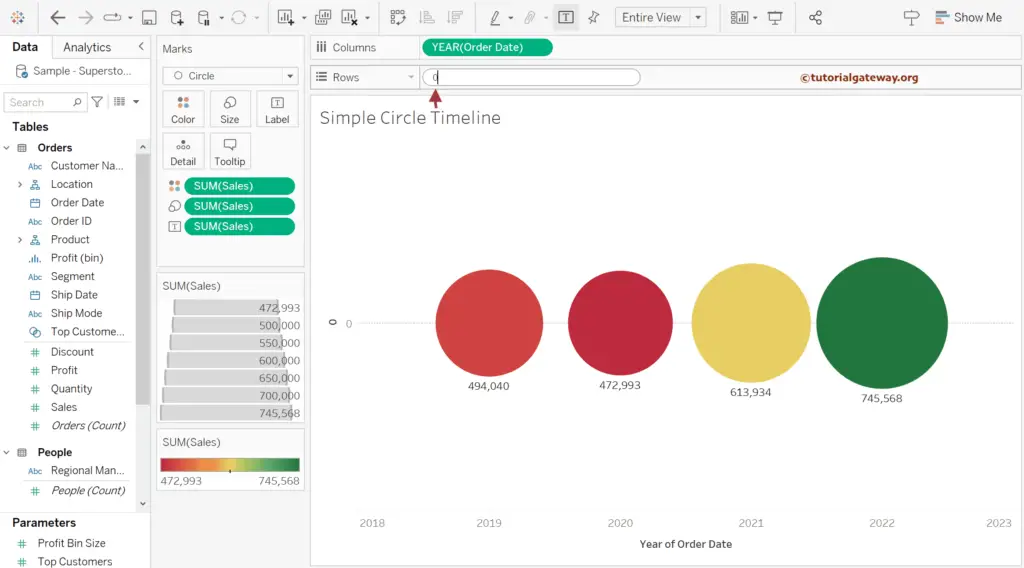
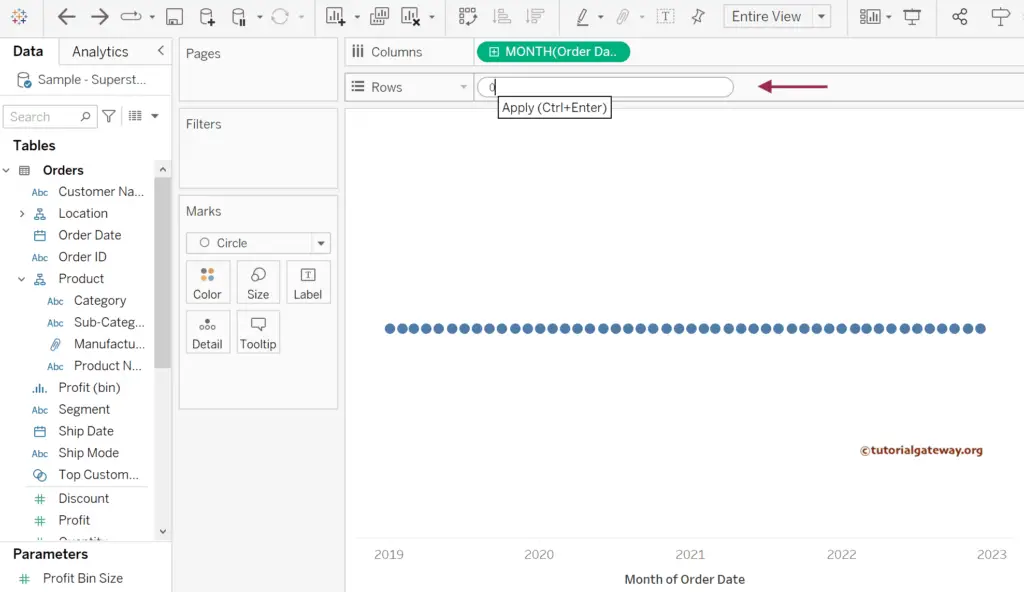
Let me add the axis line at the center. To do this, double-click the empty space in the rows shelf and add 0. Otherwise, create a calculated field with a 0 value.
Please change the Vertical alignment to the center to put the data labels inside the circles. In some cases, you have to adjust the circle sizes as well.
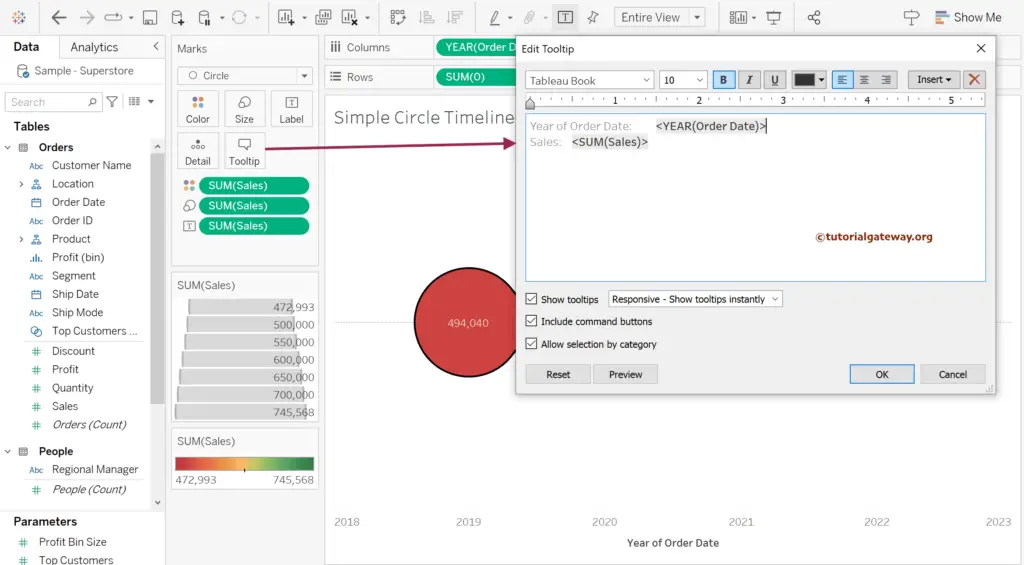
By default, the zero axis value will also show in the Tooltip, so edits the Tooltip and remove it.
The final output of the Simple Circle Timeline in Tableau is.
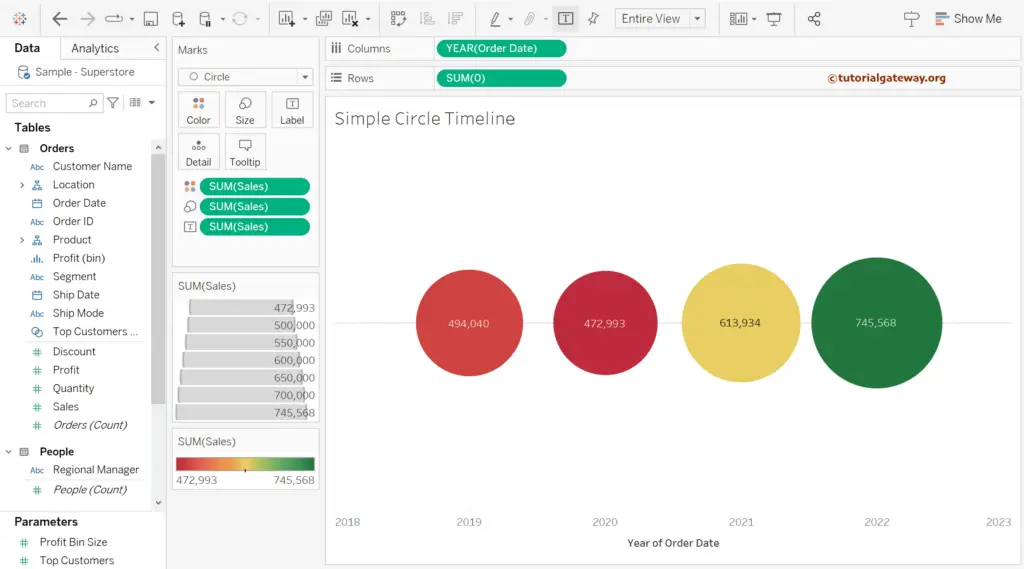
Tableau Circle Timeline of Month Calendar
First, drag and drop the order date to the column shelf and click the down arrow to change it from Discrete Year to Continuous Month.
Next, change the Marks from default Automatic to Circle to create a Tableau Circle Timeline.
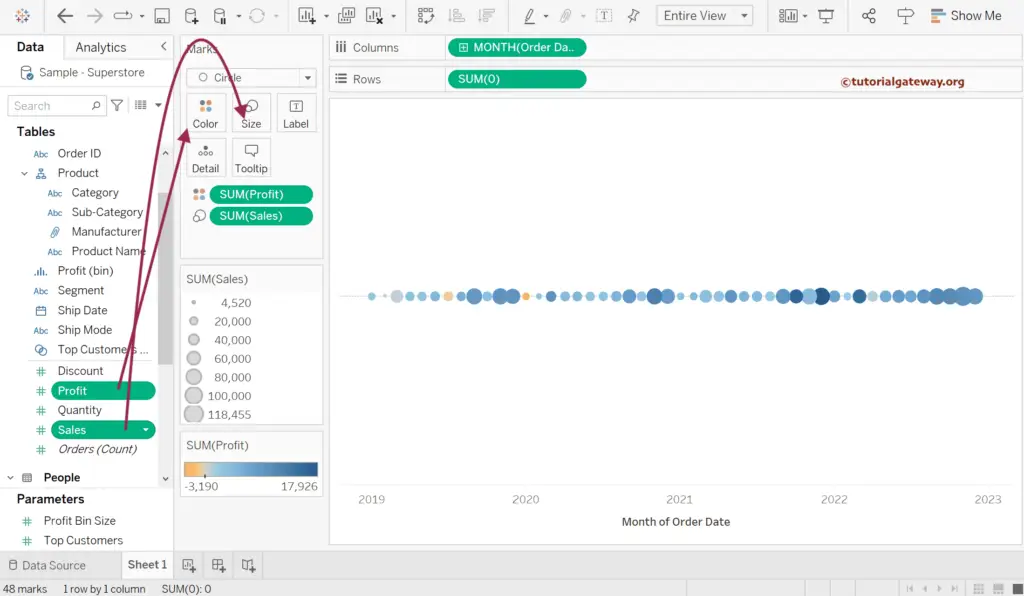
Double-click the empty space beside the rows shelf and add 0 or create a calculated field with any name and 0 as a value.
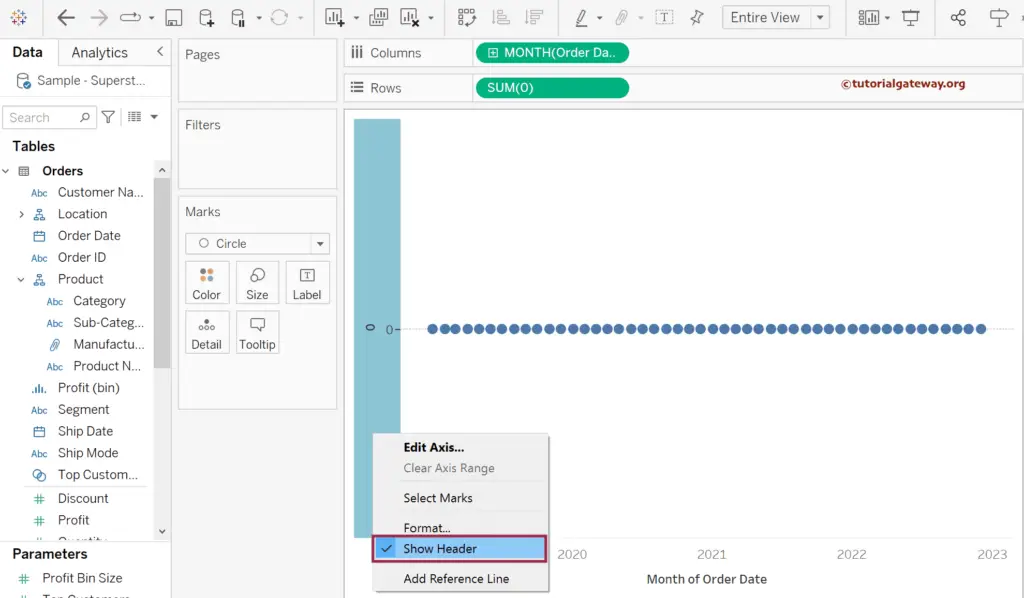
Right-click on the axis and uncheck the Show Header option to remove the axis for this 0 calculated field.
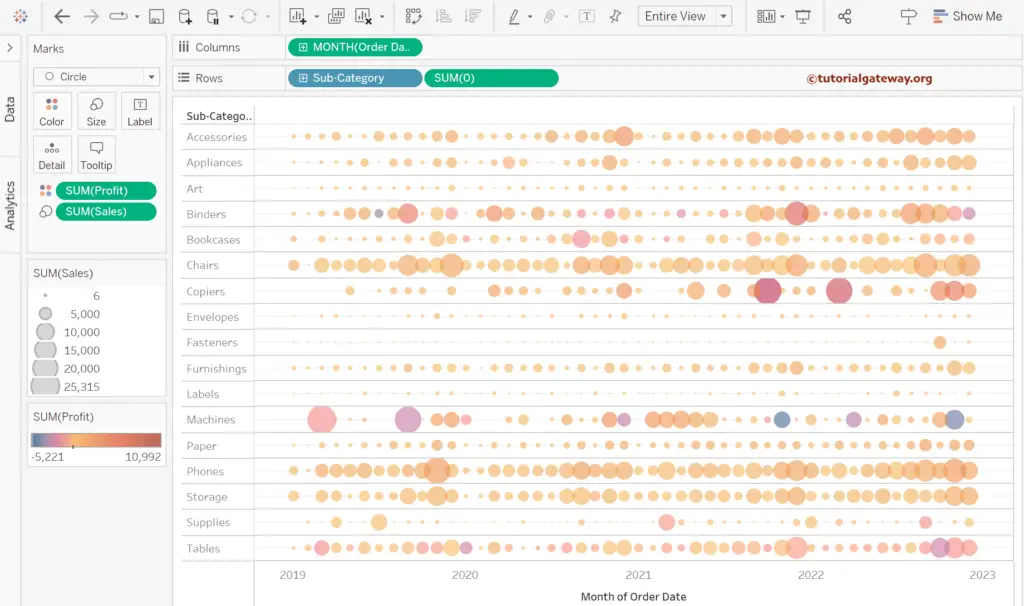
Drag and drop the Profit to the Color shelf and Sales to the Size Shelf to generate a circle timeline. You can also use the Sales measure for the color.
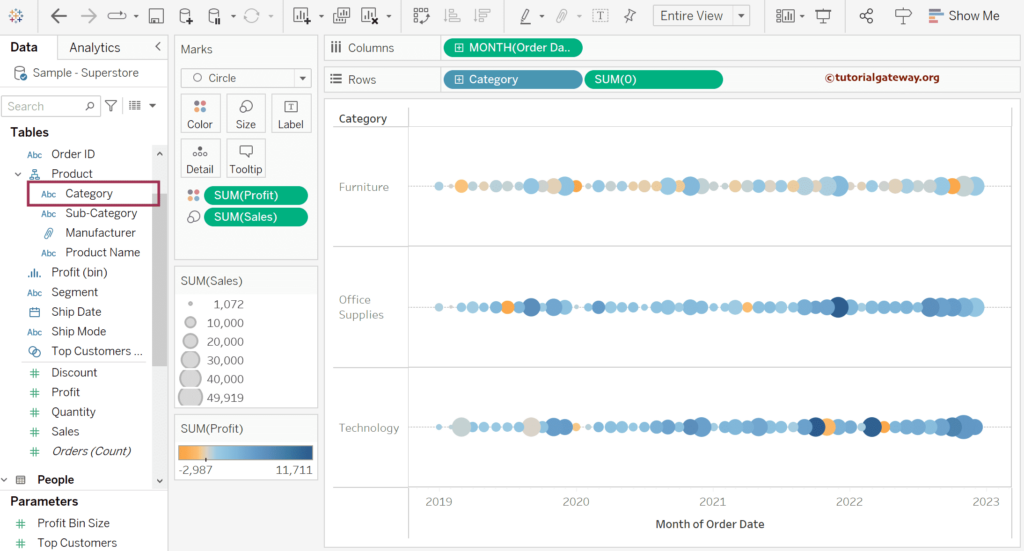
Let me drag the product category to the Rows shelf to display category sales in the circle timeline.
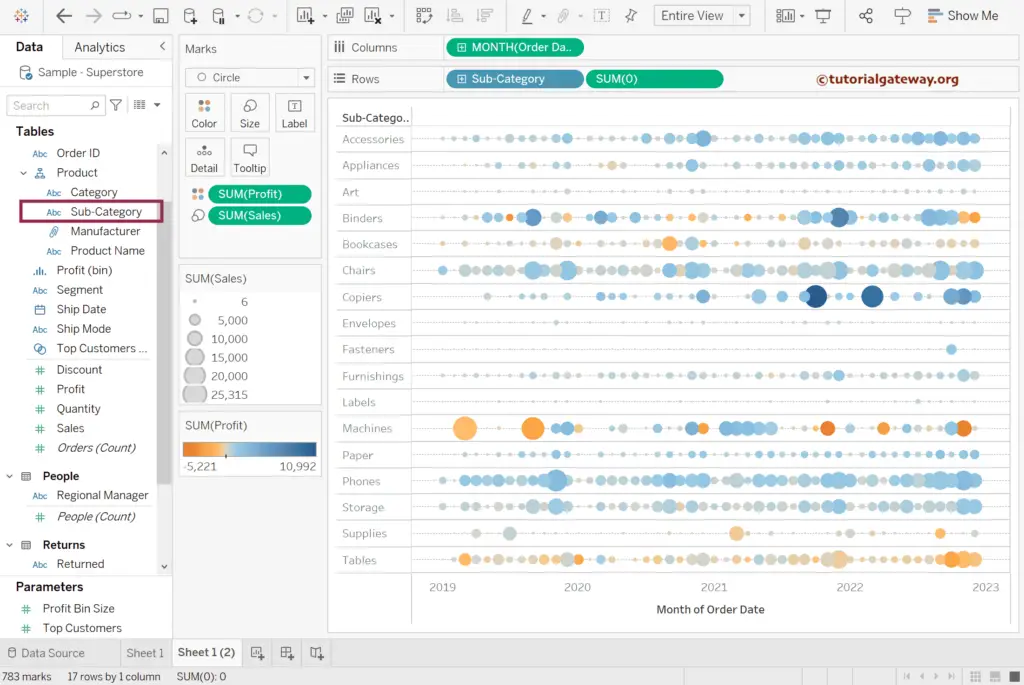
If we replace the Category with a product Subcategory, you can see the circle timeline for subcategories.
Expand the Color shelf to change opacity and click the Edit Colors button to change the Palette or colors of the circle timeline.
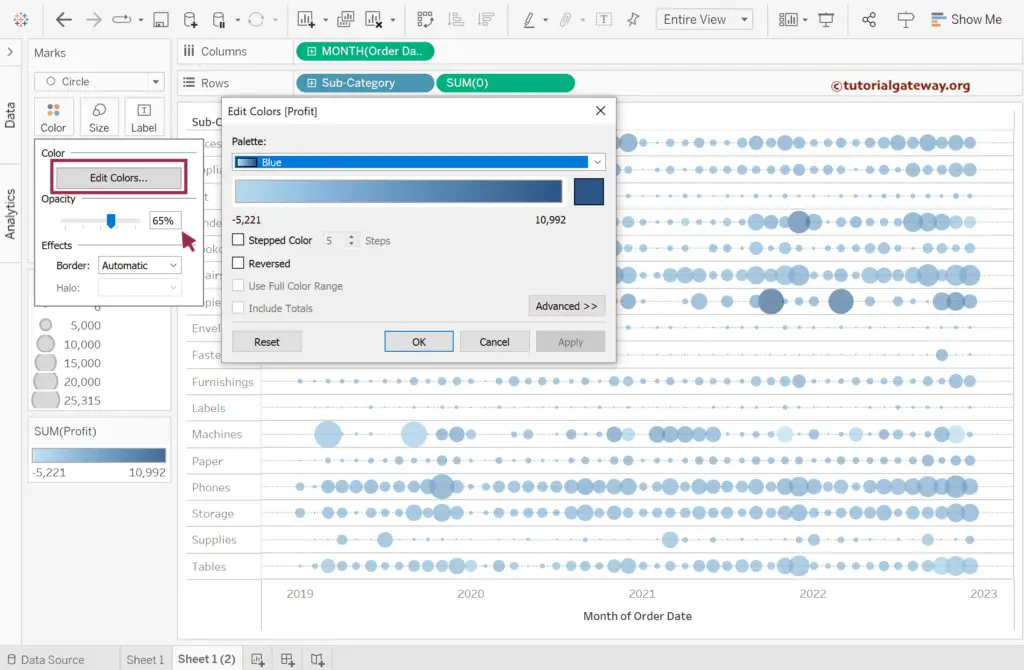
Use the Size shelf to extend or shrink the circle sizes.
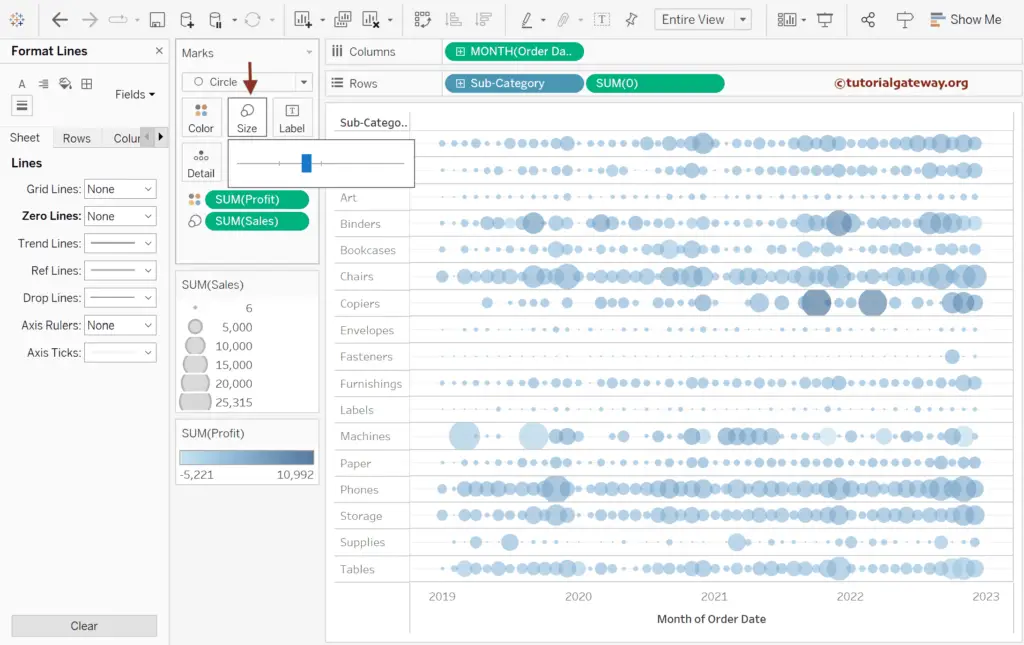
The below screenshot shows the Tableau Circle Timeline for order date months.