How to Format Map with an example?. Formatting Power BI Map includes changing the Bubble Size, Color, Map Title text, Title position, background color, etc.
To demonstrate these Map formatting options, we are going to use the Map that we created earlier. Please refer to Create a Map in Power BI article to understand the steps involved in creating a Power BI map.
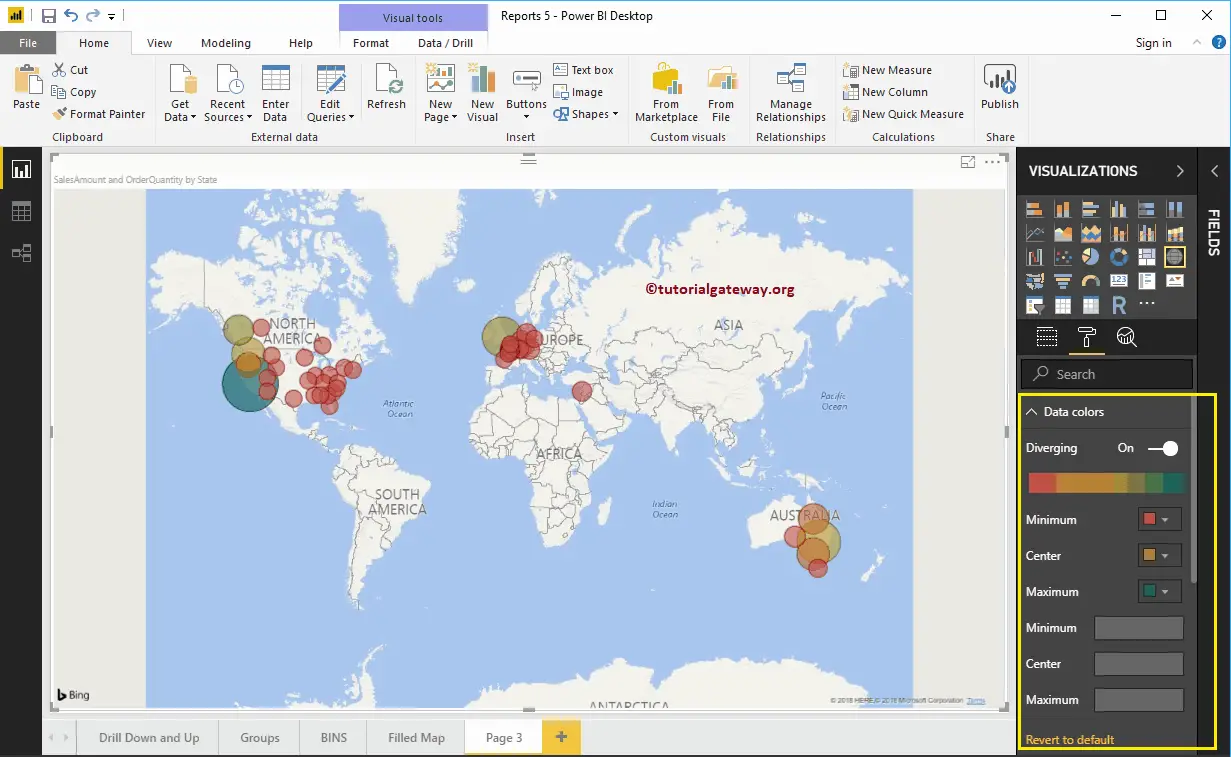
Format Power BI Map Data Colors
While creating this map, we added the Order Quantity as the Color Saturation, and that’s why we see the Diverging option under the Data Colors. Please change the Minimum, Center, and Maximum colors per your requirements.
If you remove the Order Quantity from the Color Saturation, the Data Colors section shows you each bubble’s colors, as shown below.
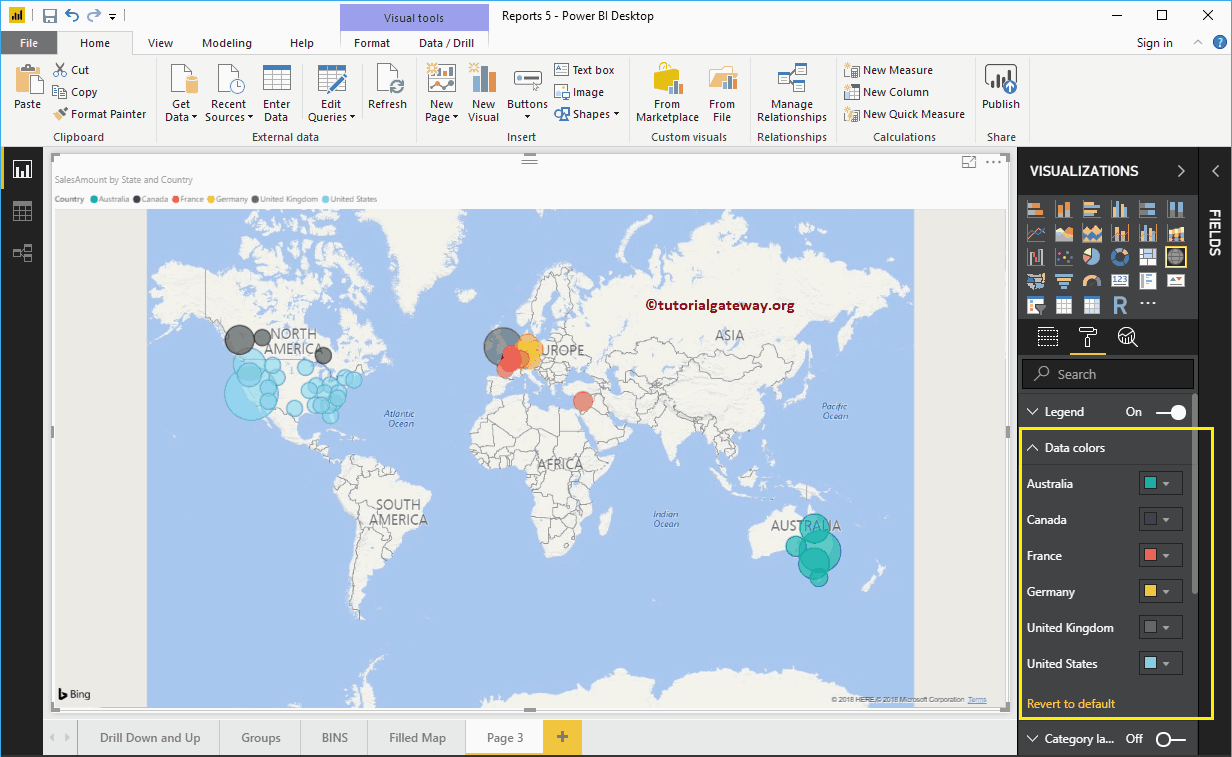
Let me add the Order Quantity to Color Saturation again
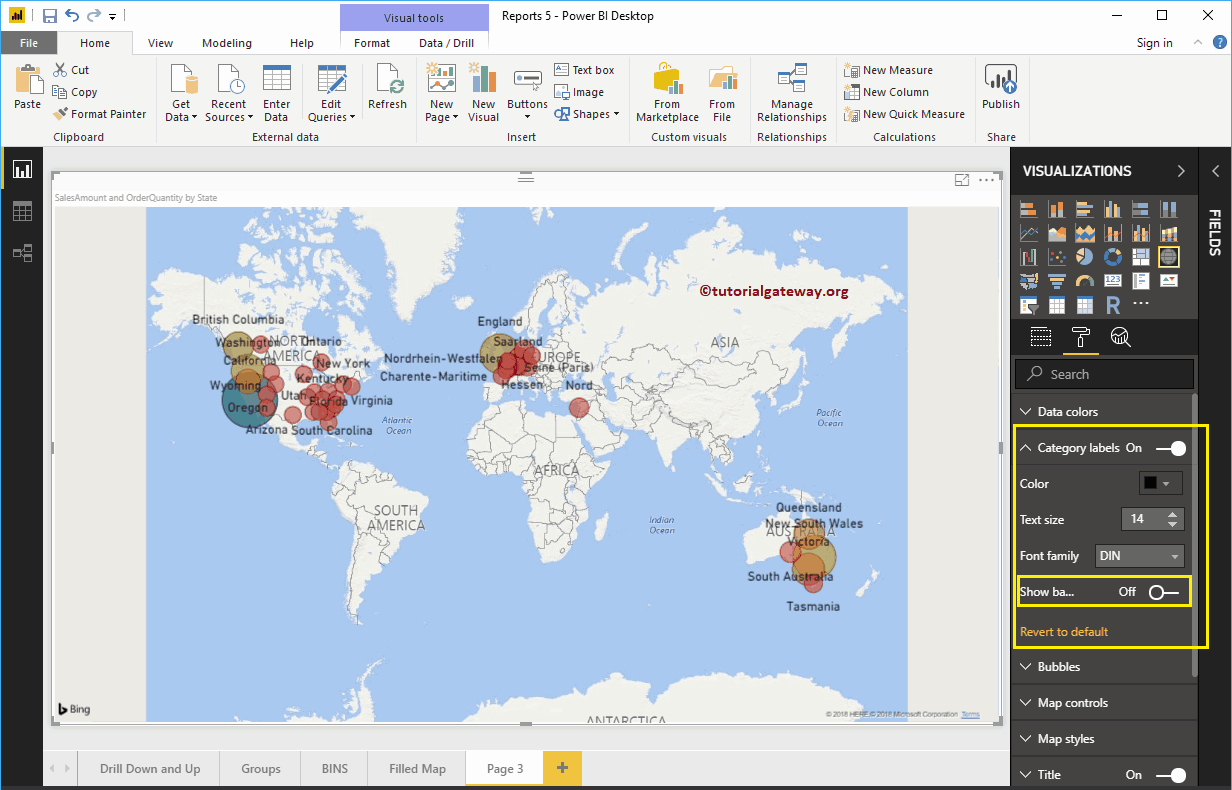
Format Power BI Map Category Labels
Map Category labels are names that represent each bubble or circle. You can enable these labels by toggling the Category labels option from Off to On.
The screenshot below shows that we changed the Color to Black and the Text Size to 14. If you want, you can add the background color as well.
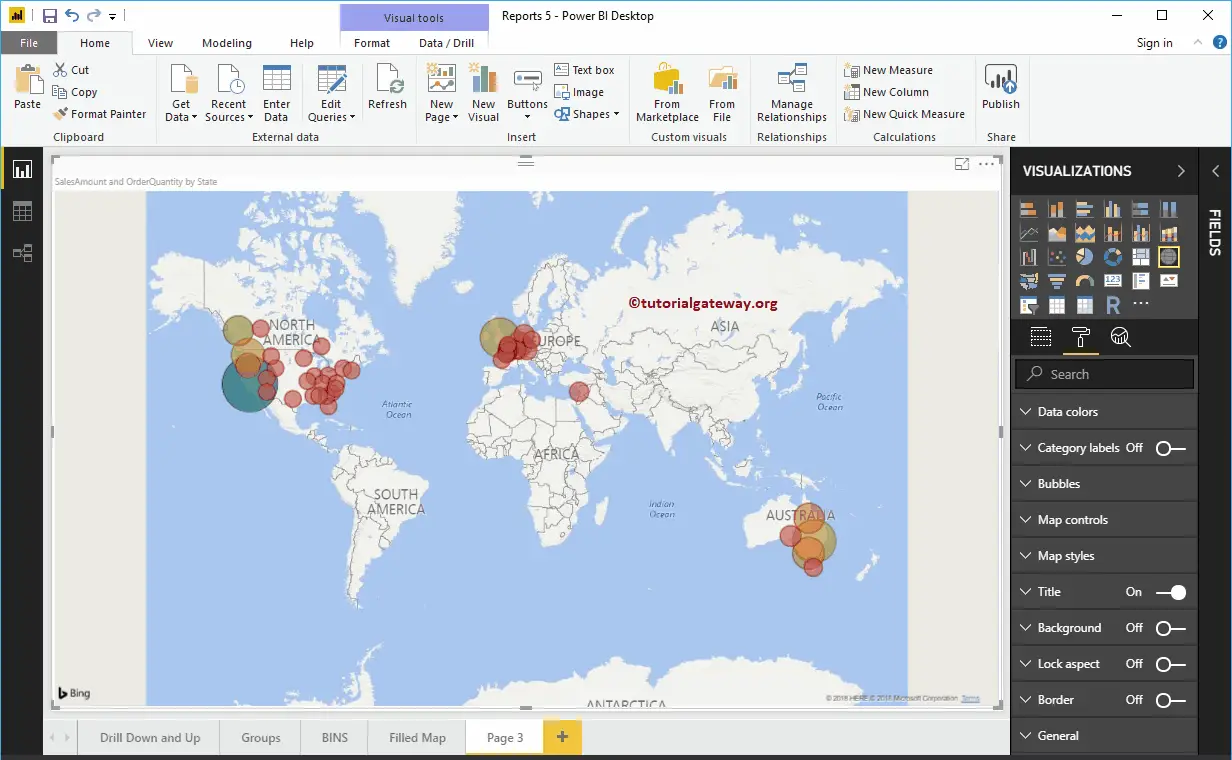
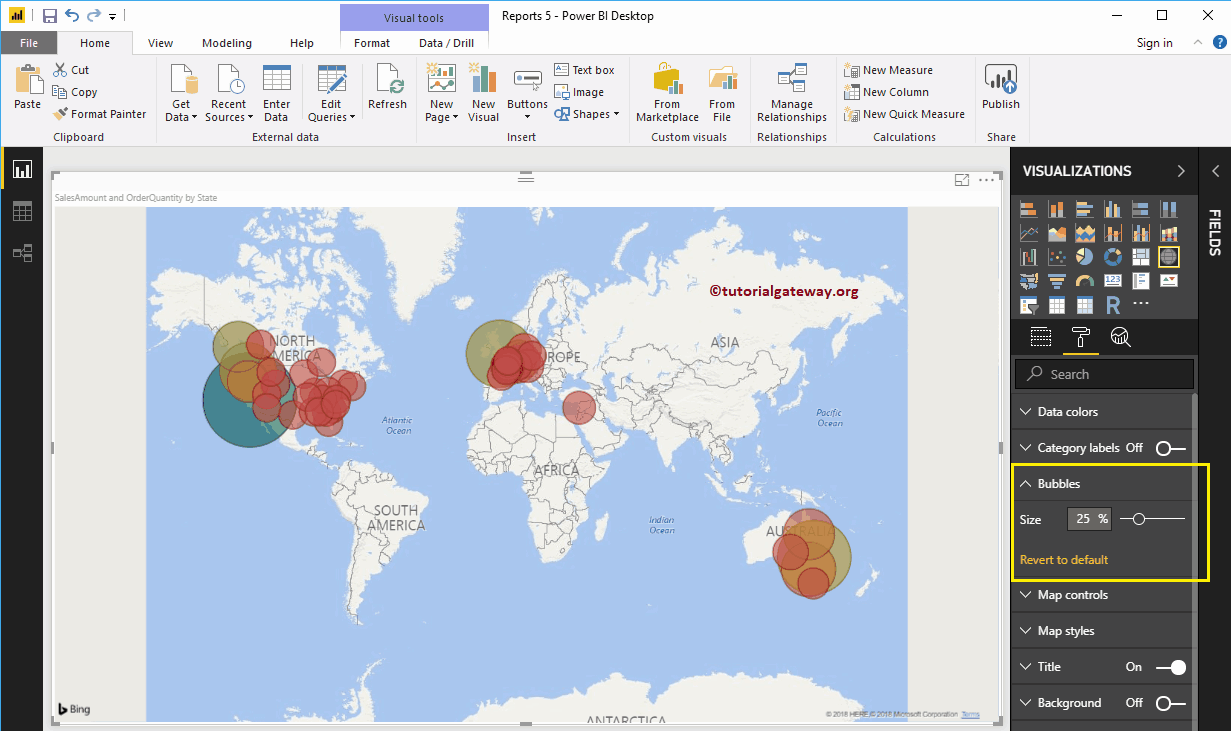
Format Bubble Size of a Map
Use this section to change the size of all the Circles. As you can see from the screenshot below, we changed the size to 25%.
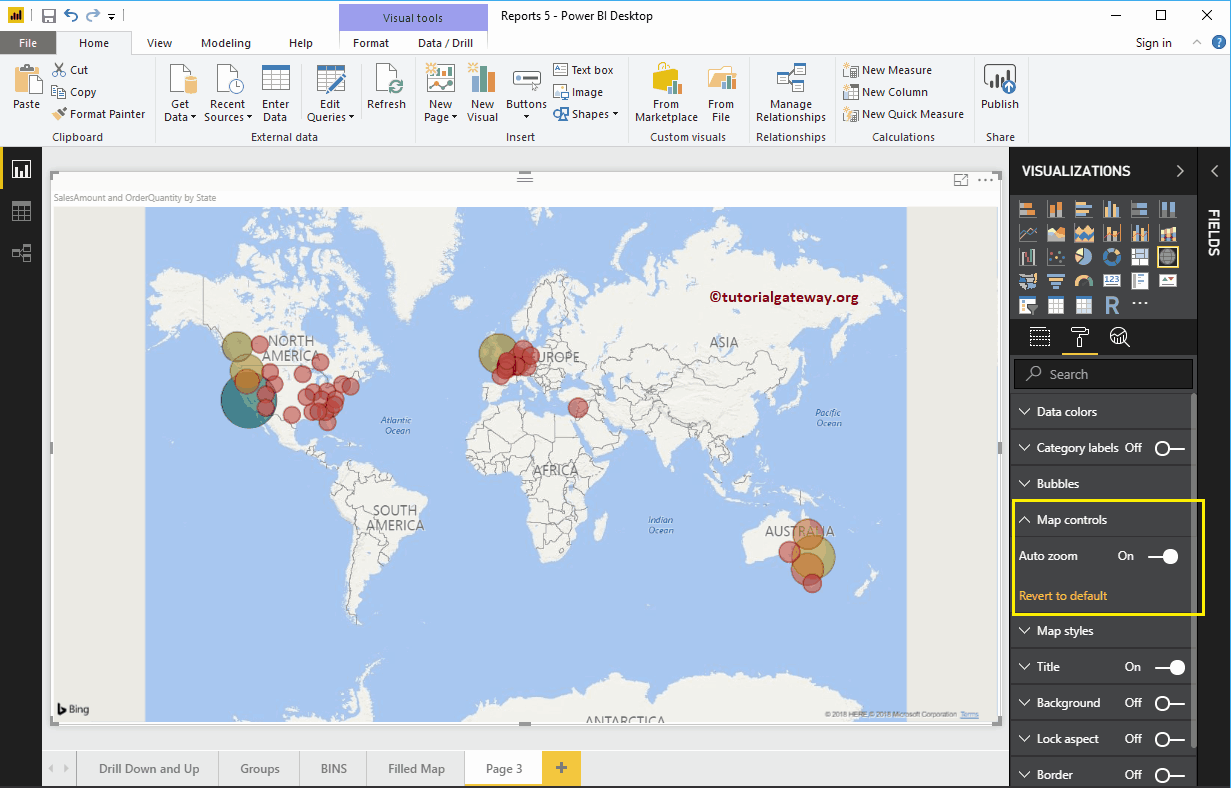
Map Control in Power BI Map
By default, the auto zoom option is enabled for this map. However, you can disable it by toggling the Auto Zoom option from on to off.
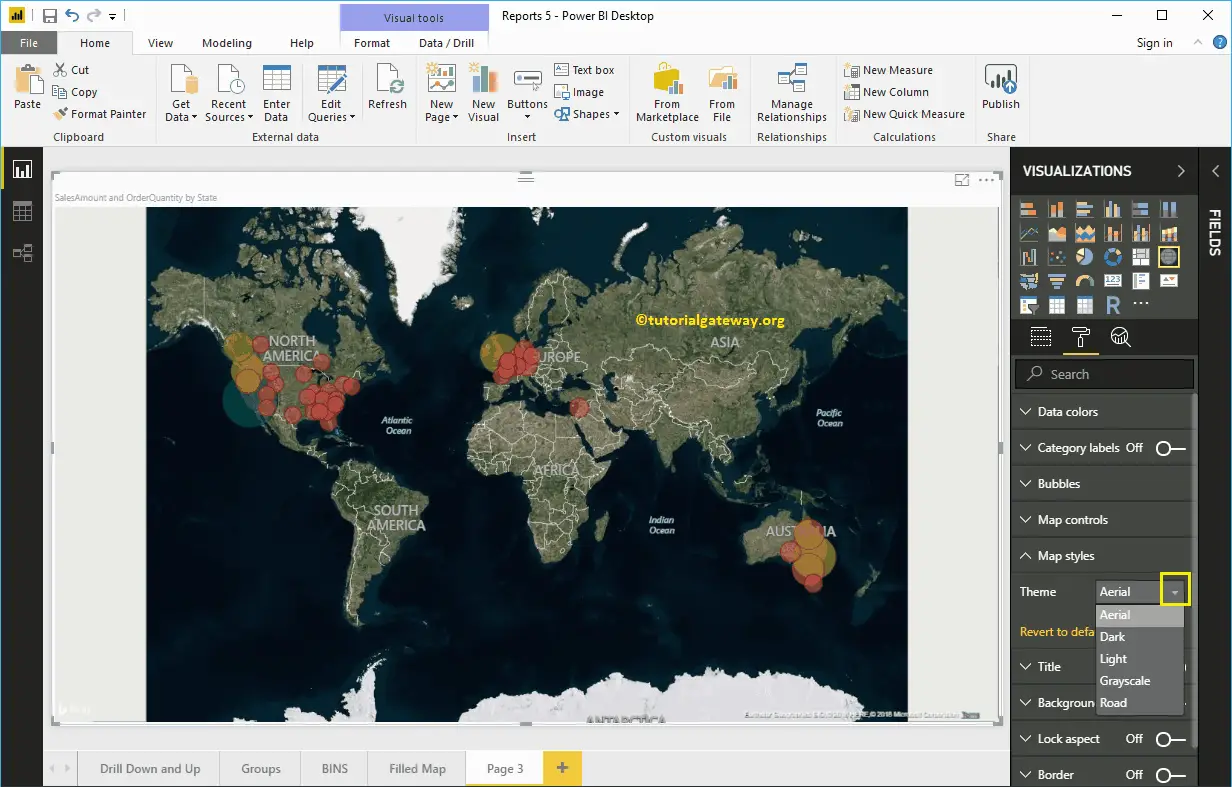
Format Theme of a Map
Use this section to change the look or theme of a map. Let me select the Aerial Theme.
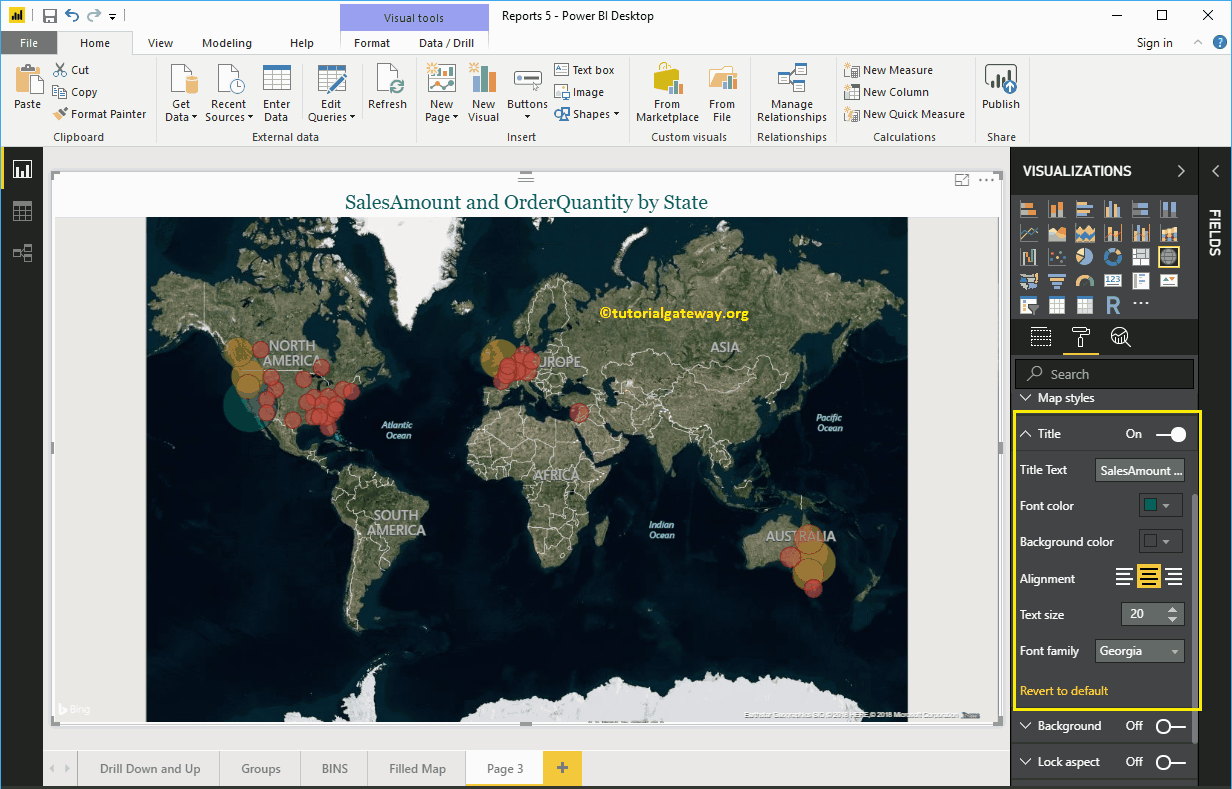
Format Title of a Map in Power BI
You can disable the Map title by toggling the Title option from On to Off.
From the screenshot below, we change the Font Color to Green, the Text Size to 20, the Font Family to Georgia, and the Title Alignment to center. If you want, you can also add the background color to the title.
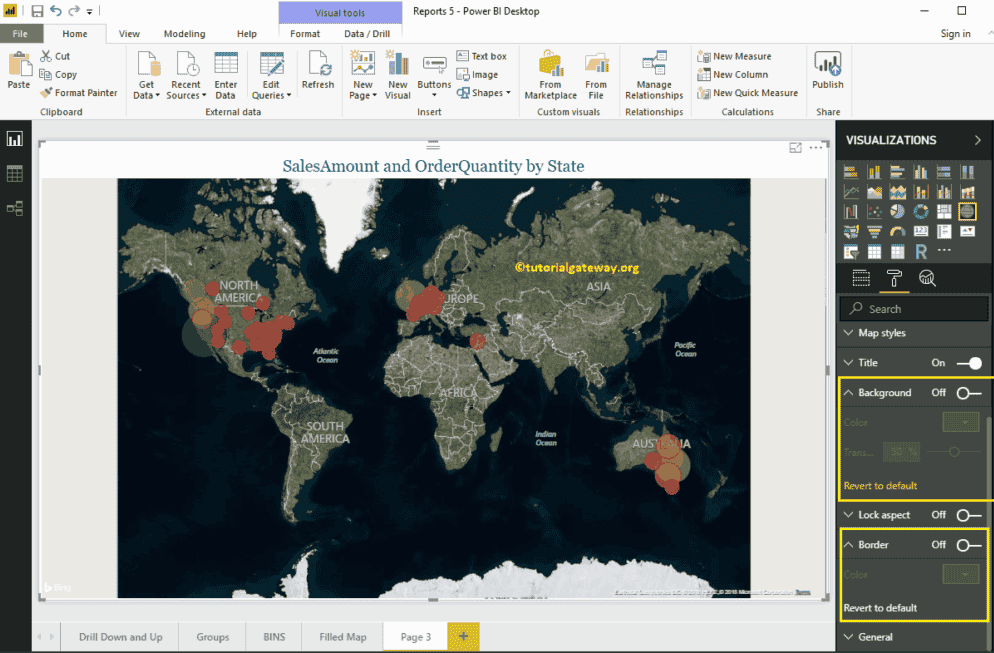
Format Background Color and Borders of a Map
You can add the Background color to a Map by toggling the Background option to On. Similarly, you can add Borders to a Map by toggling the Border option from Off to On.