How to Format Filled Map with an Example? Formatting the Power BI Filled Map includes changing the Map Color, Title text, Title position, background color, etc.
To demonstrate these filled Map formatting options, we will use the filled Map that we created earlier. Please refer to Create a Filled Map in Power BI article to understand the process of creating a filled map in Power BI.
How to Format Power BI Filled Map
Please click the Format button to see the available formatting options for this filled map. Please refer to the Charts introduction article.
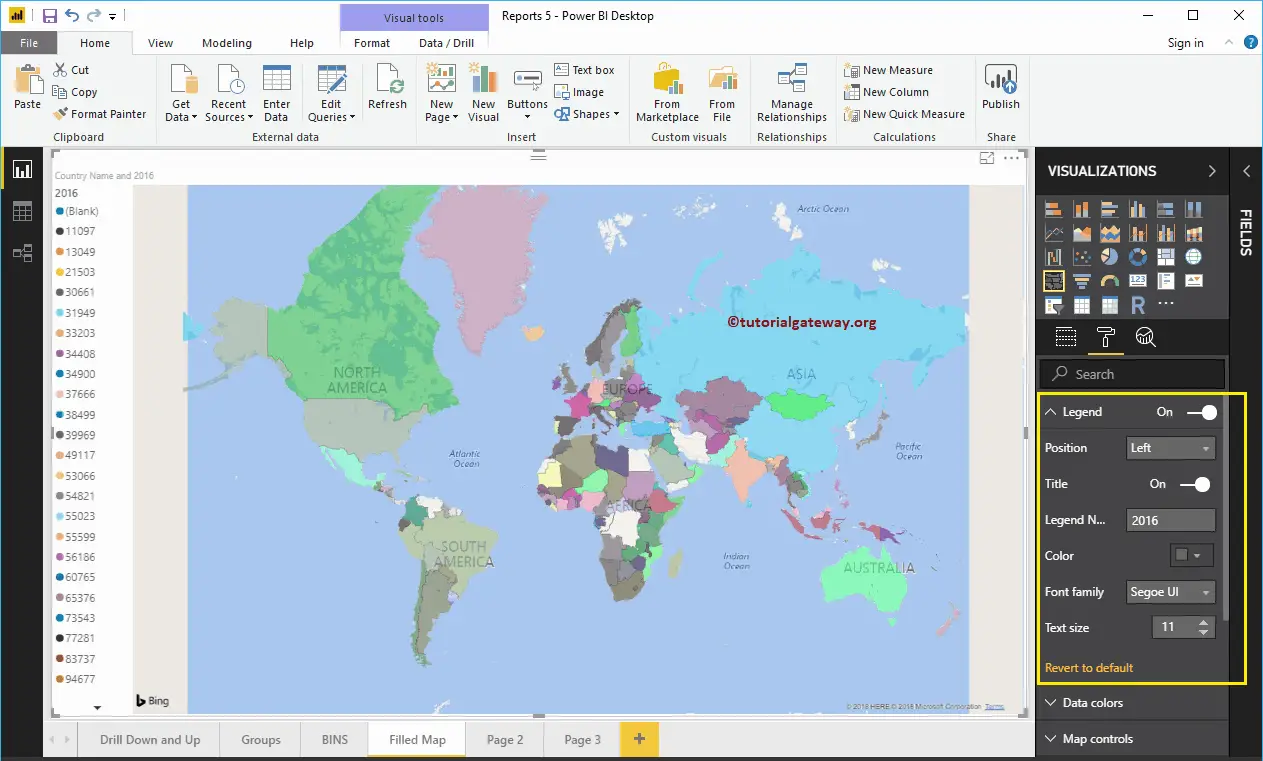
Format Legend of a filled Map
As you can see from the screenshot below, we used the Position drop-down box to change the legend position to Left. Next, we changed the legend text size to 11.
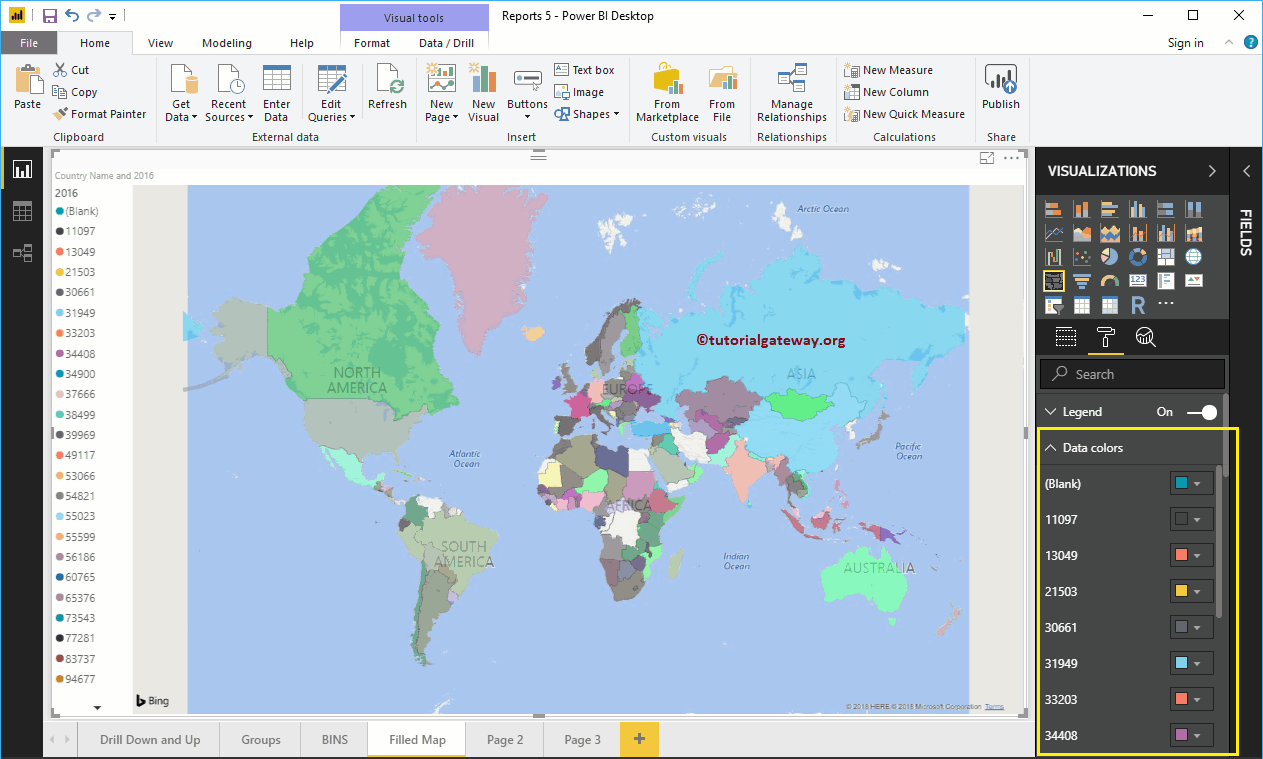
Format Filled Map Data Colors
Use this Data Colors section to change the color of each and every individual area (here, it is the country).
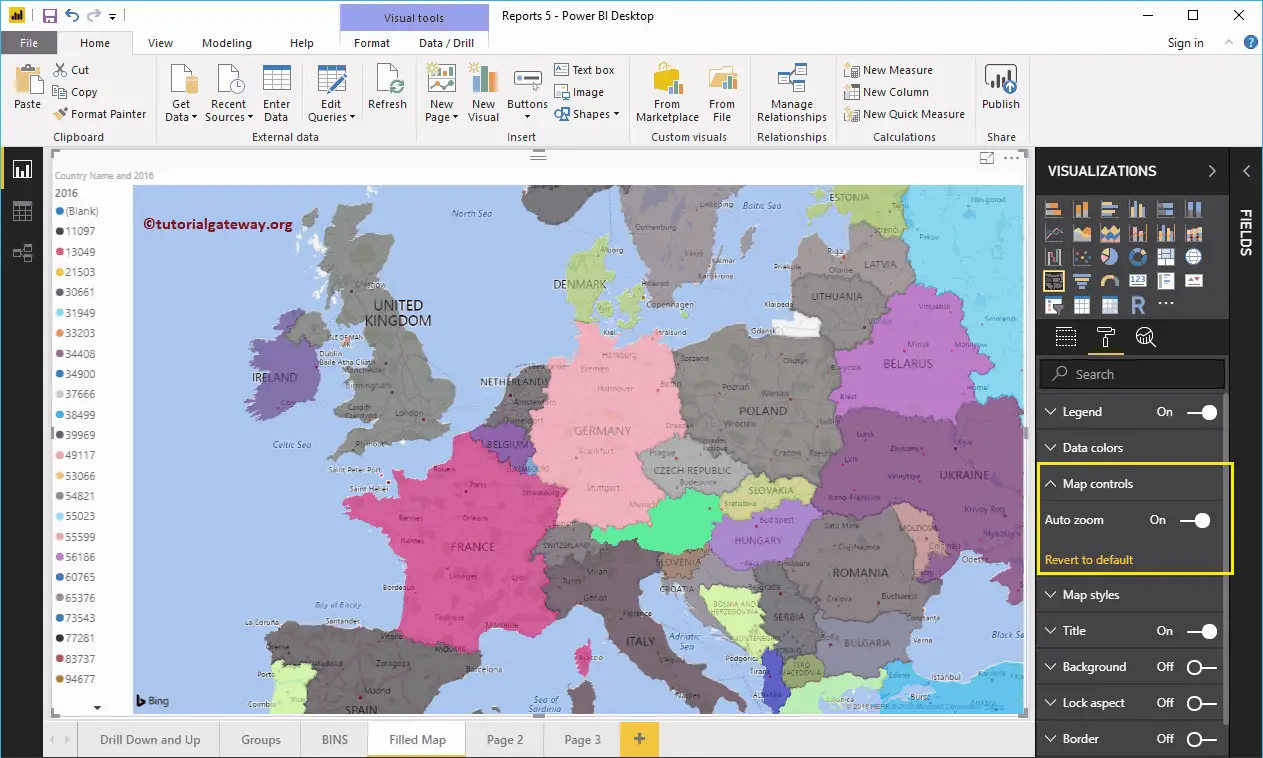
Map Control in Power BI Filled Map
By default, the auto zoom option is enabled in this filled map. However, you can disable it by toggling the Auto Zoom option from on to off.
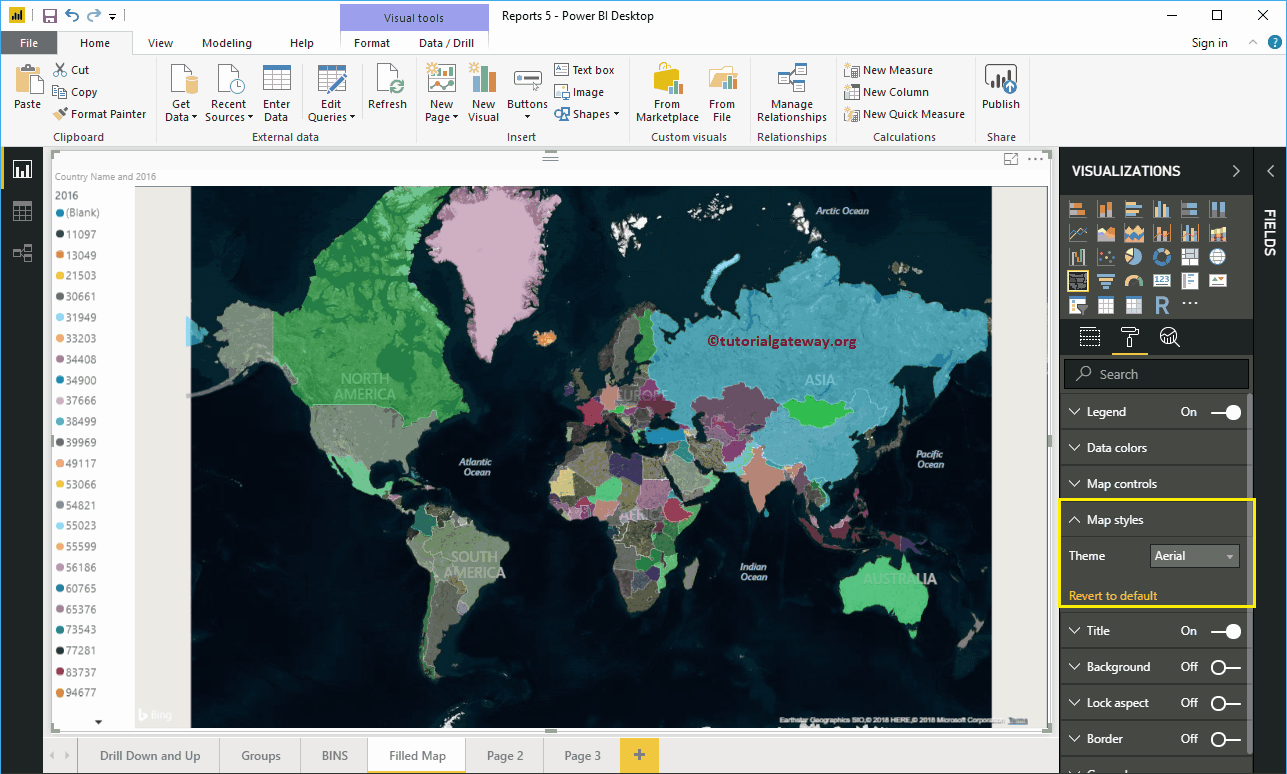
Format Map Style of a Filed Map
Use this section to change the look or theme of a map. Let me select the Aerial Theme.
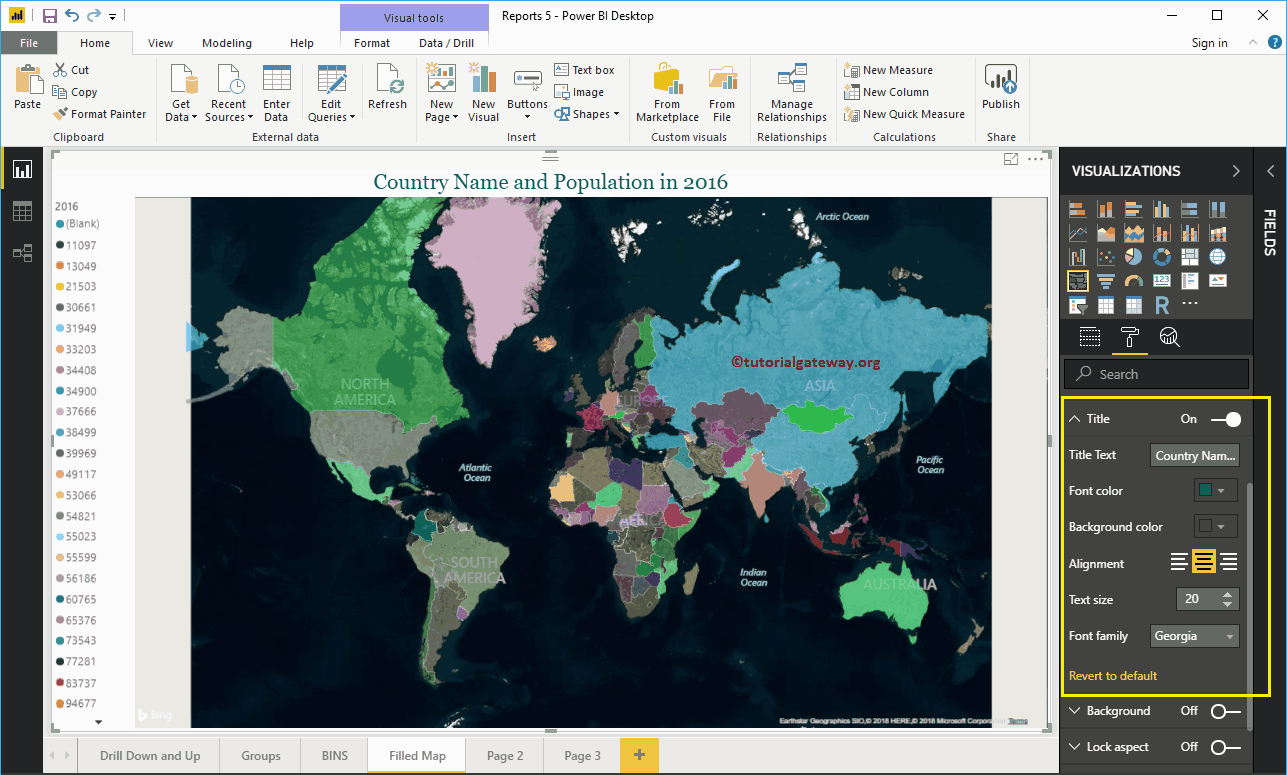
Format Title of a Filled Map
You can disable the filled Map title by toggling the Title option from On to Off.
From the screenshot below, we change the Font Color to Green, the Text Size to 20, the Title Alignment to the center, and the Font Family to Georgia. If you want, you can also add the background color to the title.
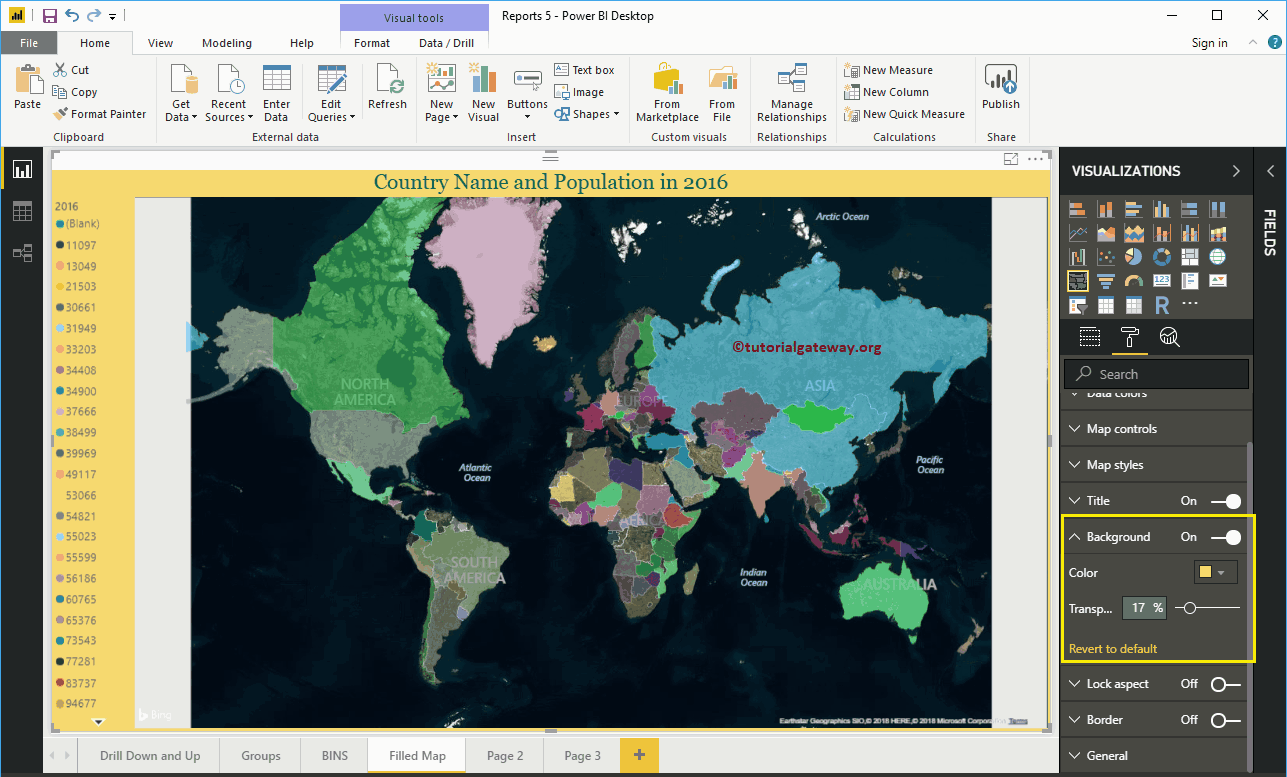
Format Background Color of a Filled Map in Power BI
You can add the Background color to a filled Map by toggling the Background option to On. For the demonstration purpose, we added a yellow color with 17% transparency.
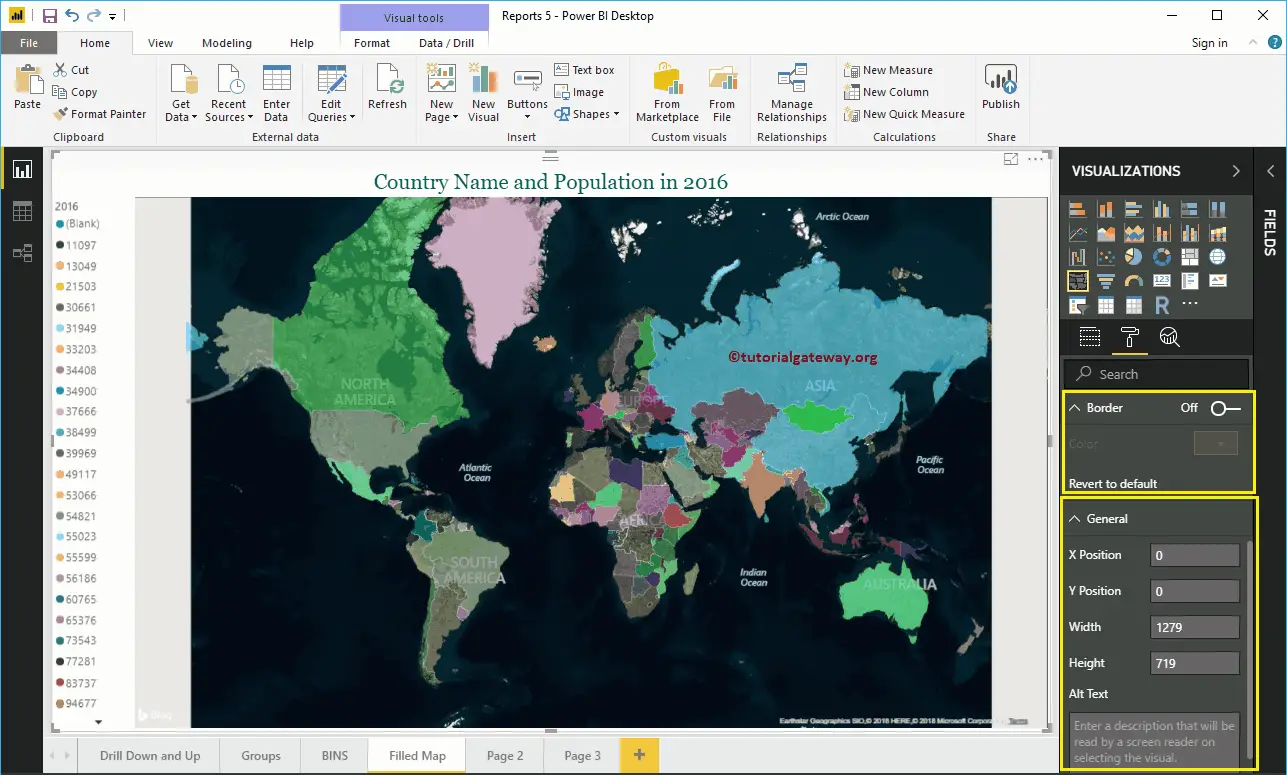
Format Borders and General settings
You can add Borders to a filled Map by toggling the Border option from Off to On. Similarly, use this General Section to Change the filled map X, Y position, Width, and height.