In this article, we will show you how to Create a Cumulative Histogram in Tableau with an example.
It is a follow-up article on Tableau Histogram. So, please read that article to understand the histogram concept. However, if you want to start from here, Let us see what we have inside the Tableau report.
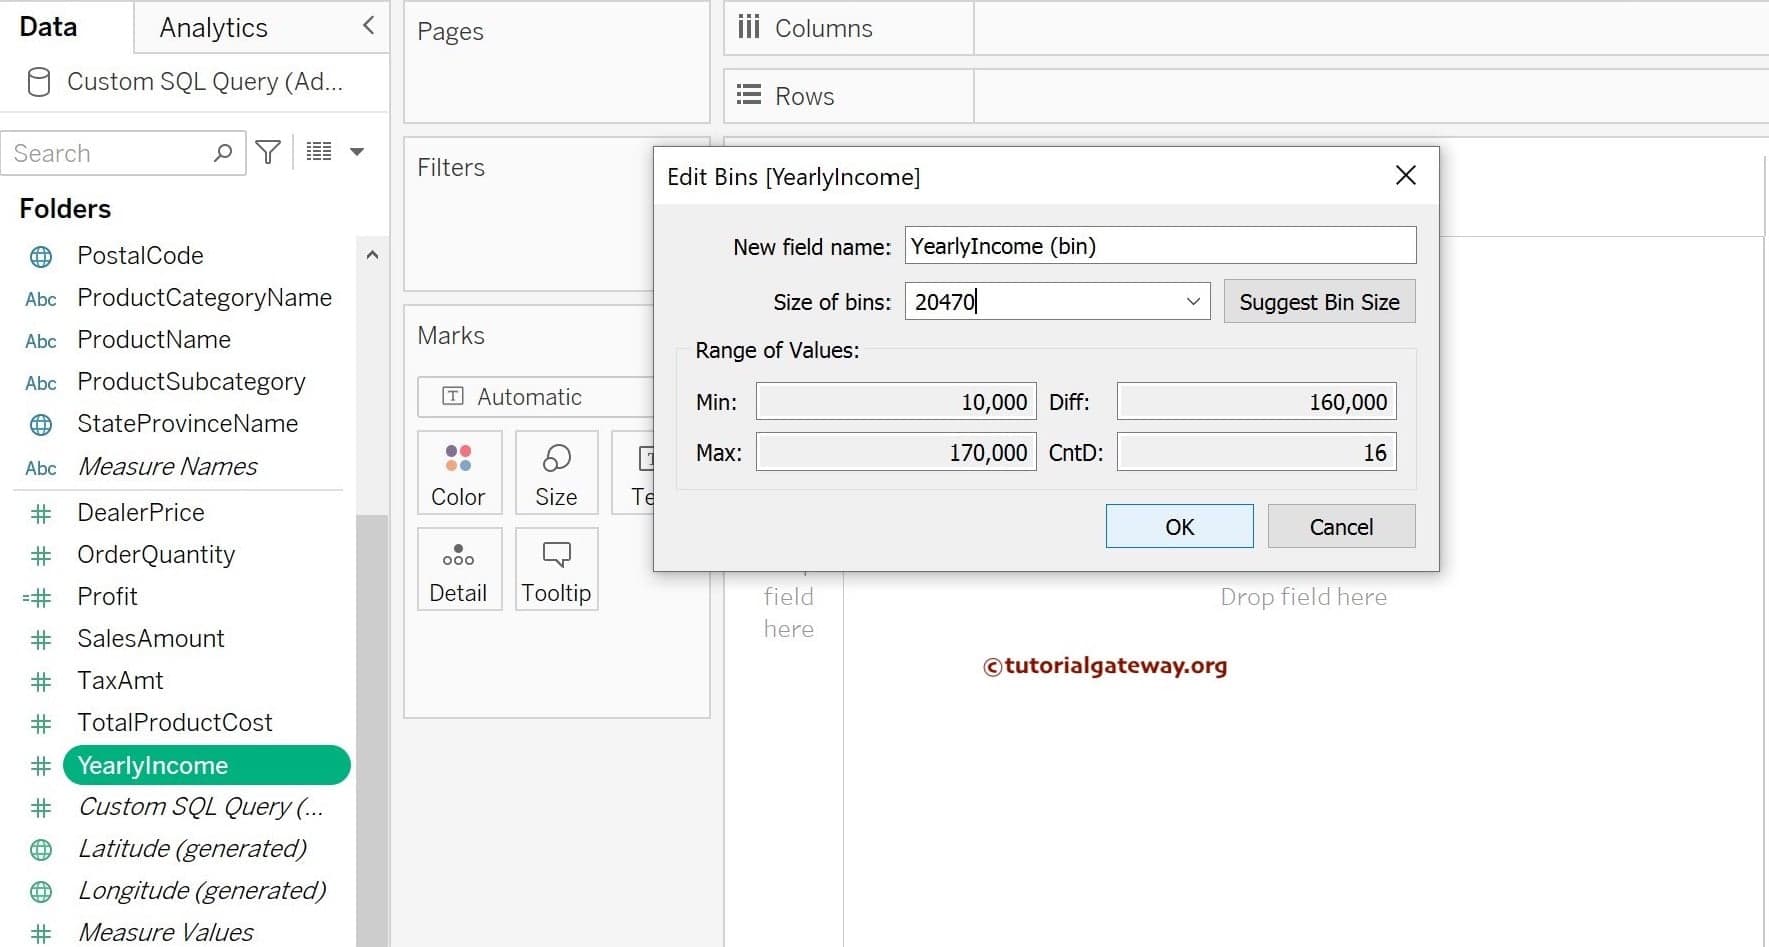
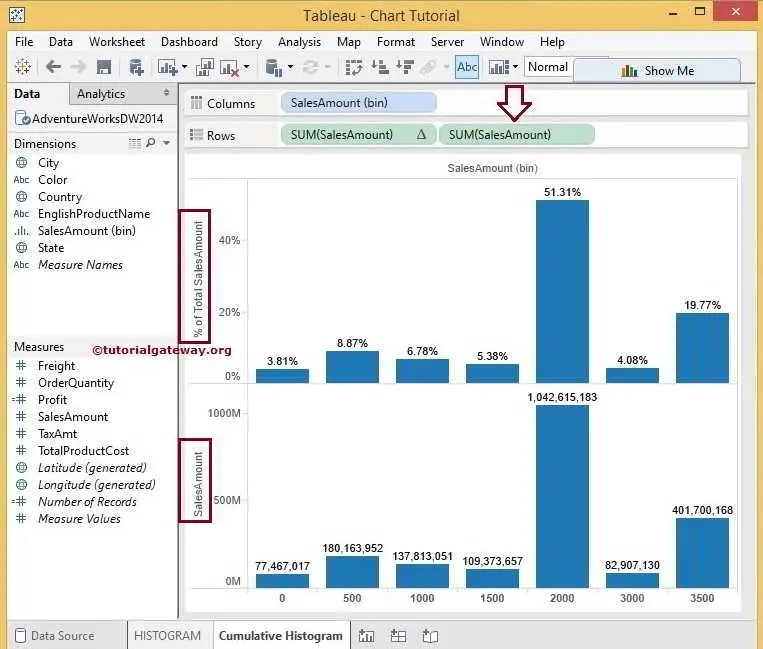
We have the Sales Amount Bin on the Columns shelf, the Sum of Sales Amount measure on the Rows Shelf, and table calculation (Percent of Total) on the Sales Amount.
Cumulative Histogram in Tableau example
To create a Tableau cumulative histogram, Drag and Drop the Sales Amount from the Measures Region to the row shelf. Since it is a Measure value, the Sales Amount will aggregate to the default Sum.
The cumulative Histogram in Tableau is all about the cumulative frequency of a Histogram, Which is nothing but calculating the Running Total.
Please click on the down arrow beside the Sales Amount measure to calculate the running total. Next, select the Quick Table Calculation option and then select the Running Total. For more, Click Here.
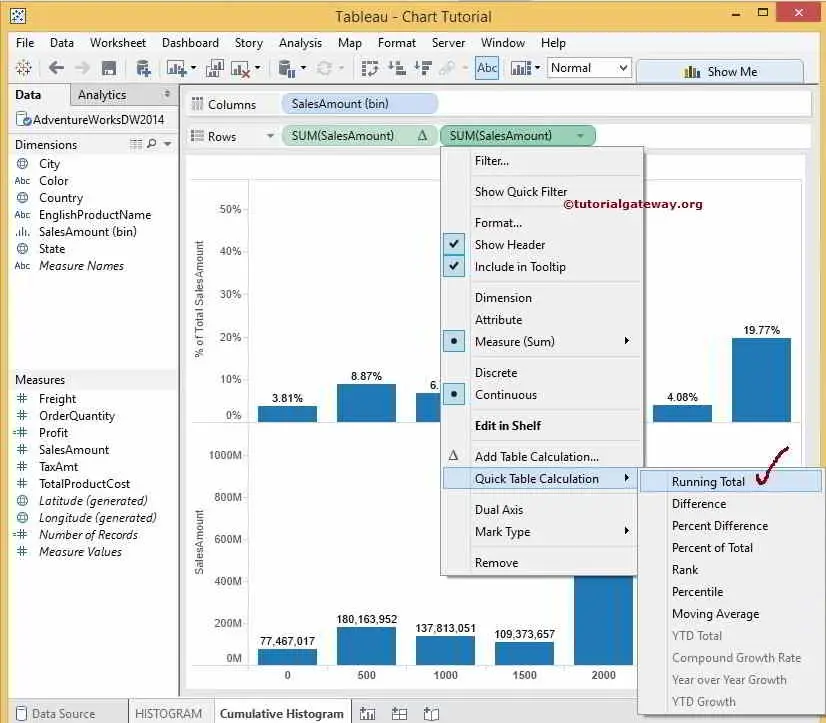
Now, our data will arrange by the Running total. However, we intend to display the Tableau Cumulative Histogram and Normal Histogram in One Chart using the Dual Axes concept. Here, our Normal Histogram shows the Percentage of the Total, but our Cumulative Histogram displays the Running total. To combine them,
- we have to change the Table Calculation of either of them or
- You can add a secondary calculation.
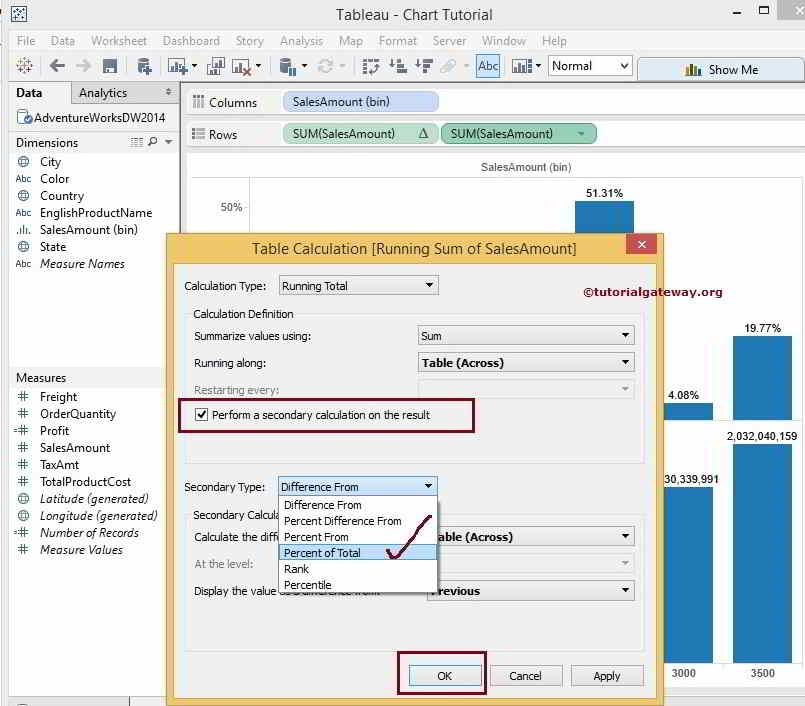
We are using the second option, which is wiser than option 1. Please click on the down arrow beside the Sales Amount measure and select the Edit Table Calculation option
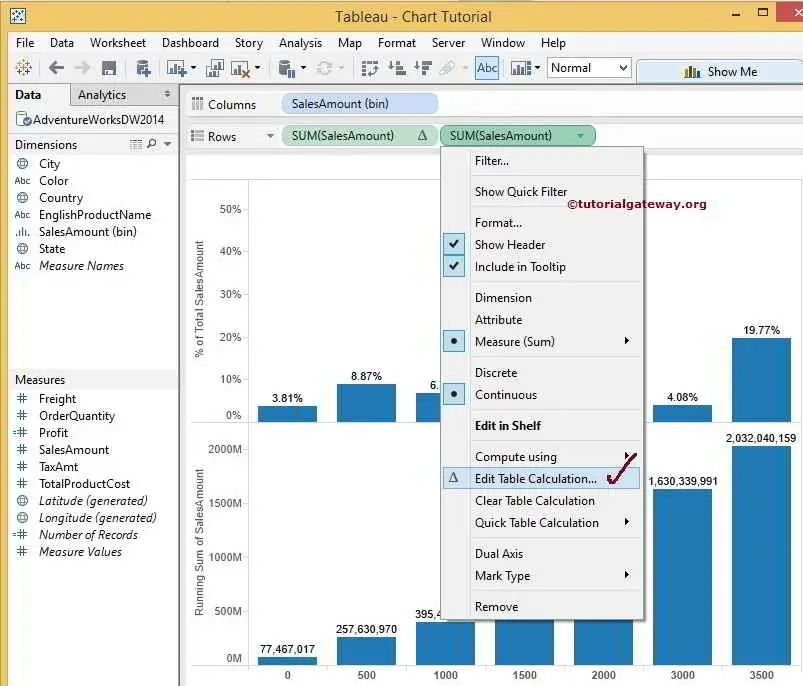
Once you choose the Edit table Calculation option, the following window will open. Please checkmark the Perform Secondary Calculation on the result option. Next, select the secondary calculation Type as Percent of Total.
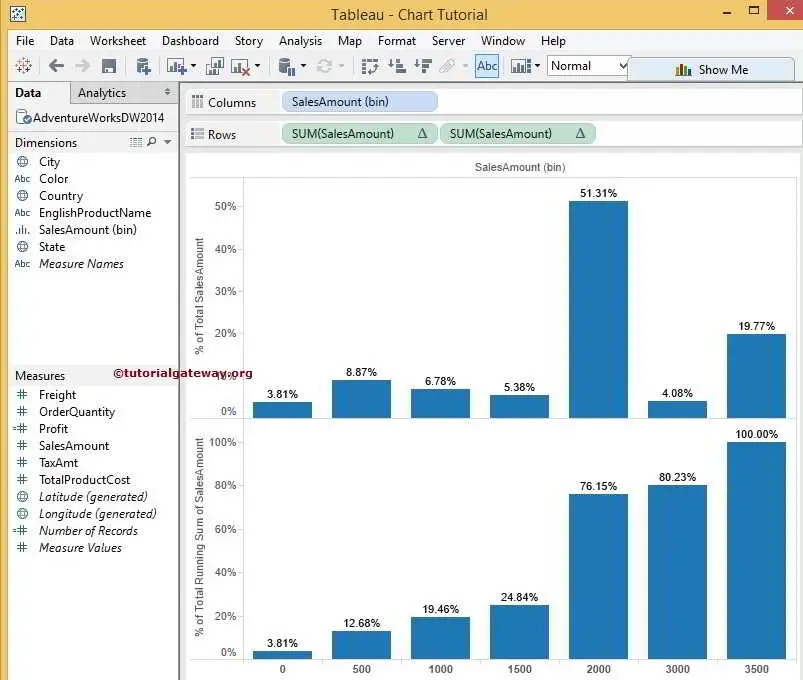
Once complete, the Total Running Sum of Sales Amount chart is arranged by Running Total and displays the Percentage of Total. If you observe the Axis of Total Sales Amount and Total Running Sum of SalesAmount, they both show the Percentage, and it’s easy to create a Dual Axis.
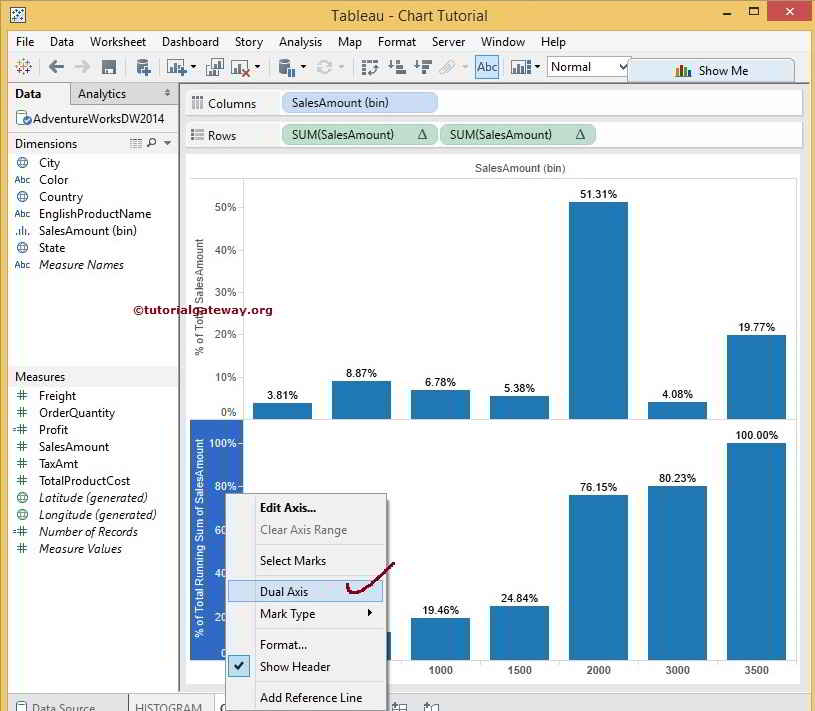
To create a Dual Axes Report, select the Total Running Sum of Sales Amount Axis. And right-click on it will open the context menu. From that, select the Dual Axis option.
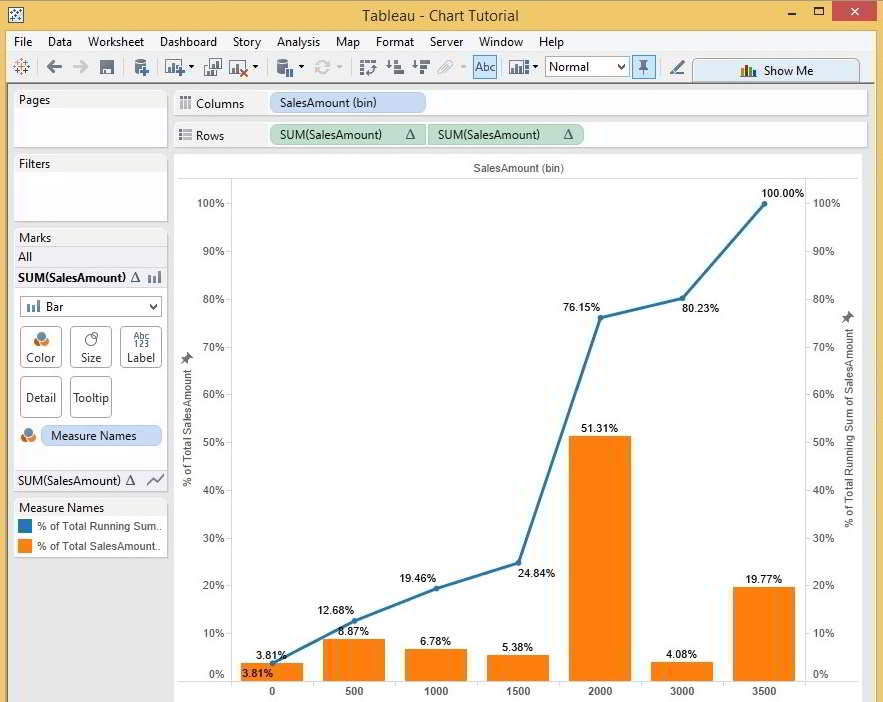
Once you choose the Dual Axis option, the following screenshot will be displayed. From the below Tableau cumulative histogram screenshot, you can observe that We have a Sales Amount Bin in the range of 500 on the Horizontal Axis and Total Sales Amount, the Total Running Sum of the Sales Amount on the Vertical Axis (which acts as Dual Axis).
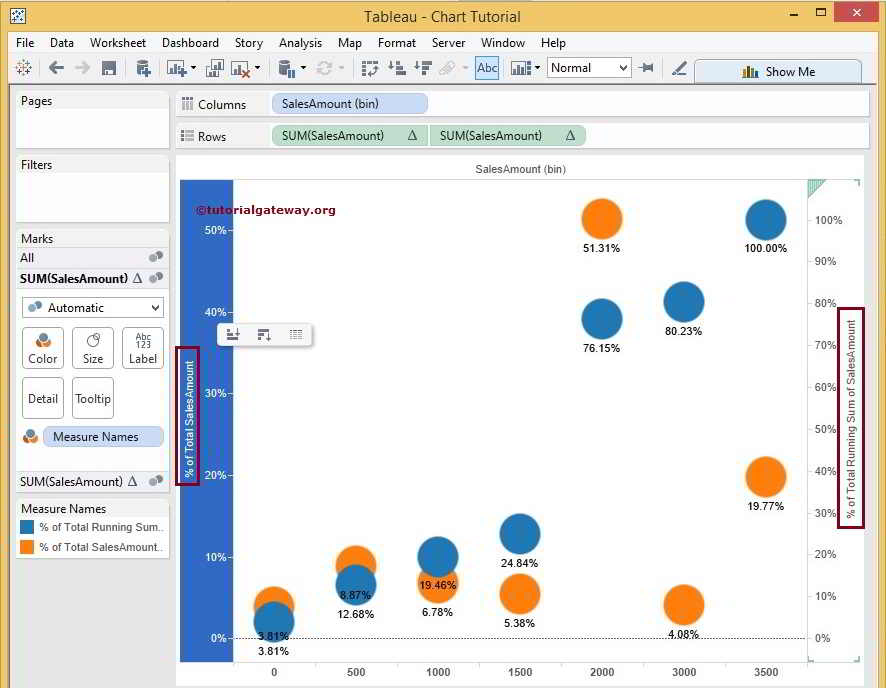
From the below Tableau cumulative histogram screenshot, we assigned a bar Chart to the Total Sales Amount and a Line Chart to the Total Running Sum of the Sales Amount. Please refer to Tableau Dual Axis to understand the Dual Axis report concept.
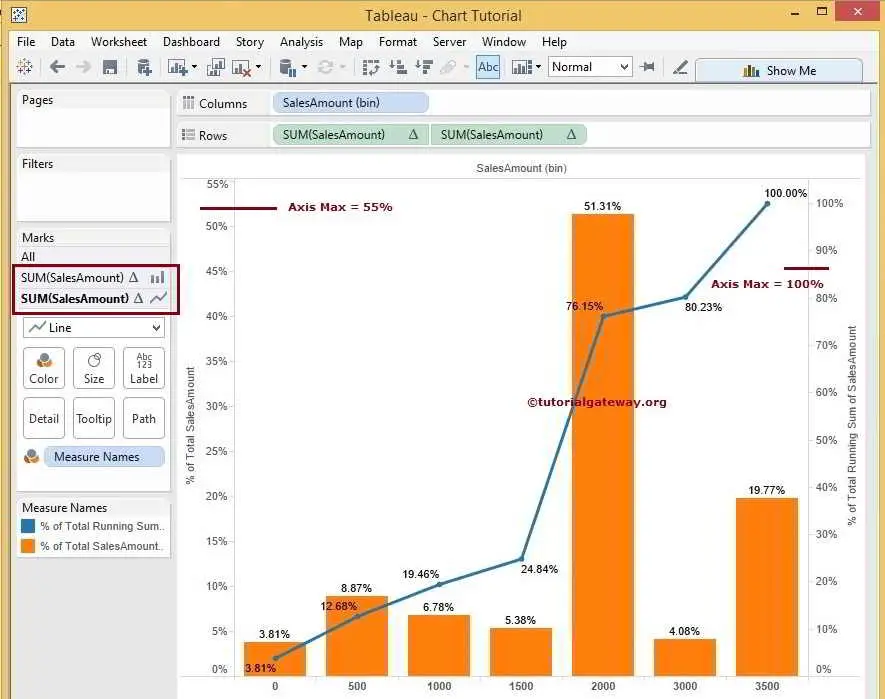
From the above screenshot, you can observe that the Tableau Cumulative Histogram looks perfect. But The Maximum Axis value of the Total Sales Amount is 55%, whereas the Total Running Sum of the Sales Amount is 100%. To do the same, we have to use the Synchronization of the Axis concept.
Please refer to Synchronizing Dual Axes in the Tableau section in Tableau Dual Axis to understand the Synchronization of the Total Sales Amount and Total Running Sum of Sales axis values.
From the above screenshot, We successfully created the Tableau Cumulative Histogram and Normal Histogram on Dual Axes.