This article shows you how to connect Power BI to Multiple Excel Sheets and how to load and use data present in those Excel sheets.
To demonstrate the Connect to Multiple Excel Sheets, we will load data from multiple tables or sheets in an Excel file to the desktop and generate a bar chart.
How to Connect Power BI to Multiple Excel Sheets
Before we start Connecting to Multiple Excel Sheets to load, Let us see the sample superstore Excel file’s data. The second image below shows it has three sheets: Orders, Returns, and Users.
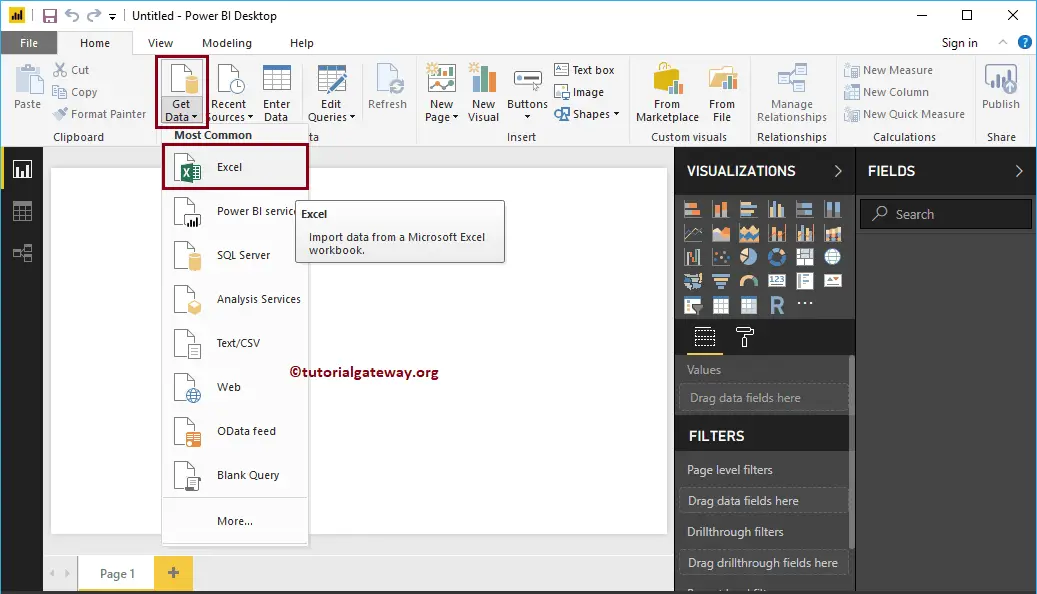
Suppose you are on the Power BI visualization page. Under the Home tab, click the Get Data option and select Excel, as we have shown below. Otherwise, select the More option and select Excel. For more Data Connections and Transformations >> Click Here!
Once you click on the Excel tab, a new window will open to select the Excel File from our file system. For now, we are selecting the Sample – Superstore file, as shown below.
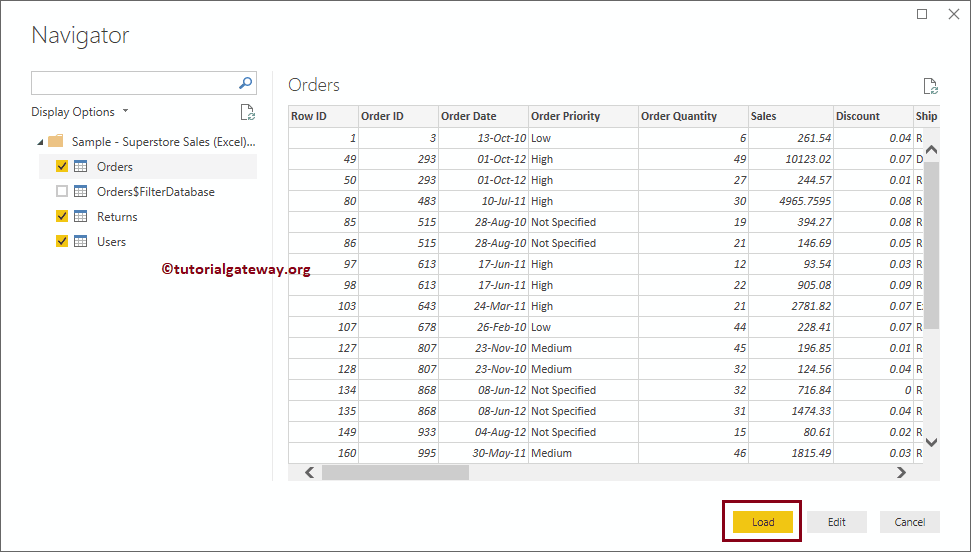
Expanding the Superstore Excel folder in the Navigator window will display the list of available sheets. Selecting the sheet or table shows the Data Preview. From the screenshot below, you can see the preview of the sheet. If you are satisfied with the Data and the data types, click the Load button; otherwise, click the Edit button to make changes.
Currently, we don’t want to make any changes to the data. So, let me click on the Load button to Connect Power BI to Multiple Excel Sheets. Please wait until the load is complete.
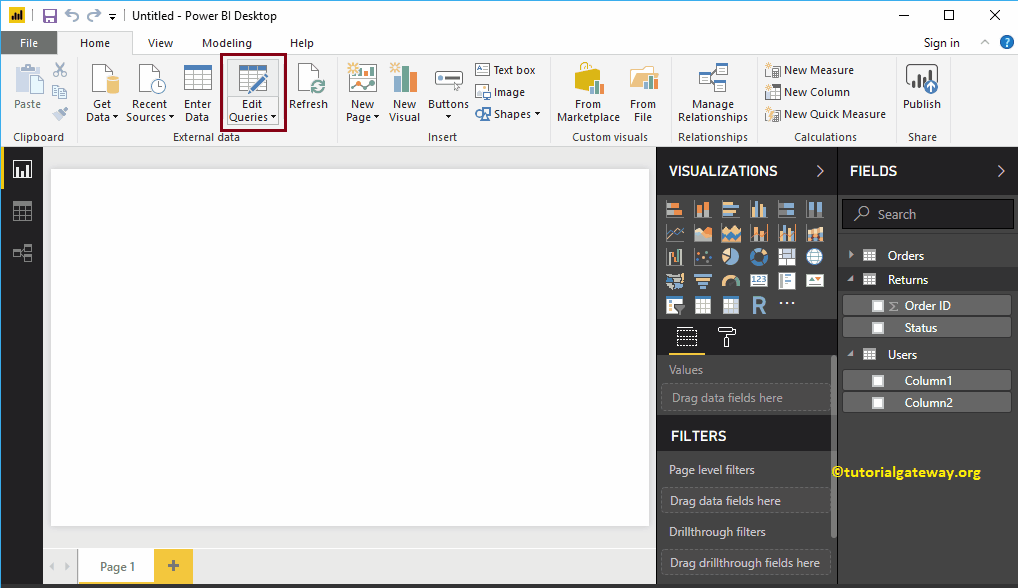
Now you can see all the Columns imported from the Excel file under the Fields section. As you can see, there is an issue with the Users table because Power BI hasn’t picked up the column names from the first row. Please click on the Edit Queries tab.
Click on the Use First Row as Headers
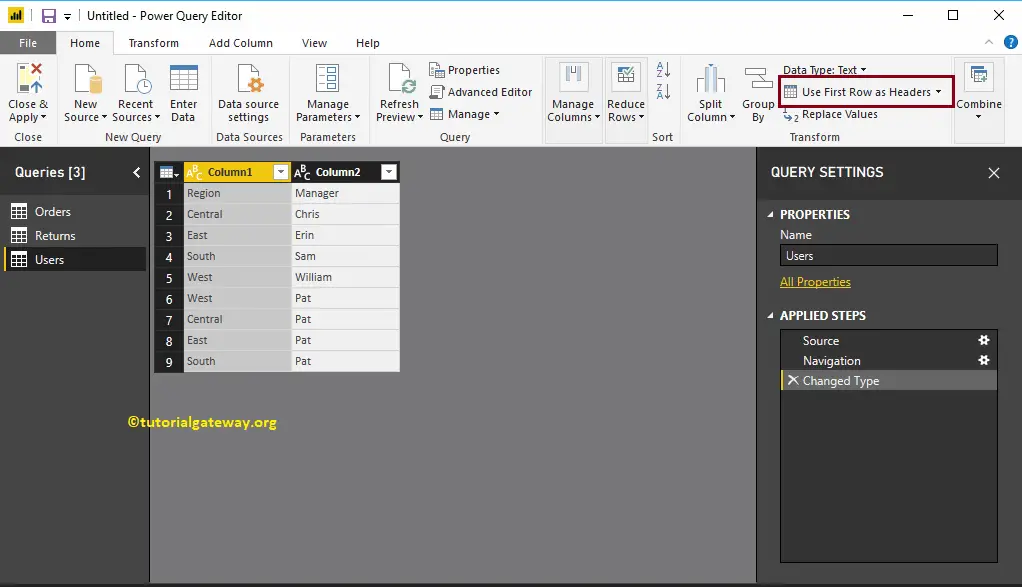
That’s it. We Connected Power BI to Multiple Excel Sheets and loaded data from multiple sheets.
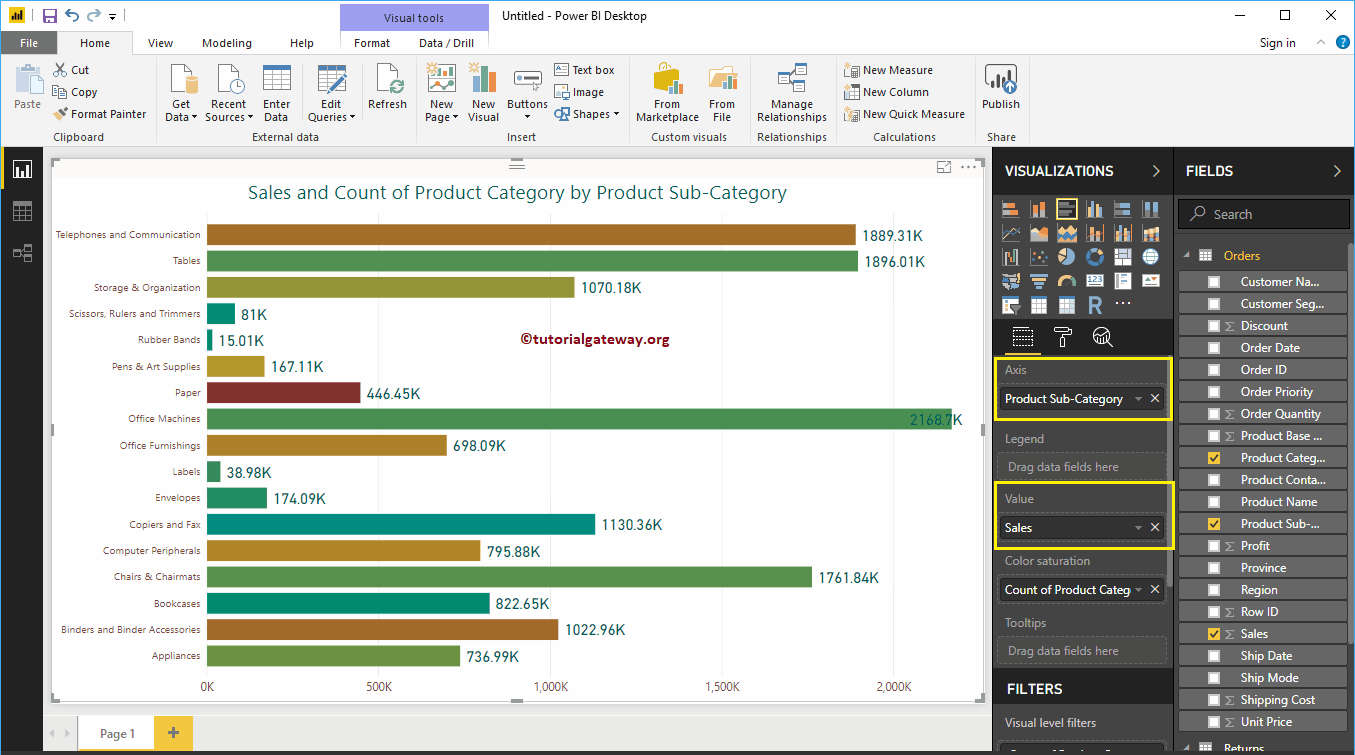
Let me create a Column chart using this data. I suggest you refer to the Column Chart article to understand the steps involved in creating it.
Comments are closed.