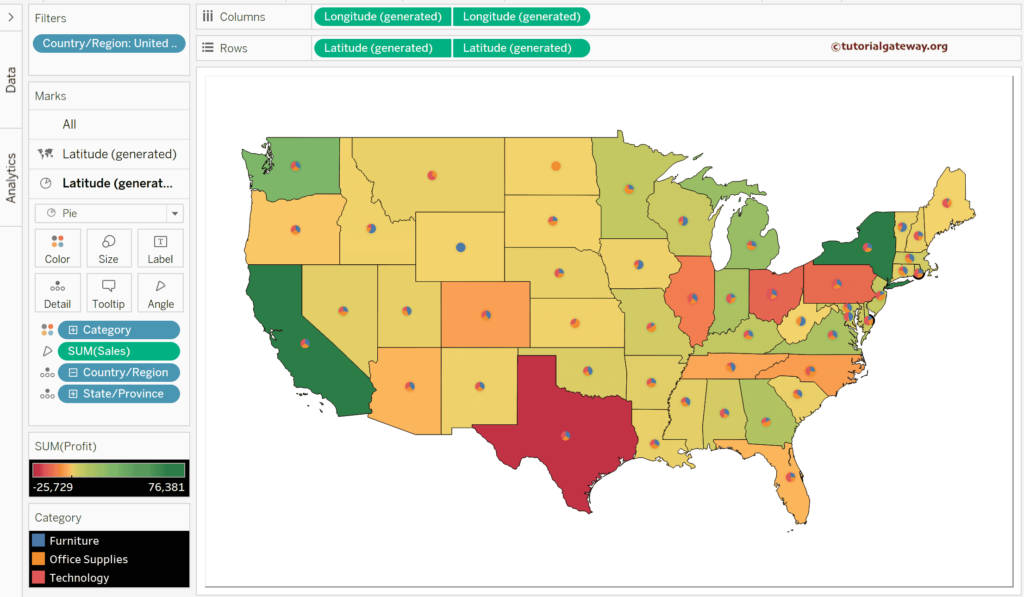
This article shows how to add a Pie chart to the Tableau Maps using the layers and Dual Axis options with examples. To demonstrate this example, we used the Sample Superstore Excel sheet.
There are two approaches to fulfill this requirement: the first is adding the Marks Layer(latest), and the second is the dual axis (old) approach.
Add a Pie Chart to Tableau Maps using Marks Layer
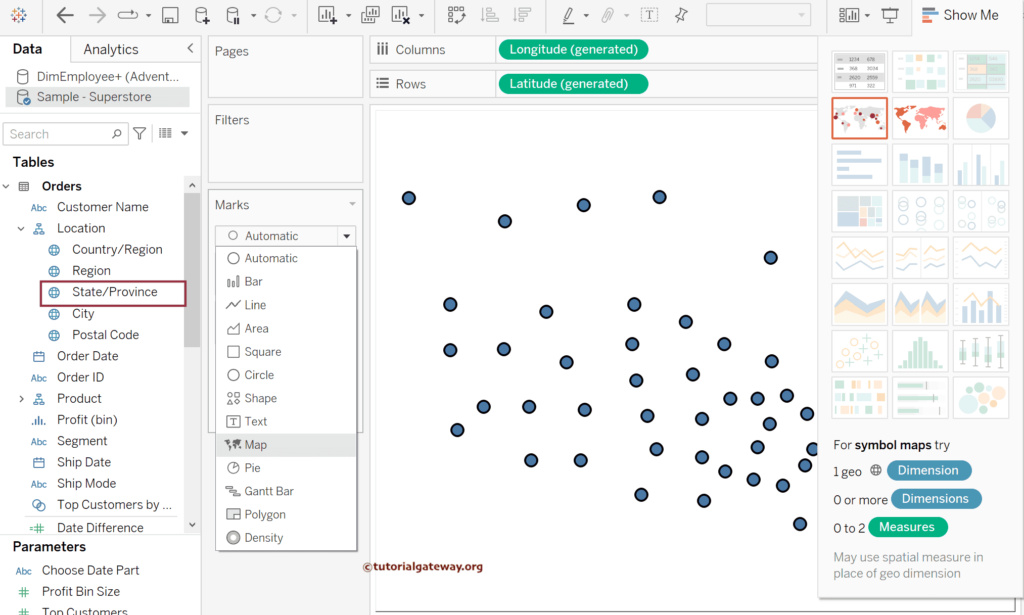
Double-click the State/Province, and it will automatically generate a map. If not, please change the Marks type from Automatic to Map. Please visit the Excel Source article to understand the Data Source.
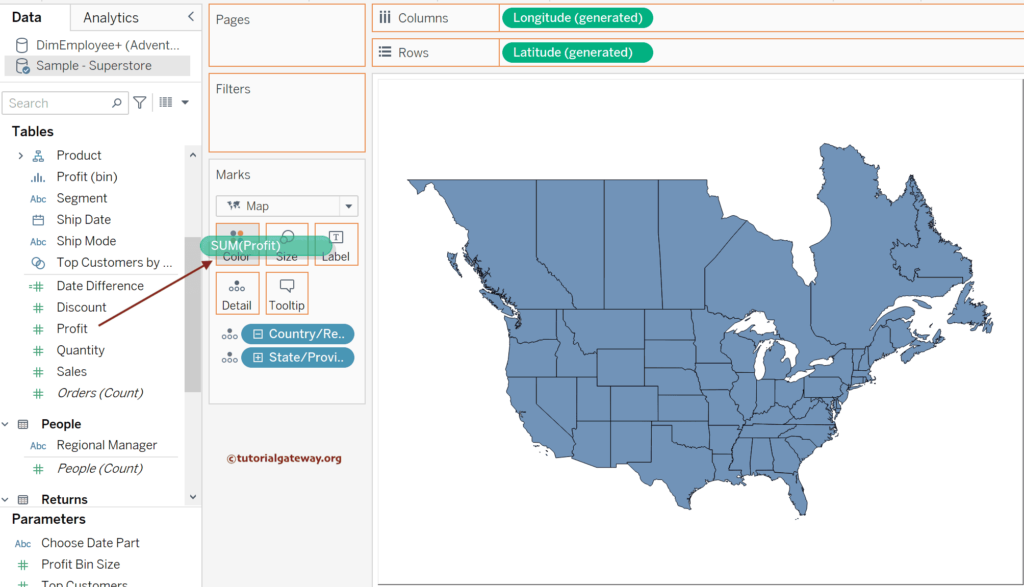
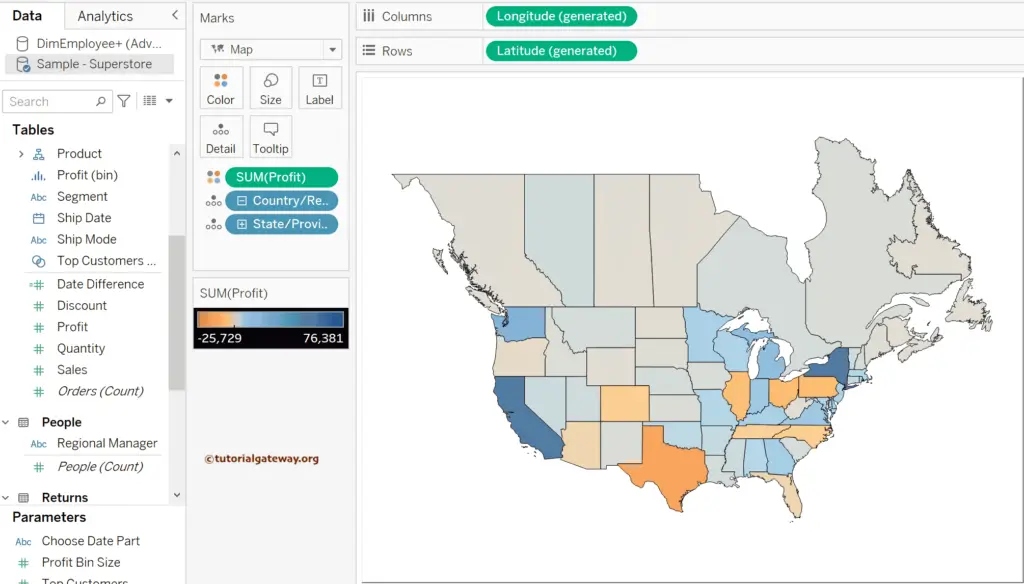
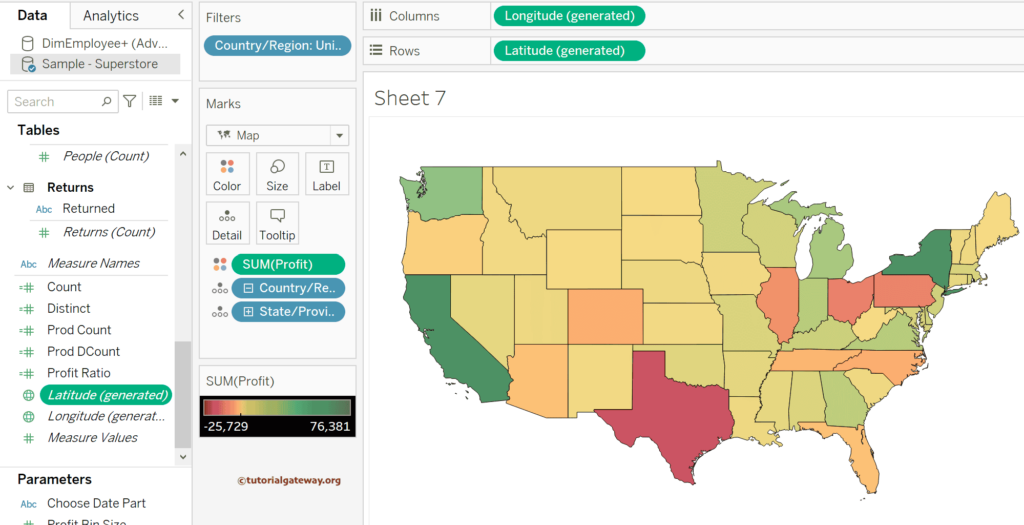
Drag and drop the Profit Measure to the Color Shelf to add distinct colors to the states in the USA and Canada. Here, dark blue means the highest Profit, and orange refers to the least or negative profits.
Next, click the Edit color button to change the default palette. Here, we choose the Red-Green-Gold Diverging palette with a Full Color Range option to see the below image.
In this example, we want to add a pie chart to the Tableau Maps, so dragging the state/province onto the map region will show you the Add Marks Layer option. Please drag on to it to add an extra layer on top of the Map.
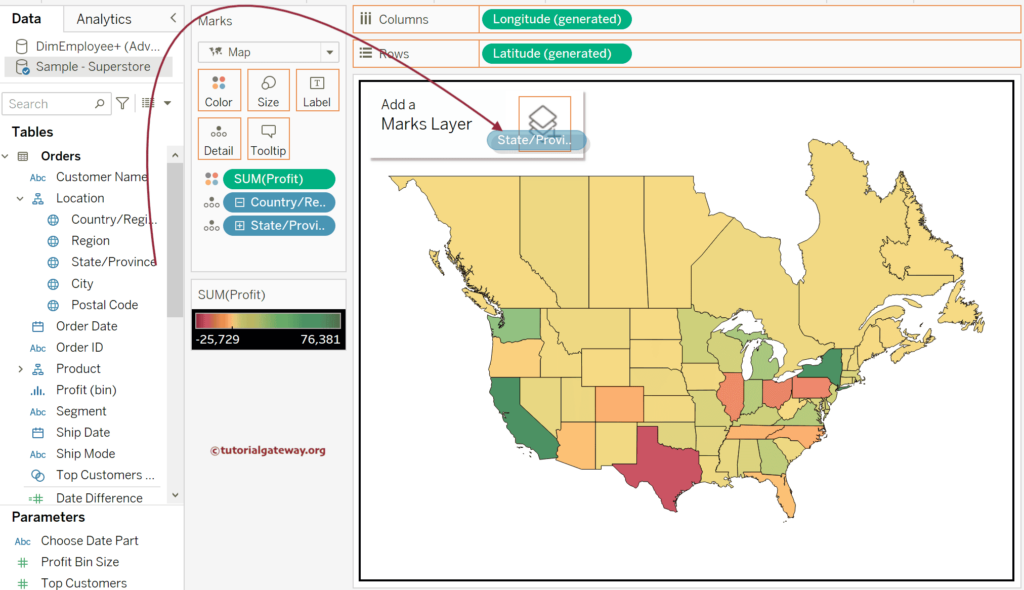
If you observe the report, it shows small circles on top of each state in the Map. It is because, by default, Mark’s shelf chooses the circle. Also, unknown locations point to the Canada region, so let me remove them from the display. Please add the Country/Region dimension to the Filters Shelf and uncheck the Canada.
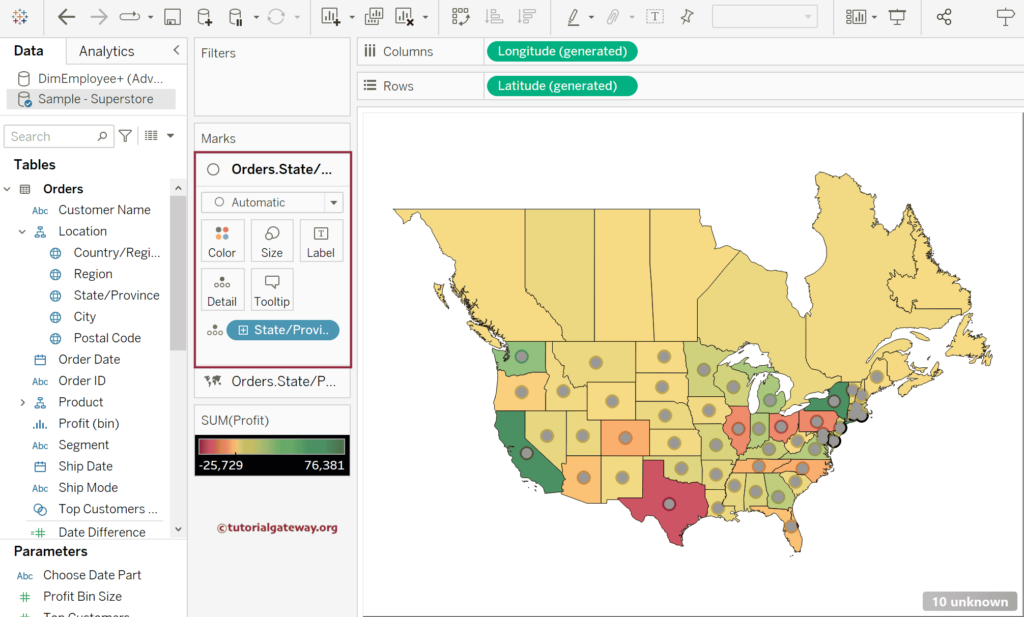
Please change the mark type from Automatic to Pie to add a pie chart on top of the Tableau Maps.
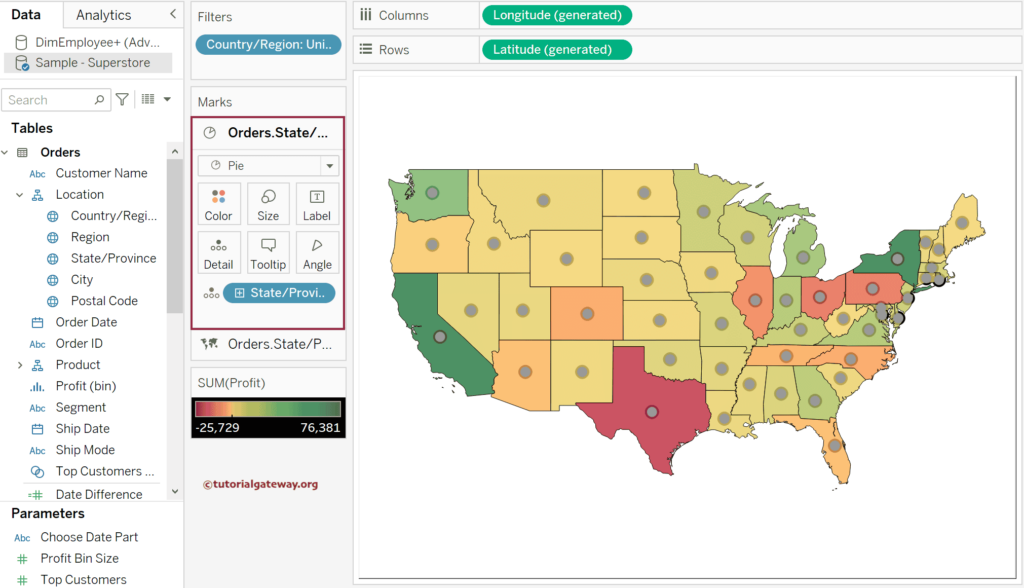
Next, add Category to the Color shelf to divide the Pie and Sales measure to the Angle that will decide the size of each Pie.
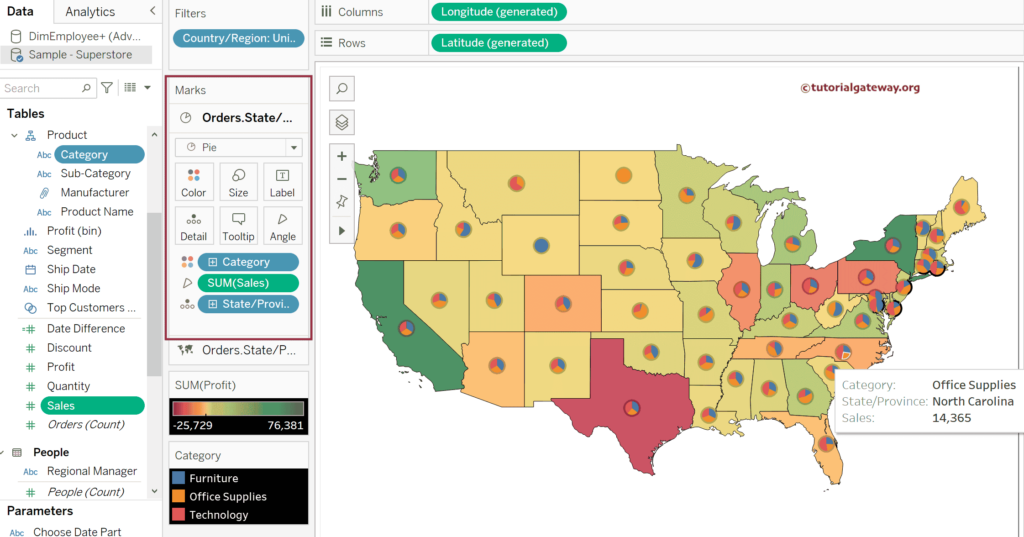
In the screenshot below, you can see the pie chart at the top of Maps. You can hover over any part of the Pie to see the information.
Add a Pie Chart to Tableau Maps using Dual Axis
The second approach to adding pie charts to Tableau maps involves the dual axis and synchronized axis options.
Double-click the State/Province or add Longitude (generated) to the Columns shelf and Latitude to the Rows shelf. Next, add Profit to the Map Color Shelf and Country to Filter shelf to choose USA.
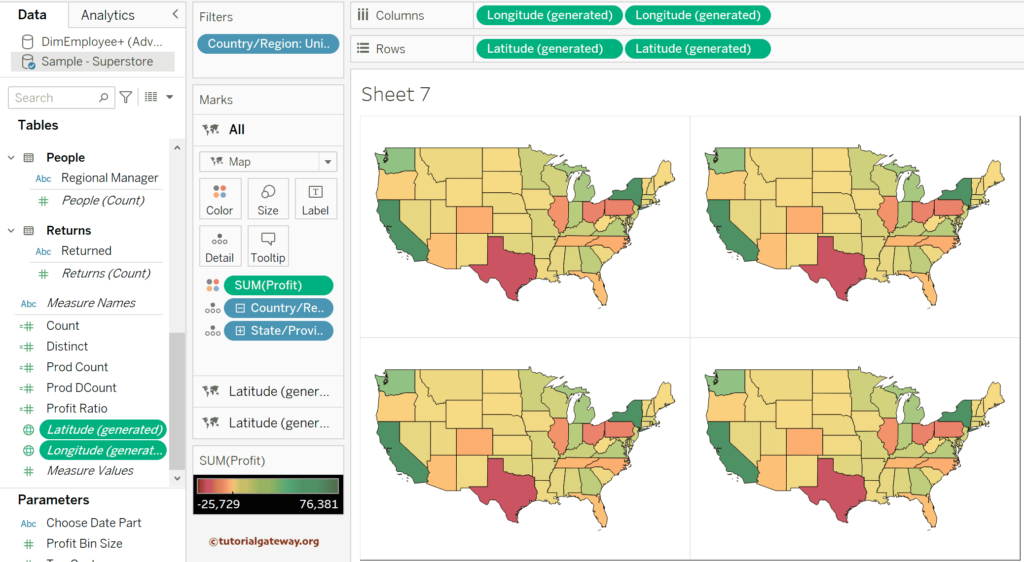
One more time, drag the Longitude to the Columns shelf and Latitude (generated) to the Rows shelf to generate the below-shown maps.
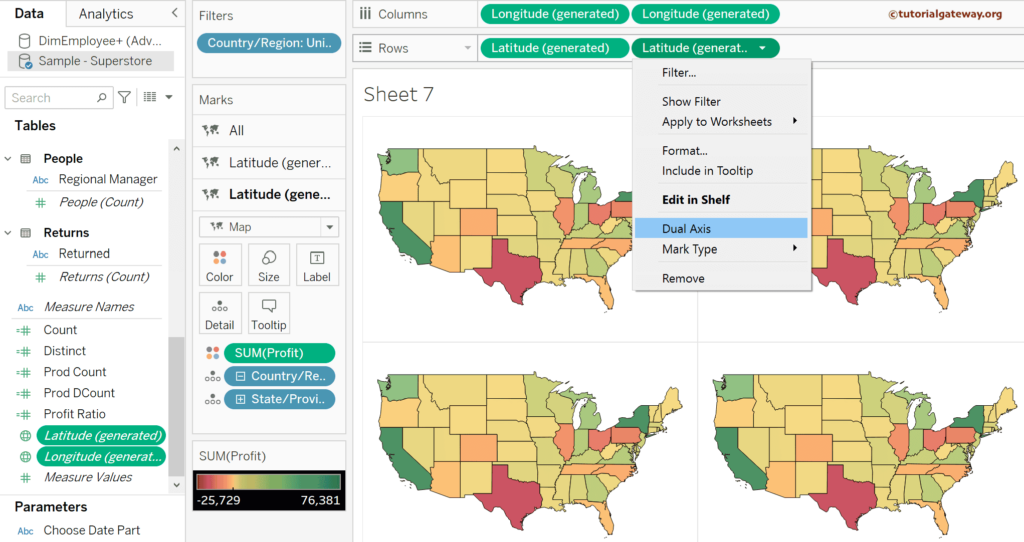
Click the Down arrow beside the Latitude (generated) and select the Dual Axis option from the context menu. Similarly, click the Down arrow beside the Longitude(generated) and choose the Dual Axis option.
Next, change the Marks type of the secondary axis to the Pie Chart. Don’t forget the Synchronize Axis option. For the remaining charts in Tableau, please click here.
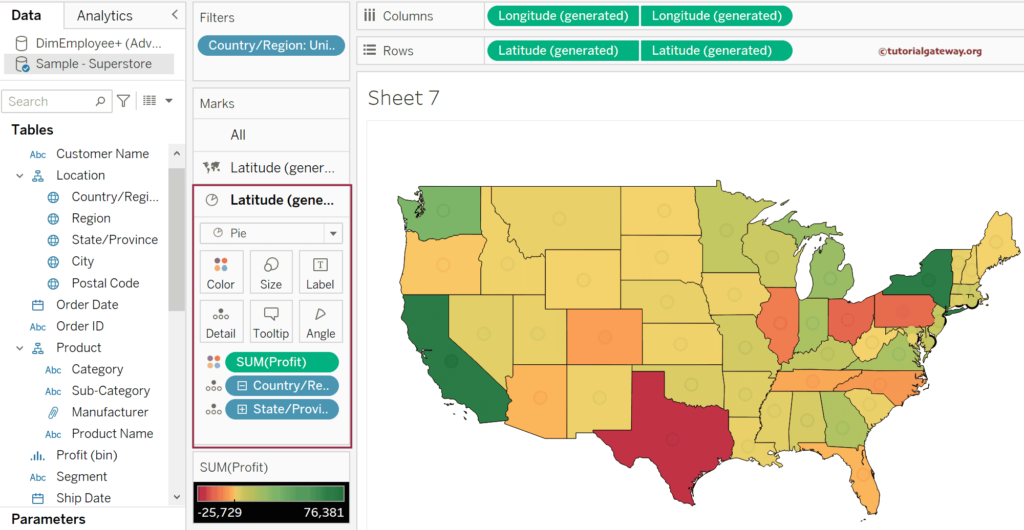
Please add Category to the Color shelf and Sales to the Angle shelf to display the pie chart on top of the Tableau maps.
