Data Labels in Tableau reports or any other Business Intelligence reports play a vital role in understanding the report data. For example, By seeing the bar chart or Pie chart, we can easily understand which country sales are higher than the other. However, we can’t see how many sales (in number) each country has made. In these situations, we can enable Data Labels in the country region.
In this article, we will show how to add data labels in tableau reports with examples. For this, we are going to use the SQL Server Data Source. So, please visit the Connecting to SQL Server article to understand the connection process.
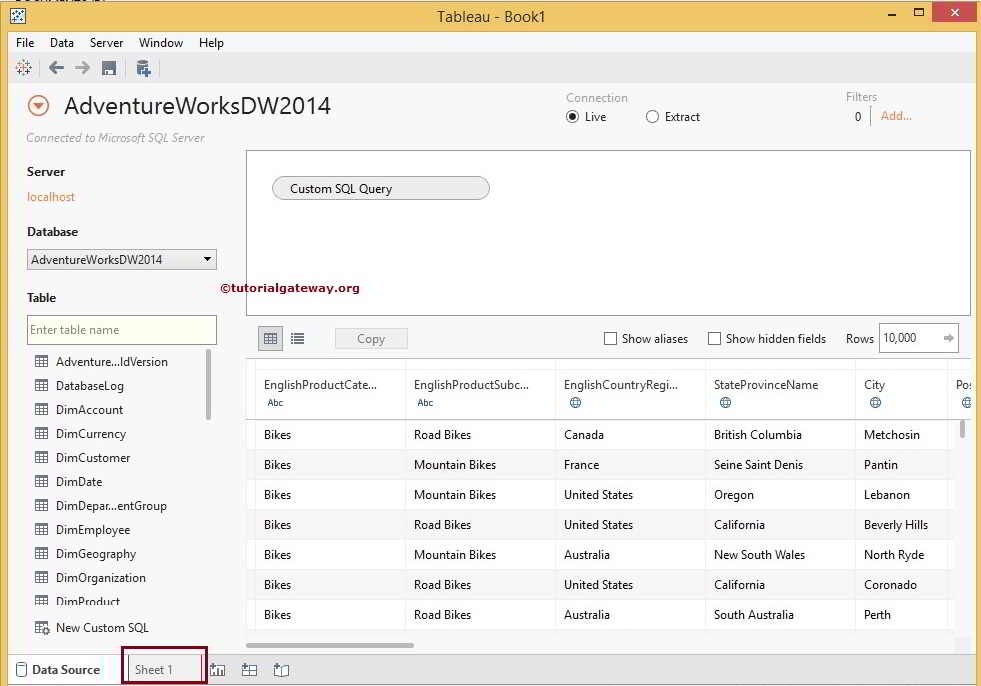
The custom SQL Query we used in the above data source is:
SELECT ProdCat.EnglishProductCategoryName,
       ProdSubCat.EnglishProductSubcategoryName,
       Geo.EnglishCountryRegionName,
       Geo.StateProvinceName,
       Geo.City,
       Geo.PostalCode,
       Geo.IpAddressLocator,
       Prod.EnglishProductName,
       Prod.Color,
       Prod.DealerPrice,
       Cust.FirstName,
       Cust.LastName,
       Cust.Gender,
       Cust.YearlyIncome,
       Cust.EnglishEducation,
       Cust.EnglishOccupation,
       Fact.OrderQuantity,
       Fact.TotalProductCost,
       Fact.SalesAmount,
       Fact.TaxAmt,
       Fact.OrderDate
FROM DimProductSubcategory AS ProdSubCat
   INNER JOIN
     DimProduct AS Prod ON ProdSubCat.ProductSubcategoryKey = Prod.ProductSubcategoryKey
   INNER JOIN
     DimProductCategory  AS ProdCat ON ProdSubCat.ProductCategoryKey = ProdCat.ProductCategoryKey
   INNER JOIN
     FactInternetSales AS Fact ON Prod.ProductKey = Fact.ProductKey
   INNER JOIN
     DimCustomer AS Cust ON Fact.CustomerKey = Cust.CustomerKey
   INNER JOIN
     DimGeography AS Geo ON Cust.GeographyKey = Geo.GeographyKey
NOTE: Don’t worry about the code and Joins we used in the above statement. Perhaps you should concentrate on Data Labels. However, If you want to learn SQL Server, Please visit our SQL tutorials page.
TIP: This is the query we will use for the rest of the tutorials.
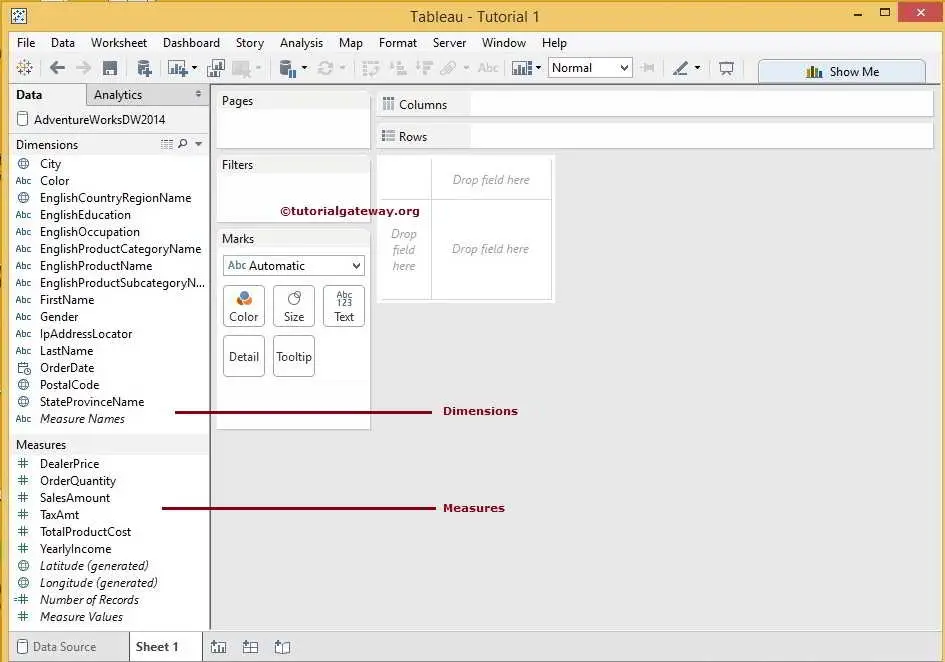
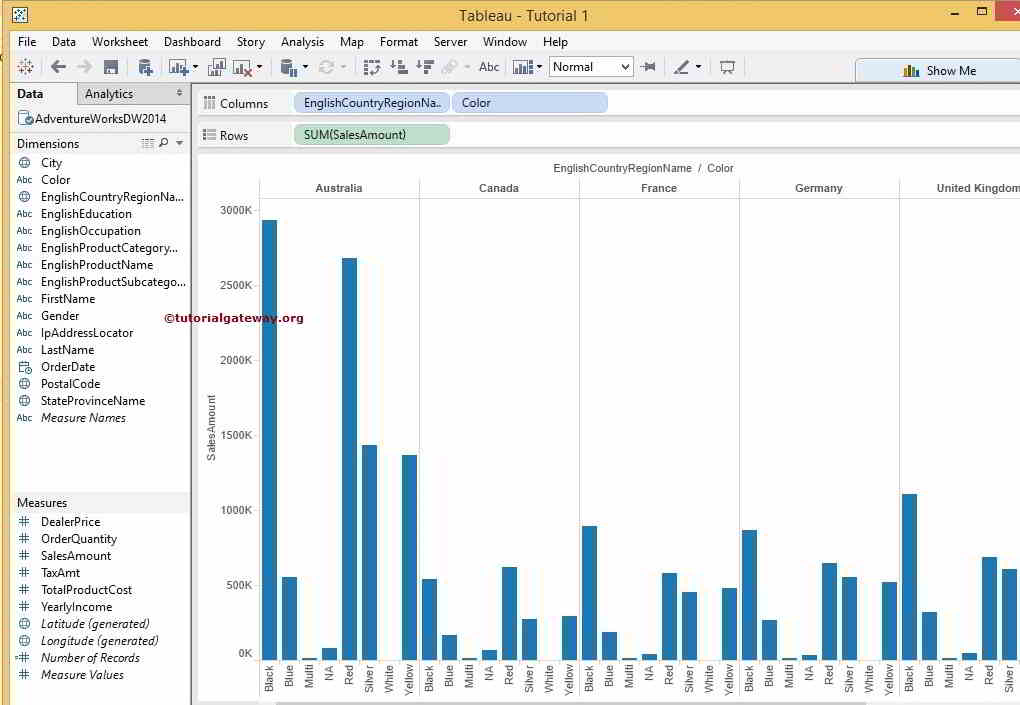
The below screenshot will show the Measures and Dimensions of the Data source.
Before we start enabling the Data labels, we will show you how to Swap rows and columns or flip the chart. To do this, click on the button we marked below.
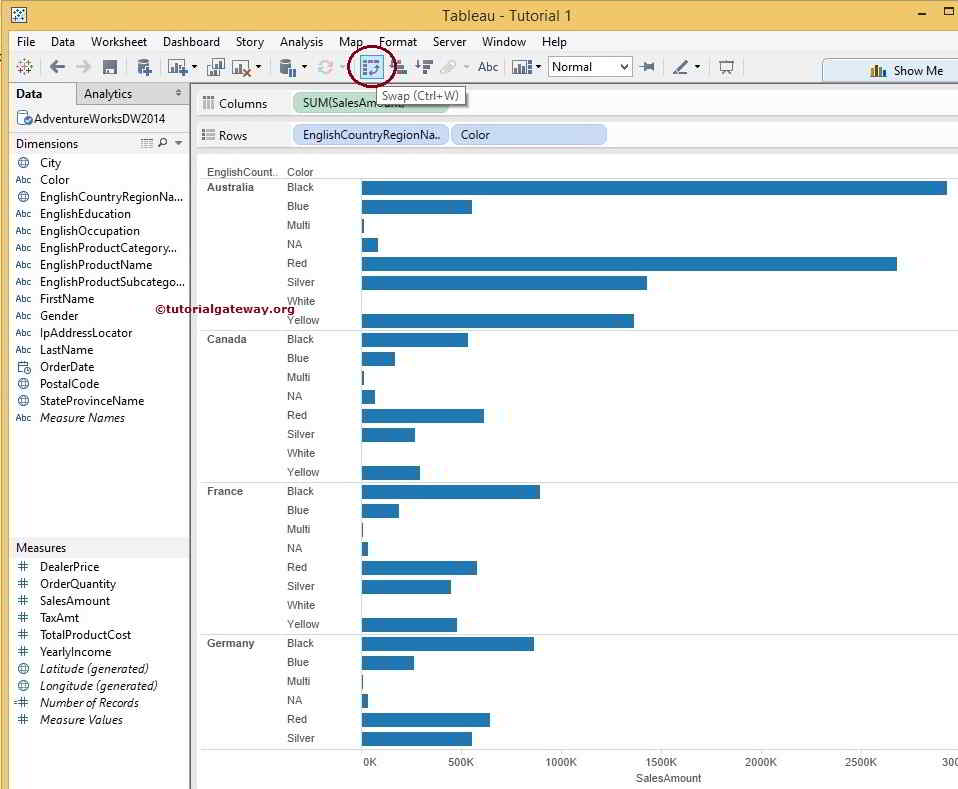
Once you click on that button, you can notice that the chart is swapped or flipped, as shown below.
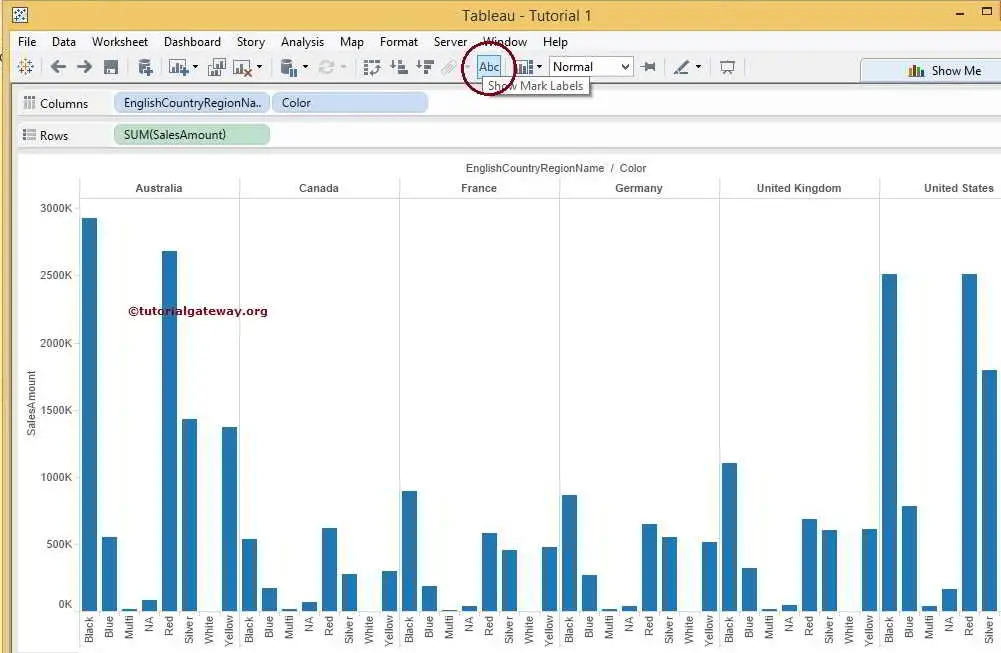
Method 1 to add Data Labels in Tableau Reports
The first method is to click on the Abc button in the toolbar. From the below screenshot, you can observe that when you hover on the Abc button, it will show the tooltip Show Mark Labels.
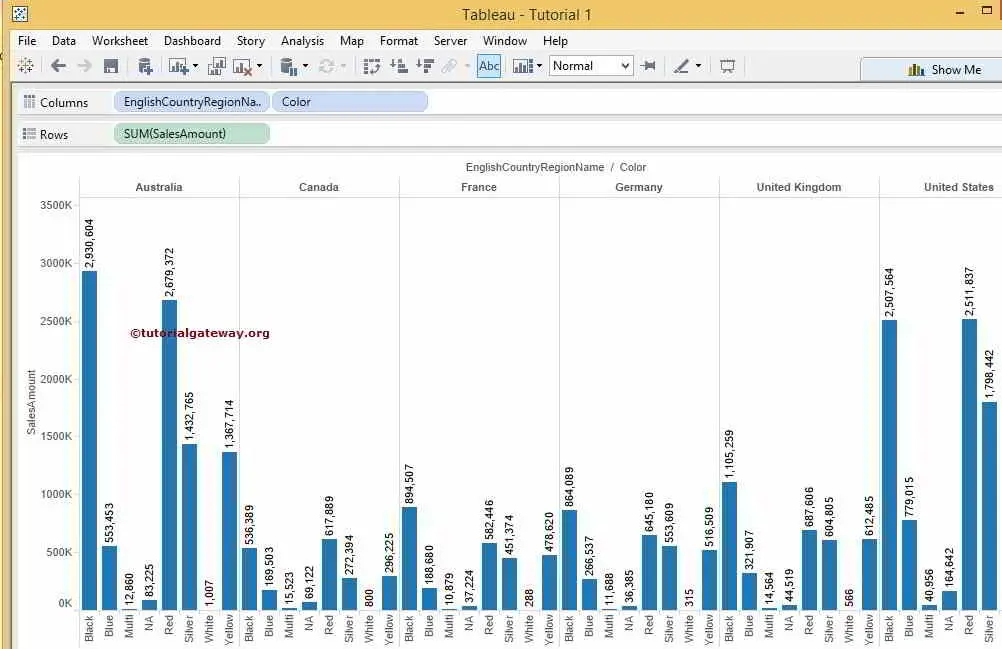
Once you click on the Abc button, Data Labels will be shown in the Reports, as shown below.
Method 2 to add Data Labels in Tableau Reports
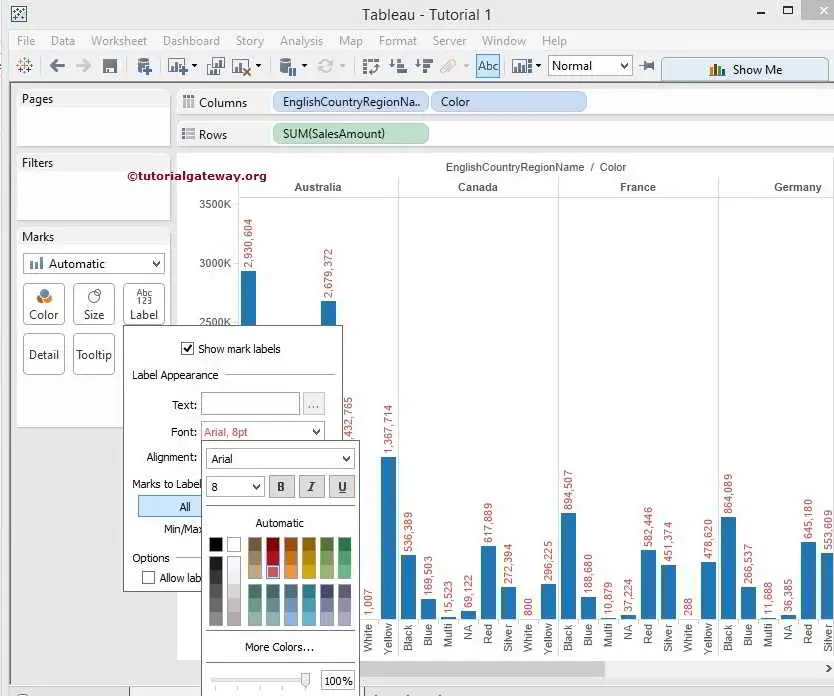
The second method is to Click the Abc Label button present in the Marks Card. From the screenshot below, observe when we Click on the Abc Label button, a drop-down window will be displayed.
From the drop-down window, Please check to mark the Show Mark Labels option to enable data labels in tableau reports.

Using this drop-down window, We can also format the text, color, and alignments to the data labels in tableau reports. From the below screenshot, we see that we changed the color.