Tableau Bump Chart compares one Dimension against another Dimension using one of the Measure values. The Bump Chart is useful for exploring Rank changes over time or by region, etc.
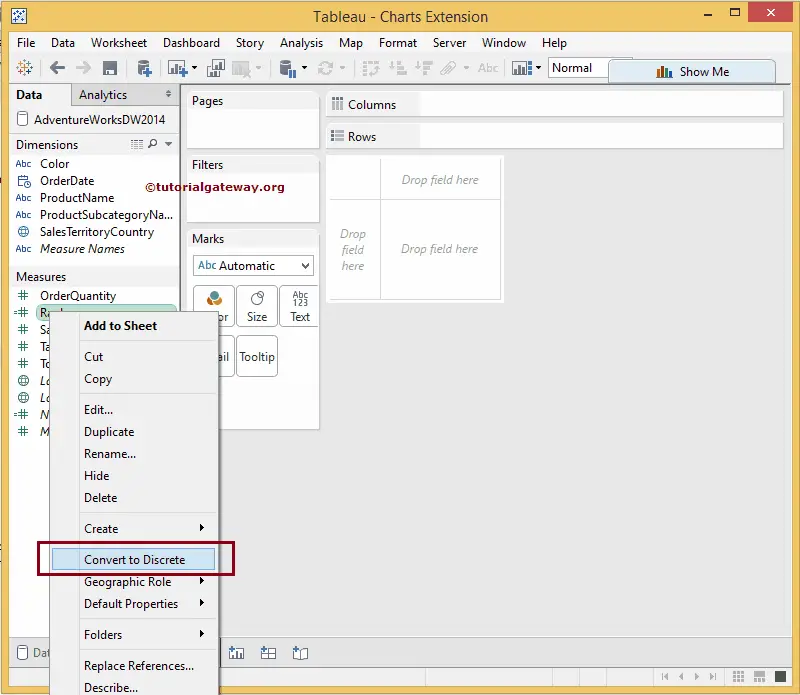
Before we create a Bump Chart, let us create one calculated field to rank the Dimension members based on the Measure value. To do this, select the Create Calculated Field option from the Analysis Menu.
Create a Tableau Bump Chart
Once you select the Create Calculated Field option, a new window will open to write the Custom Expression. For now, we used the Built-in function called INDEX() and named it Rank.
INDEX()
For this Tableau Bump Chart, we converted the newly created calculated field to Discrete by right-clicking on the Rank field and selecting the Convert to Discrete option.
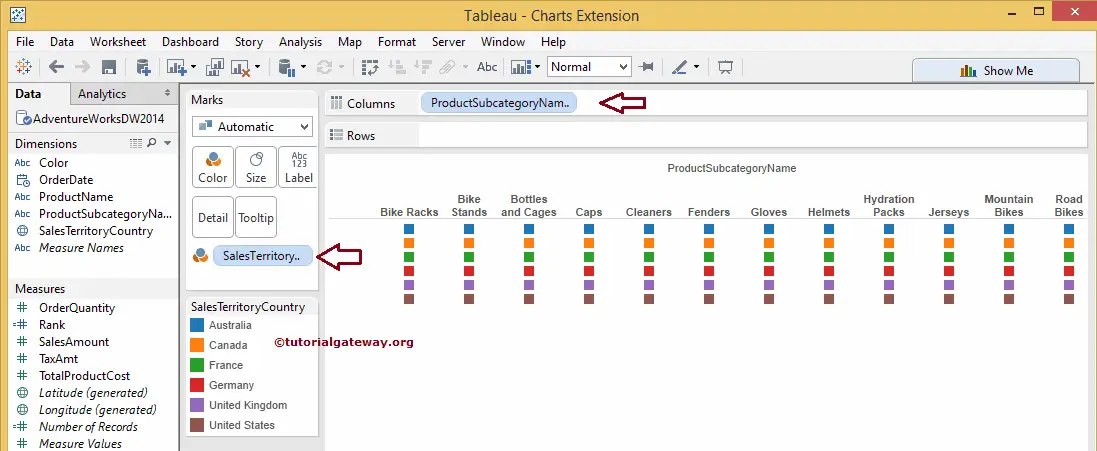
To create a Bump Chart, Drag and Drop the Product Sub Category Name from the Dimension Region to the Columns Shelf. Next, the Sales Territory Country to the Color column is present in the Marks card.
Next, drag and drop the newly created Tableau calculated field, Rank, from the Measures Region to the Rows Shelf. For more Charts >> Click Here.
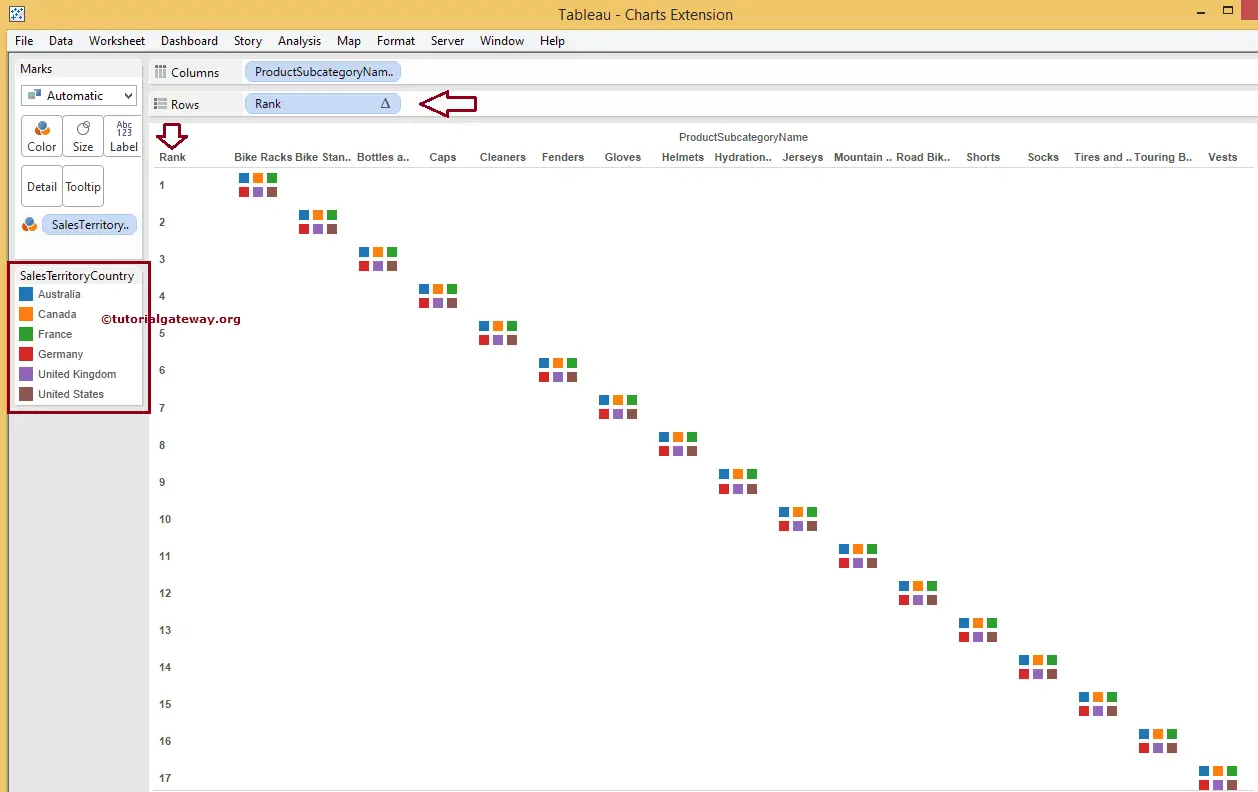
The above Tableau bump chart screenshot shows that the Rank column ranks as first come, first serve. It means the First product is marked as 1, the second product as 2, and the Last product as 17. Because, by default, the Rank field is computing using the Table Across option.
However, we intended to rank the Product Subcategory Name against the Country Name using the Sales Amount Measure. Before changing the calculated field, let us change the Mark type from Automatic to Line Plot. After the completion, the following Bump Chart screenshot will appear.
In order to alter the table calculation of the field, please click on the Rank field on the Column shelf and select Edit Table Calculation..
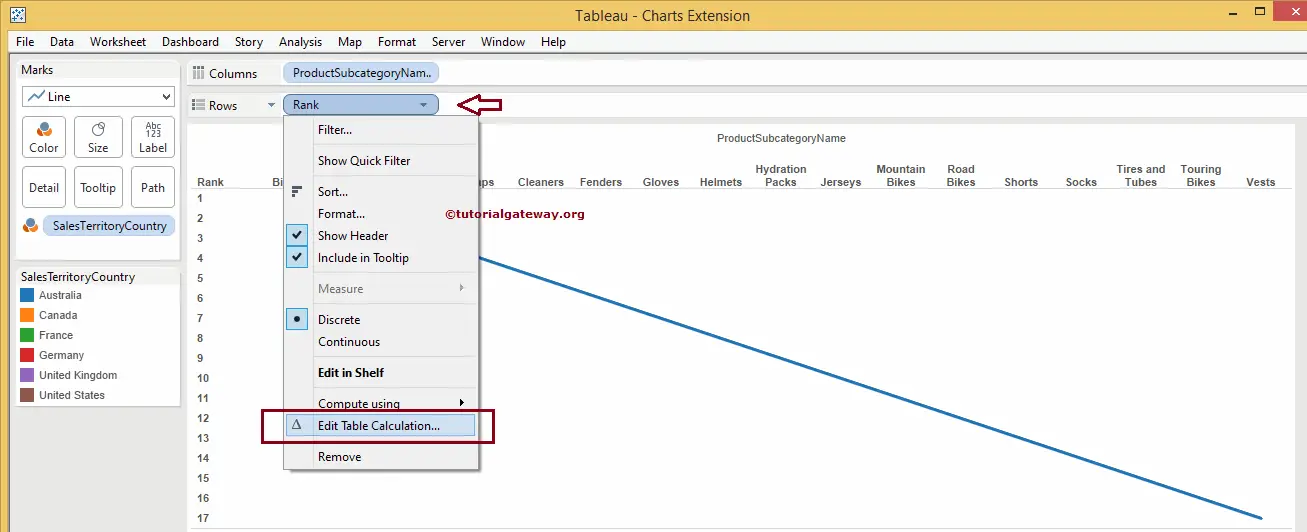
Once you choose the Edit Table Calculation.. option, a new window will open. From the screenshot below, you can observe that the field is calculating the rank using the Table (Across) option. That’s why the First product is marked as 1, the second as two, and so forth.
In this Tableau Bump Chart example, we intend to rank the field by Sales Amount. To achieve the same, select the Advanced option from the Compute Using the drop-down menu.
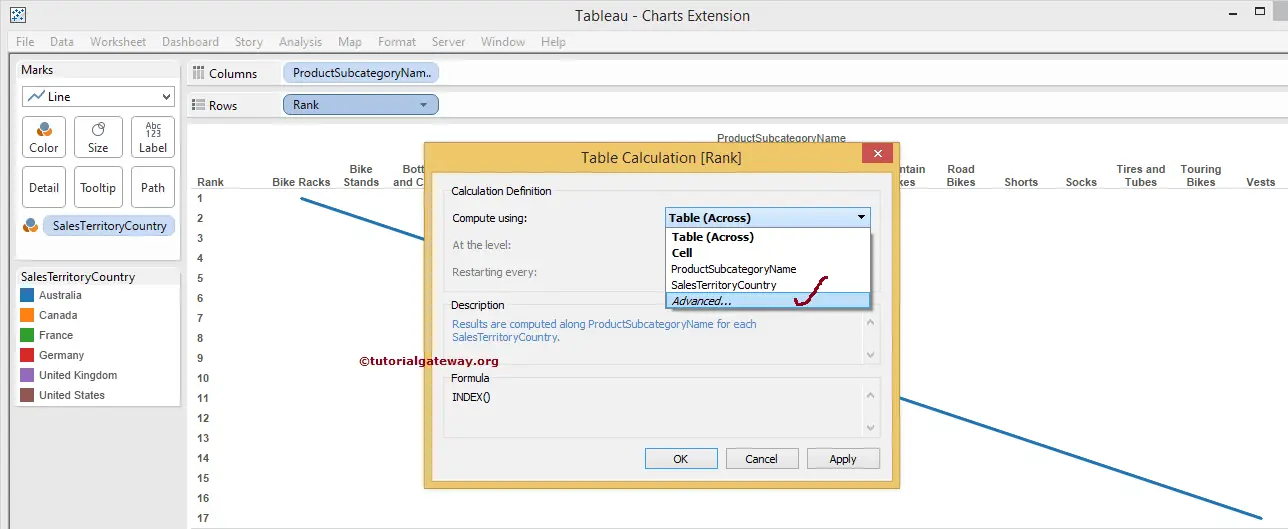
Once you choose the Advanced option, a new window will open. Please transfer the Product Subcategory Name and Sales Territory Country columns from the Partitioning to Addressing pane. Next, change the Sort option from Automatic to Filed. Next, select the filed name and aggregate field from the drop-down menus.
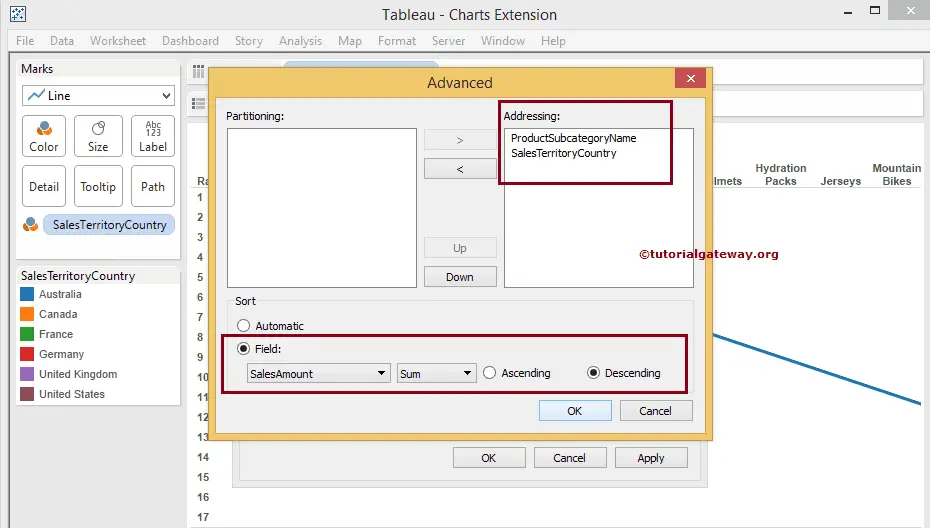
In this Bump Chart example, we want to rank the fields by Sales Amount. So, we select the Sales Amount as the Filed Name, Sum as the Aggregated filed, and Sort order as Descending.
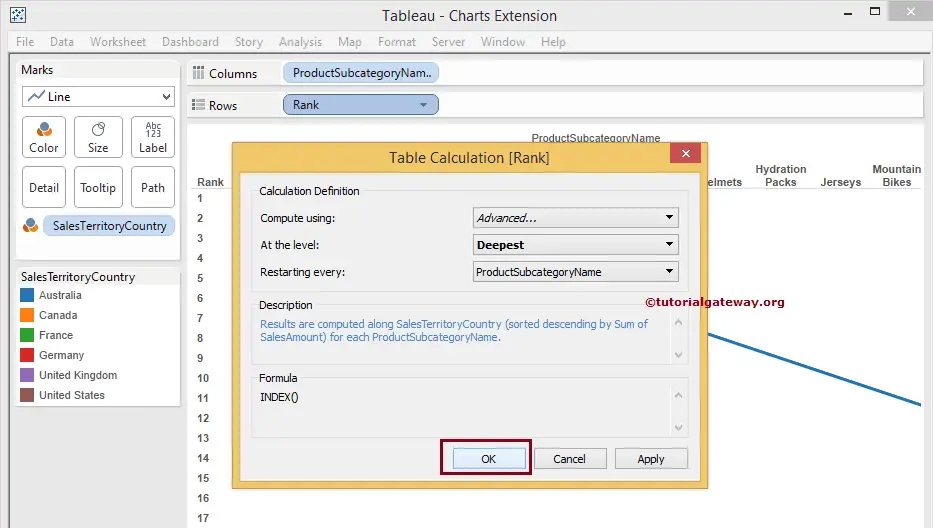
Click OK and change the Restarting Every option from None to Product Subcategory Name. It means Table calculation will check for every new product and rank them using their Sales Amount. Then, click OK to finish assigning the Table Calculation to our Tableau Bump Chart.
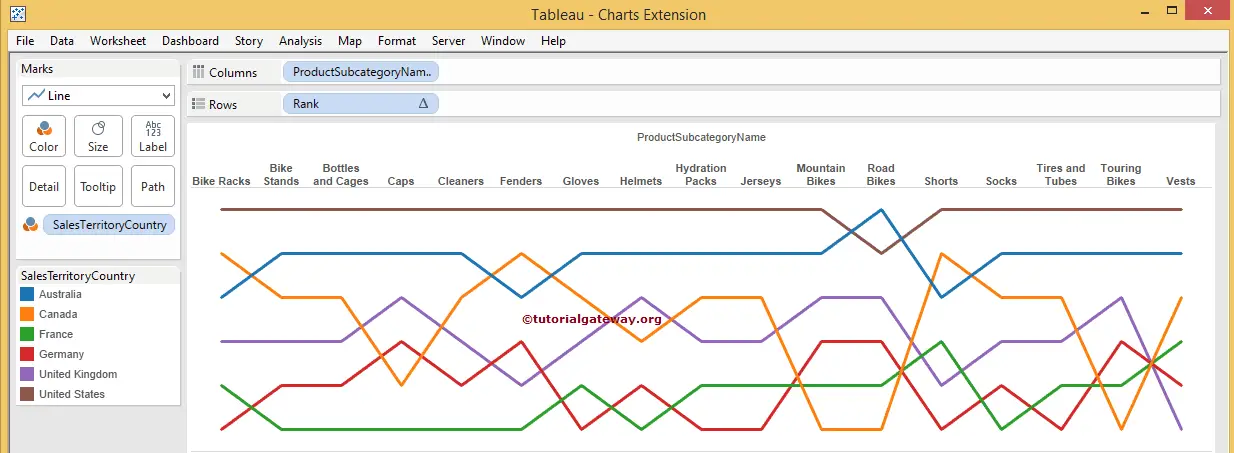
Let us see our final Bump Chart preview.
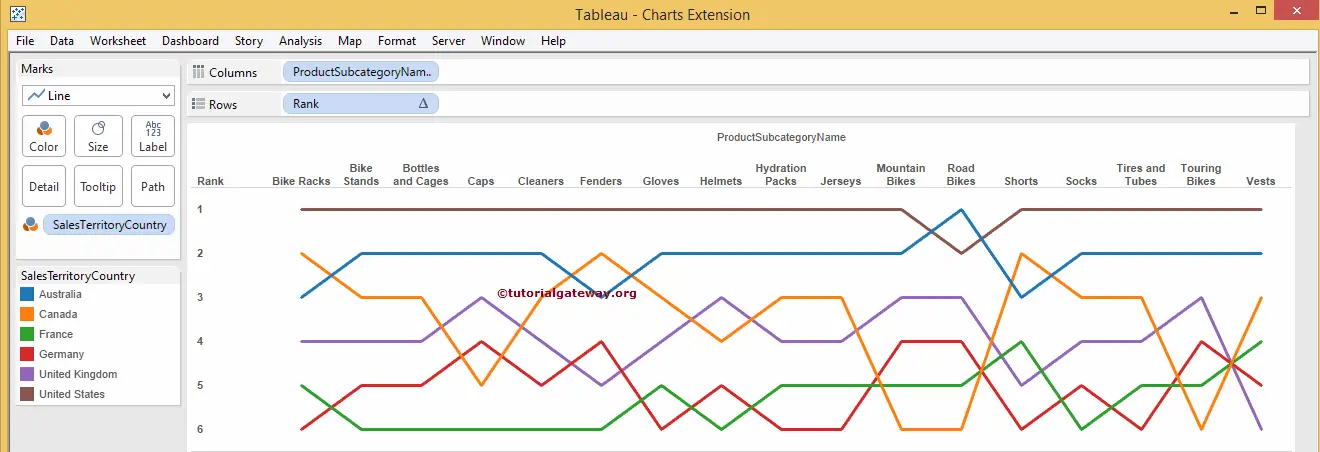
If you are not comfortable with the field in a separate Row. Please click on the down arrow of the Rank field on the Rows shelf and uncheck the Show Header option from the drop-down menu. We successfully created a Tableau Bump Chart.