The R ggplot2 dot Plot or dot chart consists of a data point drawn on a specified scale. Let me show how to Create an R ggplot dotplot, Format its colors, and plot horizontal dot plots with an example.
For this ggplot2 Dot Plot demonstration, we use the airquality data set provided by the studio. The syntax to draw a dot plot in this Programming is
geom_dotplot(binaxis = "x", mapping = NULL, data = NULL,
  position = "identity", ..., method = "dotdensity",binwidth = NULL,
  stackratio = 1, binpositions = "bygroup", stackdir = "up", right = TRUE,
  stackgroups = FALSE, dotsize = 1, show.legend = NA, origin = NULL,
  width = 0.9, na.rm = FALSE, inherit.aes = TRUE, drop = FALSE)
Create a basic R ggplot2 Dot Plot
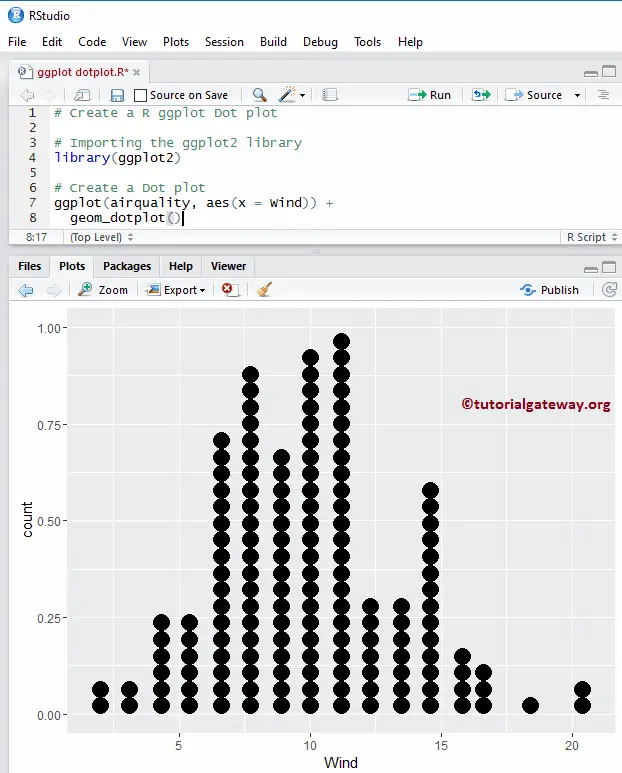
In this example, we show you how to create a basic dotplot using the ggplot2 package. For this, we are going to use the airquality data set provided by the R Studio.
TIP: ggplot2 package not installed by default. Please refer Install R Packages article to install a package in R Programming.
# Create a ggplot Dot plot

# Importing the ggplot2 library
library(ggplot2)

# Create a Violin plot
ggplot(airquality, aes(x = Wind)) +
  geom_dotplot()
Change the R ggplot2 Dot Plot binwidth
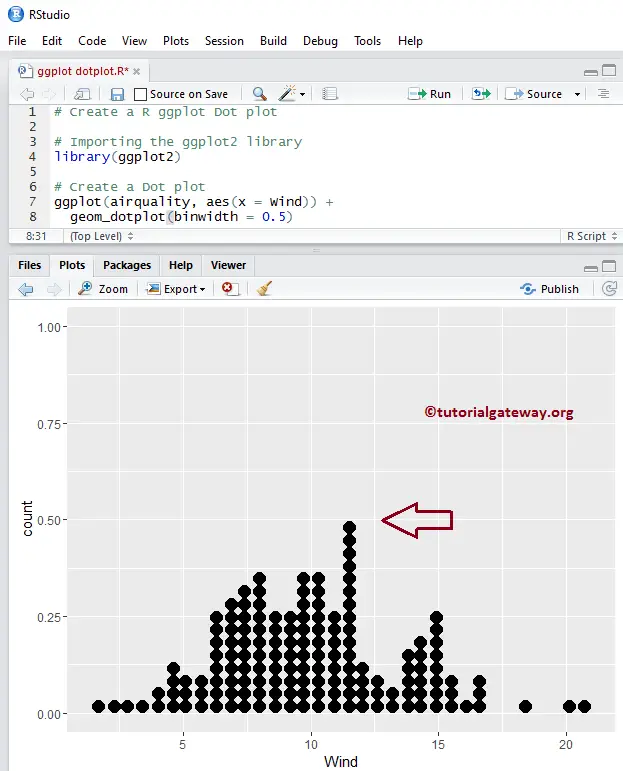
In this R ggplot dotplot example, we show how to change the bin width of a dot plot using the binwidth argument.
binwidth:
- When the method = “dotdensity” (default), binwidth specifies maximum bin width.
- When the method = “histodot”, binwidth specifies bin width.
NOTE: If you require to import data from external files, then please refer R Read CSV article to import the CSV file.
# Change the binwidth of an R ggplot Dot plot

# Importing the ggplot2 library
library(ggplot2)

# Create a Dot plot
ggplot(airquality, aes(x = Wind)) +
  geom_dotplot(binwidth = 0.5)
Change ggplot2 Dot Plot method
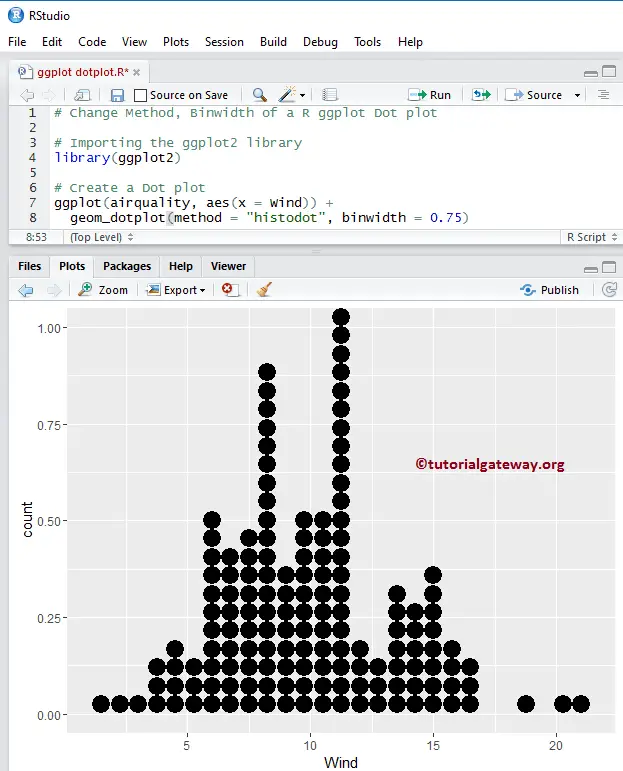
In this R ggplot dotplot example, we show how to change the method of a dot plot using the method argument.
- method: By default, its value is dotdensity, but you can change it to histodot for fixed bin widths.
# Change Method, Binwidth of the ggplot Dot plot

# Importing the ggplot2 library
library(ggplot2)

# Create a Dot plot
ggplot(airquality, aes(x = Wind)) +
  geom_dotplot(method = "histodot", binwidth = 0.75)
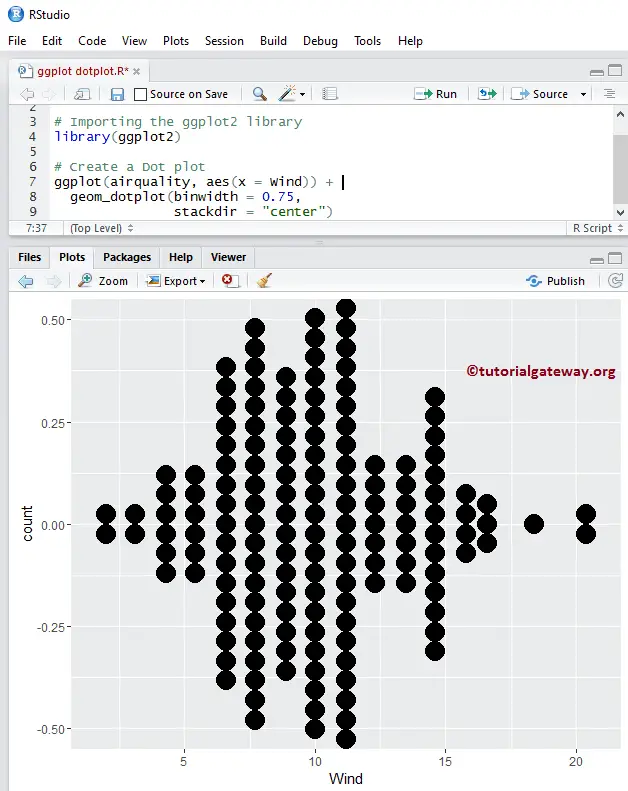
Change R ggplot2 Dot Plot stack Direction
In this ggplot dotplot example, we change the dot stack direction in a dot plot using the stackdir argument.
- stackdir: By default, its value is up (it means dots stacked in the upward direction), but you can change to down, center, and centerwhole.
# Change Stack Direction

# Importing the ggplot2 library
library(ggplot2)

# Create a Dot plot
ggplot(airquality, aes(x = Wind)) +
  geom_dotplot(binwidth = 0.75,
               stackdir = "center")
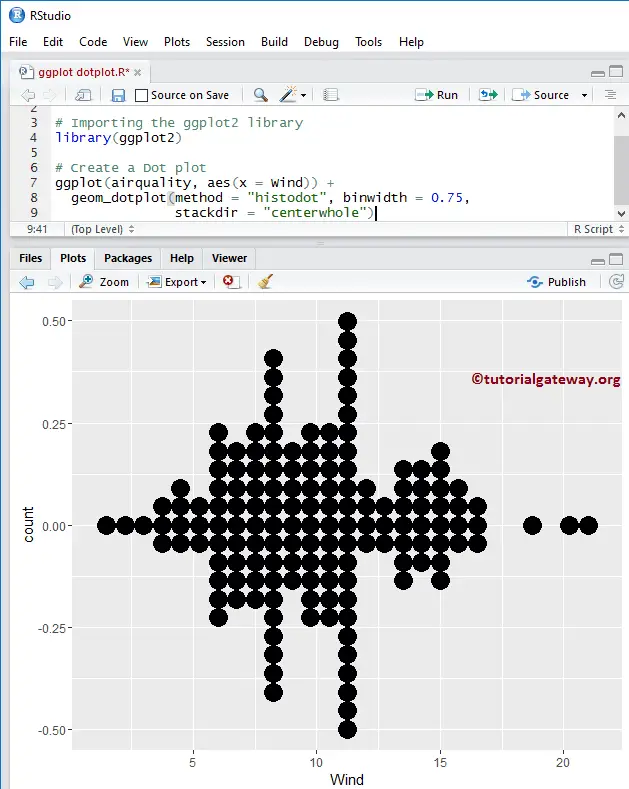
Change ggplot2 Dot Plot stack Direction 2
Here, we are changing the stack direction value from center to centerwhole
# Change Stack Direction of an ggplot Dot plot

# Importing the ggplot2 library
library(ggplot2)

# Create a Dot plot
ggplot(airquality, aes(x = Wind)) +
  geom_dotplot(method = "histodot", binwidth = 0.75,
               stackdir = "centerwhole")
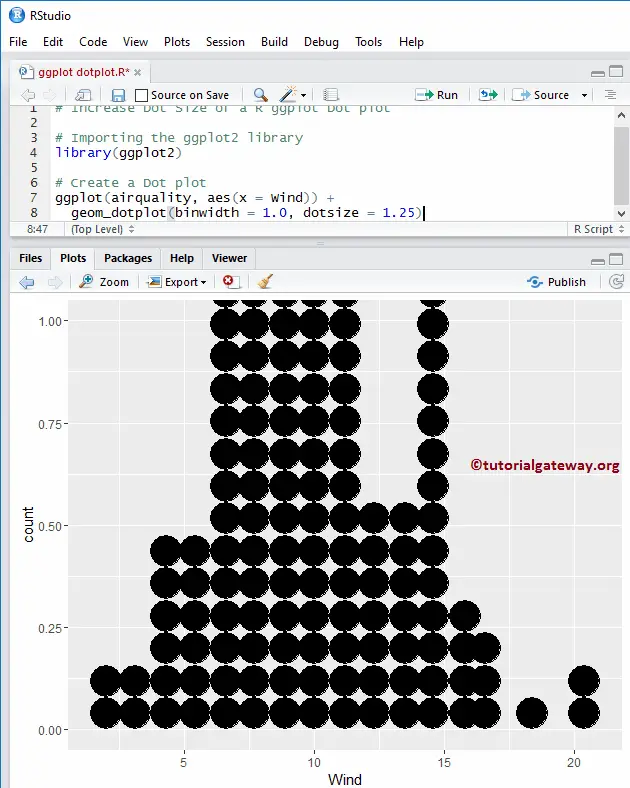
Alter R ggplot2 Dot Plot Dot size
In this example, we change the dot size in an R ggplot dotplot using the dotsize argument.
# Increase Dot Size of a ggplot Dot plot

# Importing the ggplot2 library
library(ggplot2)

# Create a Dot plot
ggplot(airquality, aes(x = Wind)) +
  geom_dotplot(binwidth = 1.0, dotsize = 1.25)
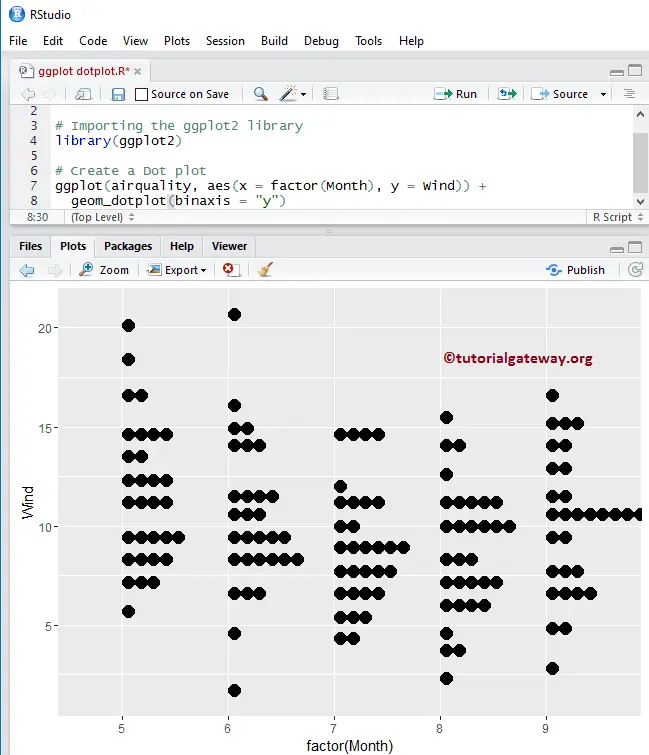
ggplot2 Dot Plot Stacking on the y-axis
In this example, we change the stack axis to the y-axis
# ggplot Dot plot - Stacking on the Y-Axis

# Importing the ggplot2 library
library(ggplot2)

# Create a Dot plot
ggplot(airquality, aes(x = factor(Month), y = Wind)) +
  geom_dotplot(binaxis = "y")
R ggplot2 Dot Plot Stacking on y-axis 2
In this example, we are changing the stack direction
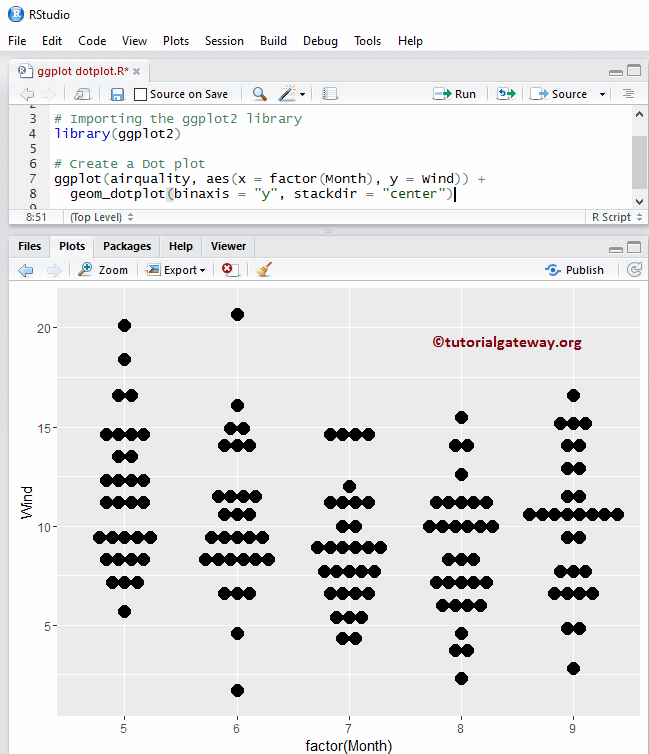
# ggplot Dot plot - Stacking on Y-Axis

# Importing the ggplot2 library
library(ggplot2)

# Create a Dot plot
ggplot(airquality, aes(x = factor(Month), y = Wind)) +
  geom_dotplot(binaxis = "y", stackdir = "center")
Change Colors of a Dot Plot in R
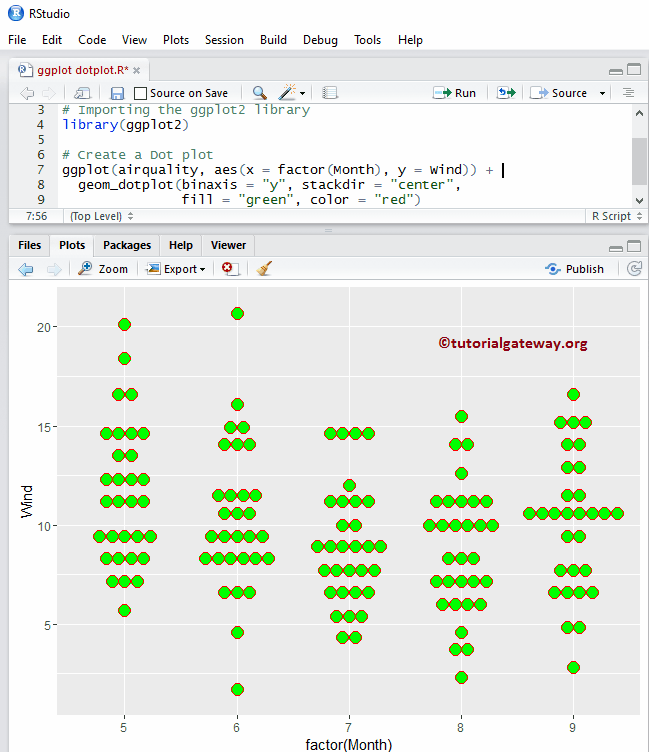
Let us change the dot plot colors using fill argument
- fill: Please specify the color you want to use for your dot plot. Type colors() in your console to get the list of colors available in R programming
- color: Assign the color for the borders of a dot
# Change Colors of an ggplot Dot plot

# Importing the ggplot2 library
library(ggplot2)

# Create a Dot plot
ggplot(airquality, aes(x = factor(Month), y = Wind)) +
  geom_dotplot(binaxis = "y", stackdir = "center",
               fill = "green", color = "red")
Change Colors of an R Dot Plot using Columns
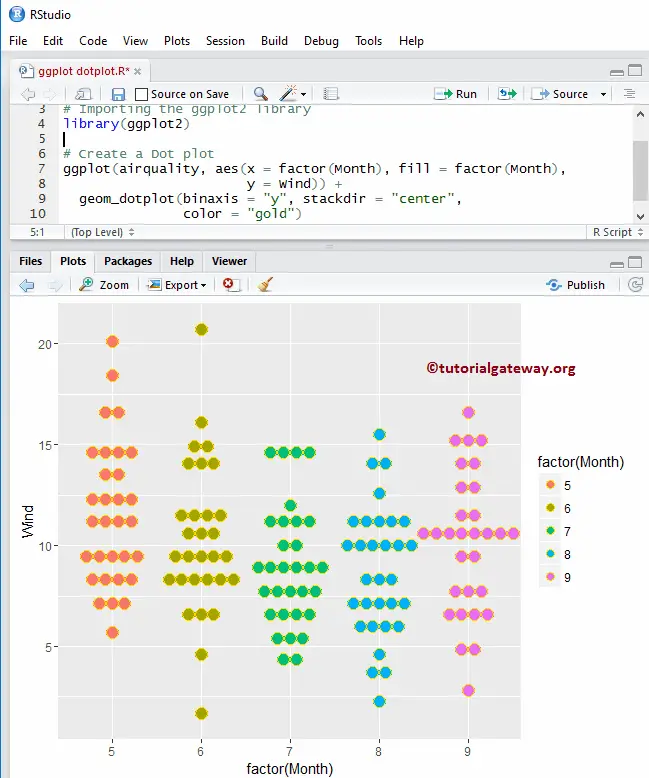
Let us see how to change the dot plot colors using column data. Here, we are using the Month column data to differentiate the colors
# Change Colors of an ggplot Dot plot

# Importing the ggplot2 library
library(ggplot2)

# Create a Dot plot
ggplot(airquality, aes(x = factor(Month), fill = factor(Month),
                       y = Wind)) +
  geom_dotplot(binaxis = "y", stackdir = "center",
               color = "gold")
Change Colors of a R Dot Plot using Columns 2
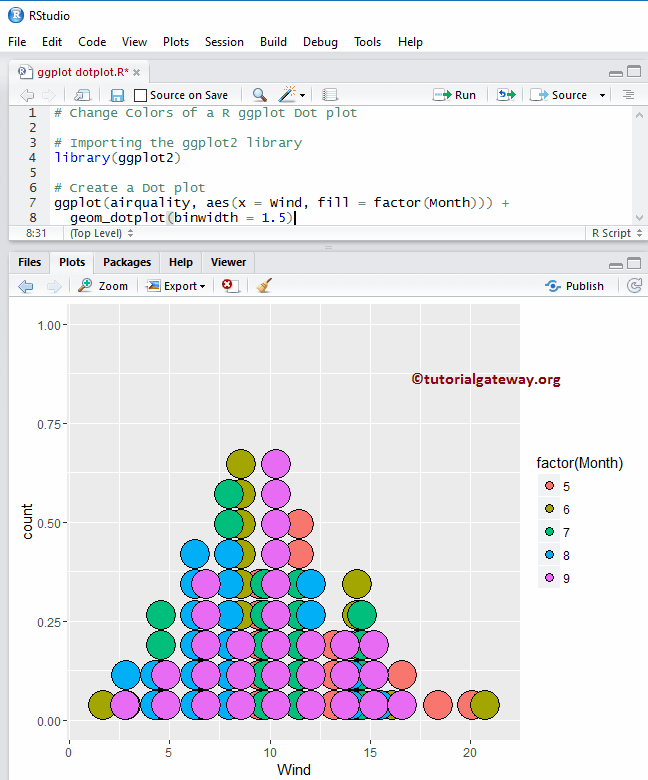
Here, we removed the y-axis of the R ggplot dotplot
# Change Colors of an ggplot Dot plot

# Importing the ggplot2 library
library(ggplot2)

# Create a Dot plot
ggplot(airquality, aes(x = Wind, fill = factor(Month))) +
  geom_dotplot(binwidth = 1.5)
Multiple groups in R ggplot2 Dot plot
In this R ggplot dotplot example, we show how to group multiple dot plots
- stackgroups: Please specify whether you want to stack the dots across groups or not.
- binpositions: When the method is “dotdensity”,
- and the binpositions = “bygroup” decide the positions of the bins for each group separately.
- binpositions = “all” determines the positions of the bins by taking all the data together. Therefore, we can use this for aligning dots across multiple groups.
# Multiple Groups in ggplot Dot plot

# Importing the ggplot2 library
library(ggplot2)

# Create a Dot plot
ggplot(airquality, aes(x = Wind, fill = factor(Month))) +
  geom_dotplot(binwidth = 1.0, stackgroups = TRUE, binpositions="all")

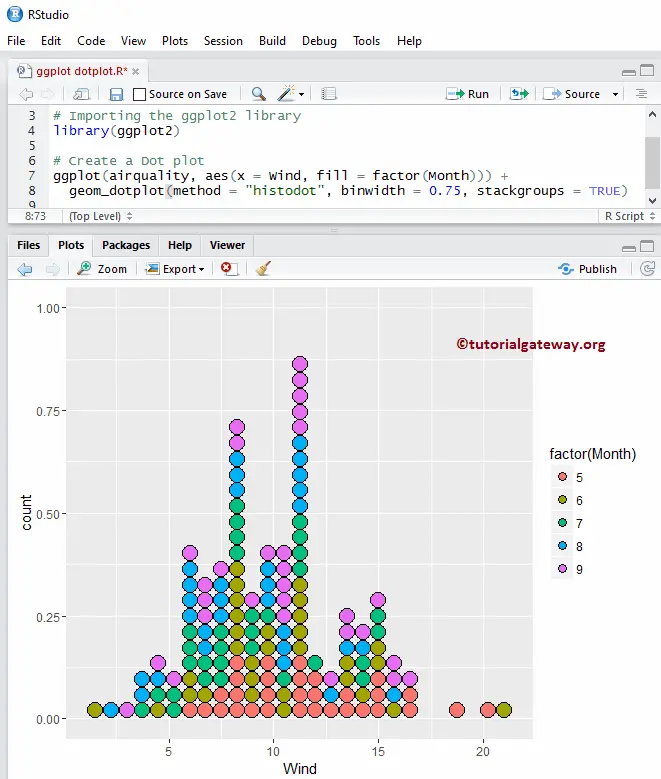
Multiple groups inggplot2 Dot plot 2
In this R ggplot dotplot example, we removed the binpositions argument from the geom_dotplot() function. We added the histodot value to the method argument.
# Multiple Groups in ggplot Dot plot

# Importing the ggplot2 library
library(ggplot2)

# Create a Dot plot
ggplot(airquality, aes(x = Wind, fill = factor(Month))) +
  geom_dotplot(method = "histodot", binwidth = 0.75, stackgroups = TRUE)
Assigning names to R ggplot Dot Plot
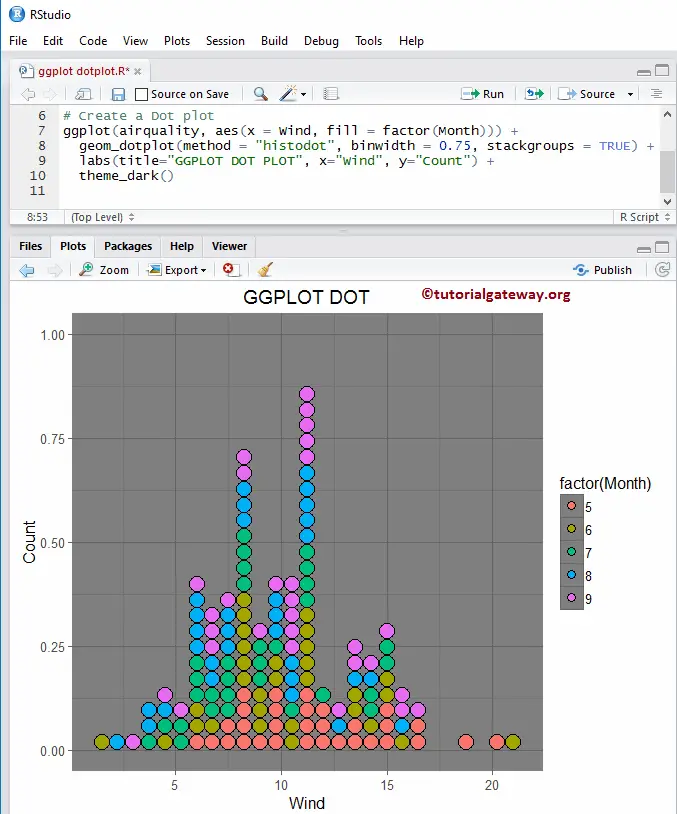
In this ggplot dotplot example, we assign names to the ggplot dot plot, X-Axis, and Y-Axis using labs function, and change the default theme of a ggplot Dot Plot.
- theme_dark(): We use this function to change the dotplot default theme to dark. If you type theme_, then R Studio intelligence shows the list of available options. For example, theme_grey()
# Multiple Groups in ggplot Dot plot

# Importing the ggplot2 library
library(ggplot2)

# Create a Dot plot
ggplot(airquality, aes(x = Wind, fill = factor(Month))) +
  geom_dotplot(method = "histodot", binwidth = 0.75, stackgroups = TRUE) +
  labs(title="GGPLOT DOT PLOT", x="Wind", y="Count") +
  theme_dark()