The Pie Chart in R is very useful to display the region-wise sales, Countrywide customers, Sales by Country, etc. Let me show how to Create, Format its color and borders, add legions, and create a 3D Pie Chart with an example.
R Pie Chart Syntax
The syntax Of a pie chart is as shown below
pie(x, labels = names(x), col = NULL, main = NULL)
The complex syntax behind this Pie Chart in this Programming :
pie(x, labels = names(x), edges = 200, radius = 0.8, clockwise = FALSE,
     init.angle = if(clockwise) 90 else 0, density = NULL, angle = 45,
     col = NULL, border = NULL, lty = NULL, main = NULL, ..)
The Pie Chart supports many arguments in R programming language, and the following are the most used arguments in real-time:
- x: Please specify a vector of non-negative numeric values. It decides the size of each slice.
- labels: This argument helps us to pass names to each slice.
- edges: Th numeric value accepted by this argument changes the outer circle of the pie. We strictly recommend keeping the value to a default of 200.
- radius: This is the radius of the circle whose value is between -1 and 1
- clockwise: A Boolean value indicates if slices drew in the clockwise or counter-clockwise direction. By default, it is counter-clockwise
- init.angle: This argument can help you to specify the starting angle (in degrees) for slices. By default, it is 0. If the clockwise is TRUE. Then init.angle becomes 90 degrees.
- density: Please specify the shading line’s density (in lines per inch). By default, it is NULL, which means no shading lines.
- angle: You can assign the slope of shading lines using this argument.
- col: Please specify the vector of colors you want to use. By default, it uses a set of 6 Pascal colors.
- border, lty: This argument (possibly vector) passed to a polygon, which draws each slice of it.
- Main: You can provide the Title.
Create a basic R Pie Chart
In this example, we show how to create it using the vectors. First, we declared one vector of random numbers and another vector of random countries.
Next, we used the programming pie to draw the chart. From the below code snippet, you can observe that values decide Slice size.
values <-  c(906, 264, 289, 339, 938)
countries <-  c("India","Sri Lanka","Nepal","Bhutan", "China")

pie(values, labels = countries)
Changing Borders and lty
In this example, we show how to change the border color and the line style using border and lty arguments.
#  Border and lty Example

values <-  c(906, 264, 289, 339, 938)
countries <-  c("India","Sri Lanka","Nepal","Bhutan", "China")

pie(values, labels = countries, border = "red", lty = 2)
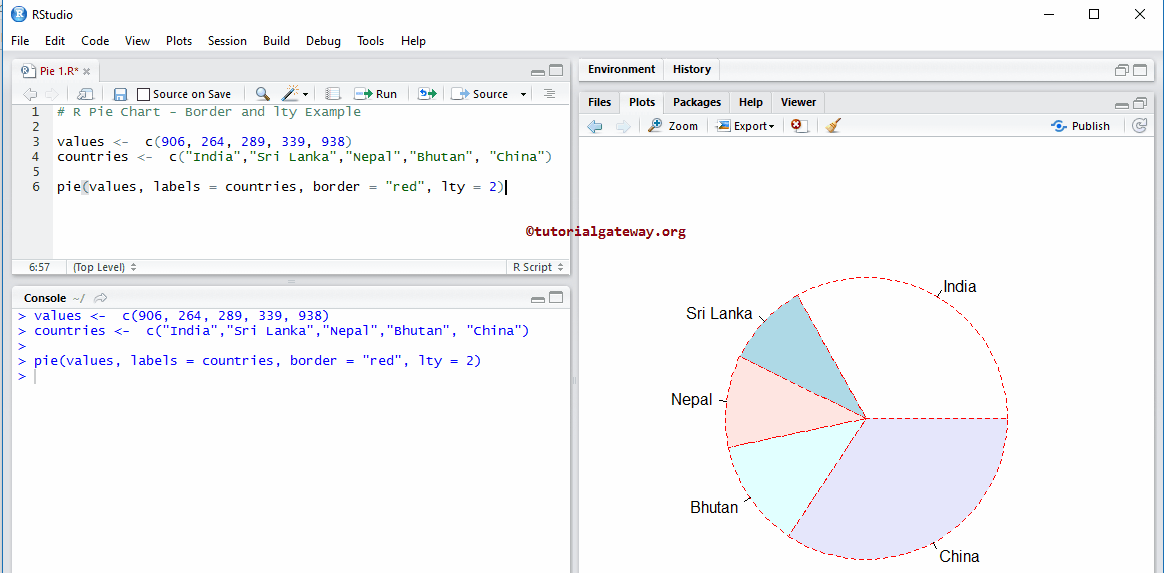
TIP: We use a Vector of colors to assign different border colors. For example, border = c(“red”, “green”, “black”…)
Create a Pie Chart in R Programming
We create a Pie Chart using the external data. For this, we are importing data from the CSV file using the read.csv function. I suggest you refer to the Read CSV article to understand the steps involved in CSV file import in R Programming.
From the code snippet below, we used the Aggregate function to find the total amount of sales in each country. Or we can say the Sum of Sales Amount Group By Countries. This statement returns the output as a List.
So, we are using the $ to extract data from the List.
getwd()

employee <- read.csv("Products.csv", TRUE, sep = ",")
data <- aggregate(employee$SalesAmount,
                  by=list(employee$EnglishCountryRegionName), FUN=sum)
print(data)

pie(data$x, data$Group.1)
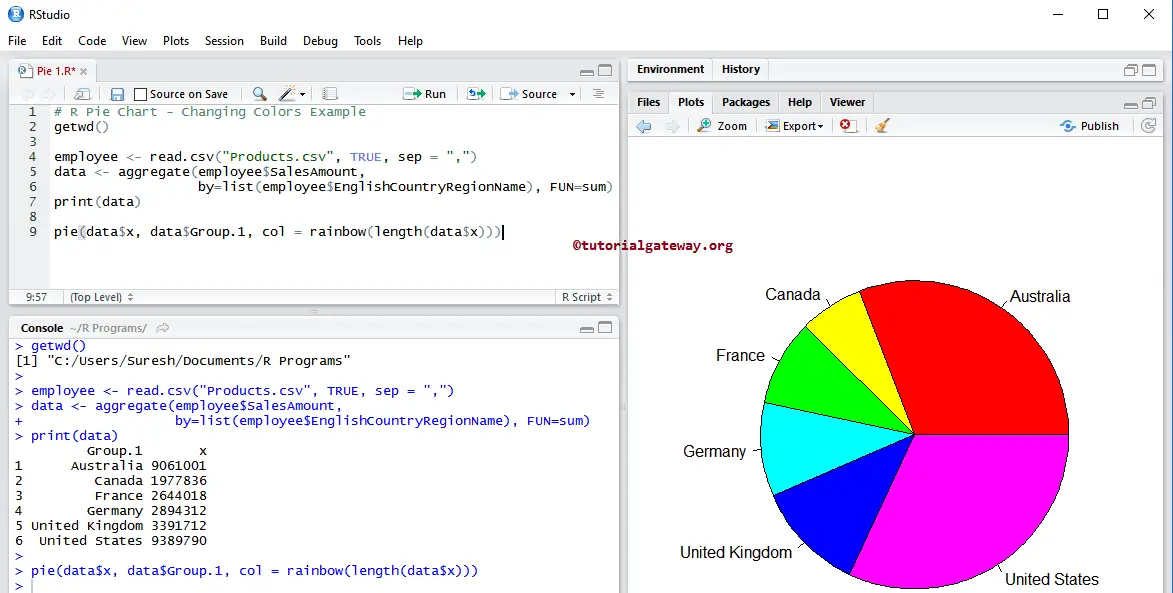
Change the Colors of a Pie Chart
In this example, we change the Slice colors using the col argument
# Changing Colors Example
getwd()

employee <- read.csv("Products.csv", TRUE, sep = ",")
data <- aggregate(employee$SalesAmount,
                  by=list(employee$EnglishCountryRegionName), FUN=sum)
print(data)

pie(data$x, data$Group.1, col = rainbow(length(data$x)))
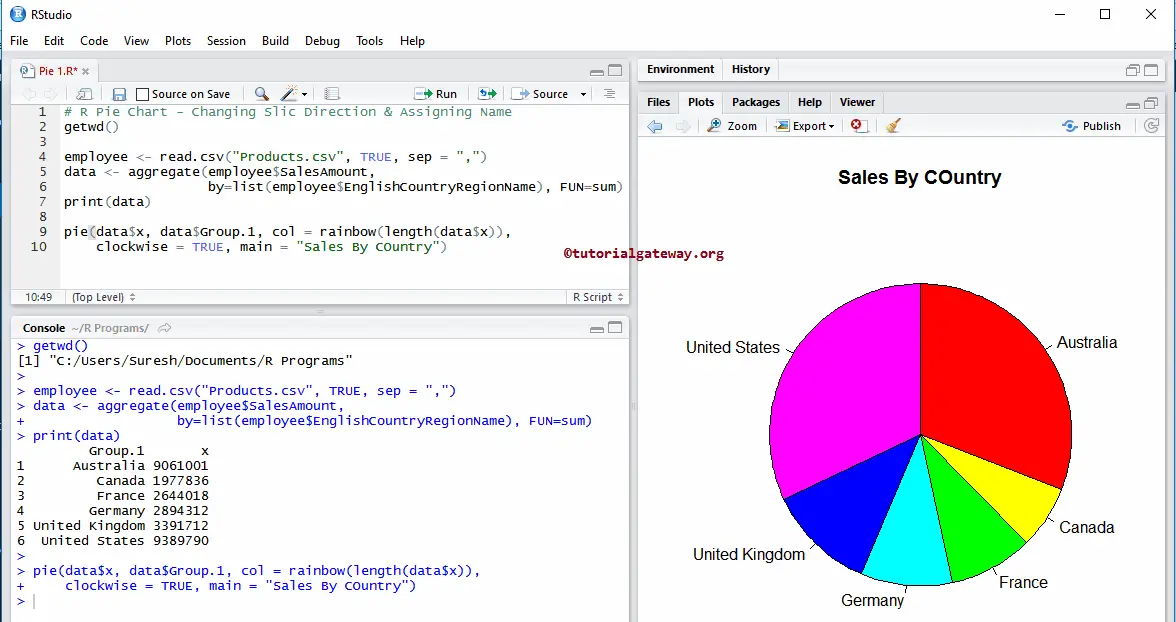
Change Slice Direction & Name of R Pie Chart
We change the Pie chart Slice direction using a clockwise argument and assign a title/name using the main argument.
# Changing Slic Direction & Assigning Name
getwd()

employee <- read.csv("Products.csv", TRUE, sep = ",")
data <- aggregate(employee$SalesAmount,
                  by=list(employee$EnglishCountryRegionName), FUN=sum)
print(data)

pie(data$x, data$Group.1, col = rainbow(length(data$x)),
    clockwise = TRUE, main = "Sales By COuntry")
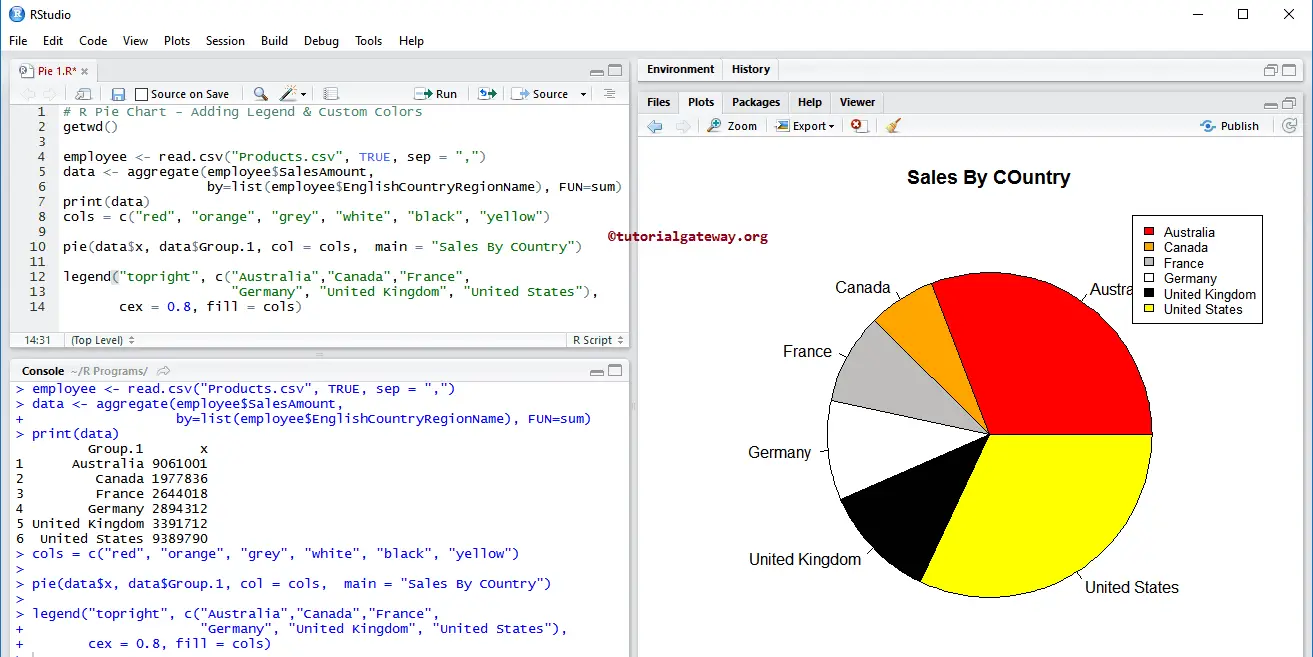
Adding Legend
Here, we add a Legend to the Pie chart using the legend function
# Adding Legend & Custom Colors
getwd()

employee <- read.csv("Products.csv", TRUE, sep = ",")
data <- aggregate(employee$SalesAmount,
                  by=list(employee$EnglishCountryRegionName), FUN=sum)
print(data)
cols = c("red", "orange", "grey", "white", "black", "yellow")

pie(data$x, data$Group.1, col = cols,  main = "Sales By COuntry")

legend("topright", c("Australia","Canada","France",
                     "Germany", "United Kingdom", "United States"),
       cex = 0.8, fill = cols)
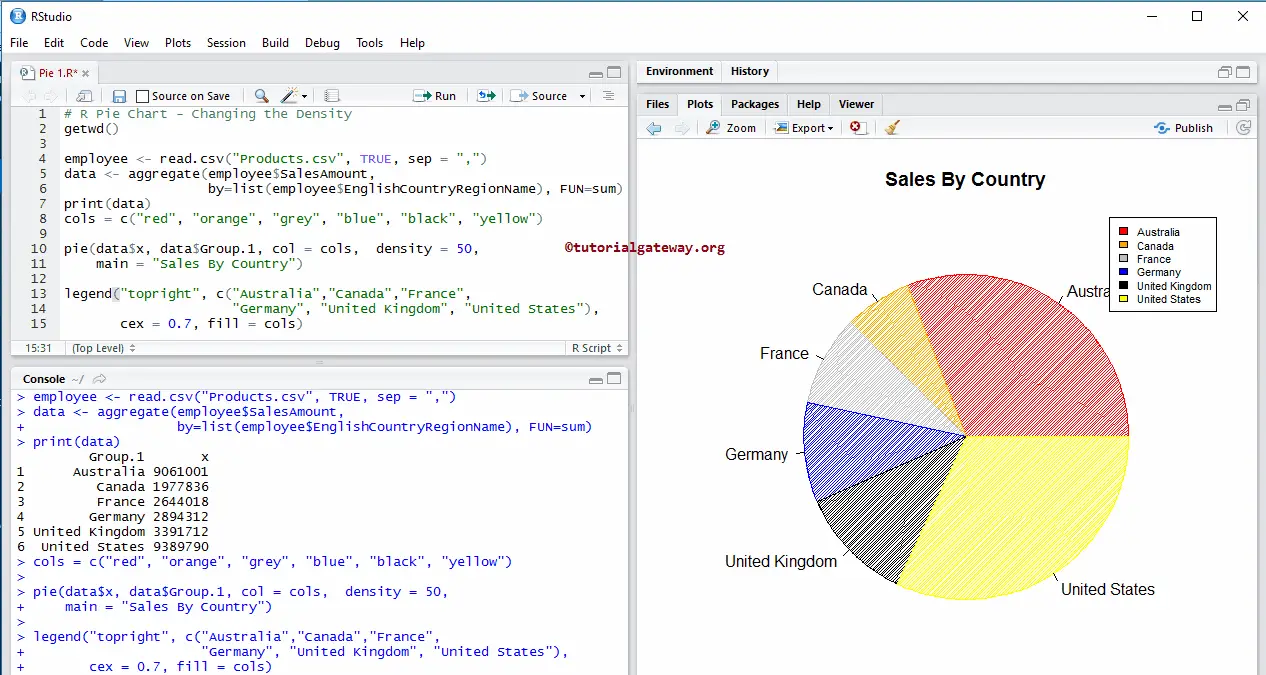
Change the Density of a Slice
We change the Slice density using the density argument of the Pie chart.
# Changing the Density
getwd()

employee <- read.csv("Products.csv", TRUE, sep = ",")
data <- aggregate(employee$SalesAmount,
                  by=list(employee$EnglishCountryRegionName), FUN=sum)
print(data)
cols = c("red", "orange", "grey", "blue", "black", "yellow")

pie(data$x, data$Group.1, col = cols,  density = 50,
    main = "Sales By Country")

legend("topright", c("Australia","Canada","France",
                     "Germany", "United Kingdom", "United States"),
       cex = 0.7, fill = cols)
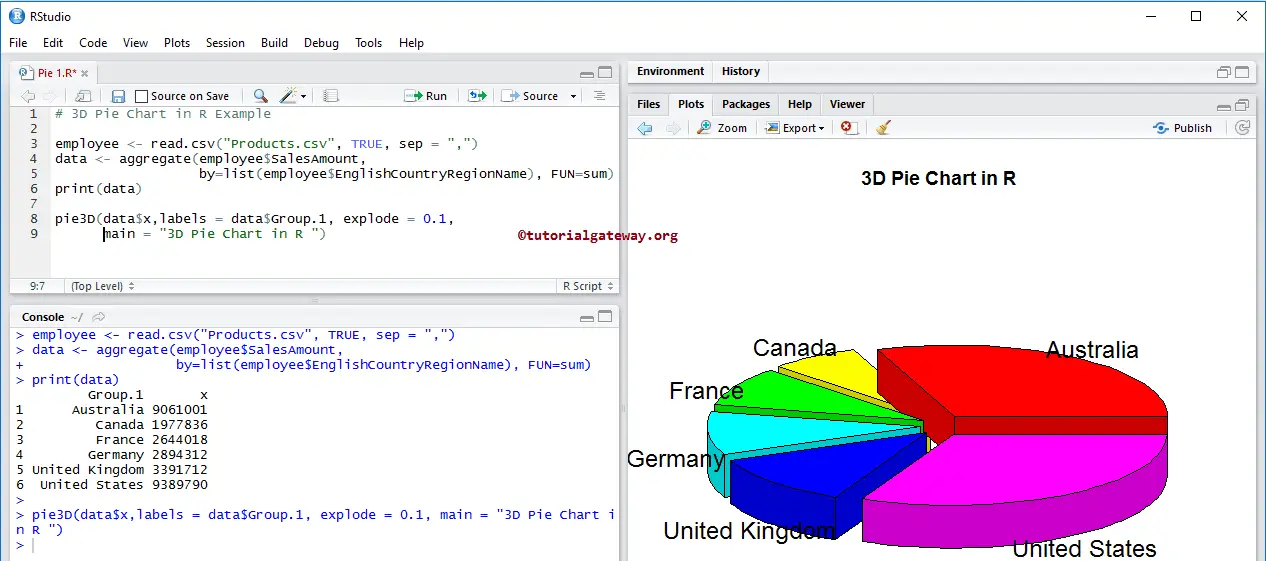
3D Pie Chart in R Programming
Let us see how to create a 3D Pie chart. To draw the 3D Pie chart, we need a pie3D function, and to use this function, we have to add a plotrix library (package) to our Studio.
# 3D Example

employee <- read.csv("Products.csv", TRUE, sep = ",")
data <- aggregate(employee$SalesAmount,
                  by=list(employee$EnglishCountryRegionName), FUN=sum)
print(data)

pie3D(data$x,labels = data$Group.1, explode = 0.1,
      main = "3D Pie Chart in R ")
Comments are closed.