The Mosaic Plot in R Programming is very useful to visualize the data from the contingency table or two-way frequency table. The R Mosaic Plot draws a rectangle, and its height represents the proportional value. From the second example, you see the White color products are the least selling in all the countries.
Let us see how to Create a Mosaic Plot, Format its color, borders, shades, and changing directions of the mosaic plot in R Programming language with an example.
R Mosaic Plot Syntax
The syntax to draw the MosaicPlot, or Mosaic Plot in R Programming is as shown below
mosaicplot(x, color = NULL, main = "Title")
and the complex syntax behind this Mosaic Plot is:
mosaicplot(x, sort = NULL, color = NULL, border = NULL,
        main = deparse(substitute(x), sub = NULL, xlab = NULL, ylab = NULL,
        off = NULL, dir = NULL, cex.axis = 0.66, shade = FALSE, margin = NULL,
        las = par("las"), type = c("Pearson", "deviance", "FT",…)
and the Formula based syntax behind this Mosaic Plot is:
mosaicplot(formula, data = NULL, main = deparse(substitute(x),
           subset, na.action = stats::na.omit)
The following are the list of arguments supported by the Mosaic Plot in R programming language:
- data: Please specify the DataFrame or List that contains the data to draw a mosaic plot. In this example, it is airquality & products
- subset: You can restrict the Mosaic plot to draw some data by specifying the vector of values. For example, you can restrict the Mosaic plot to the Female population only.
- x: Please specify the data from which you want to draw the mosaic plot. Here, you have to use a contingency table in an Array form. You can use table() function to create a table from your DataFrame.
- sort: Ordering the vector variables.
- margin: Please specify a list of Vectors with marginal totals.
- na.action: Here, you have to specify your stand on variables that contain NAs. By default, mosaic plots omit the cases with NAs but you can use this argument to replace those NA values with more meaningful values.
- cex.axis: Used for the axis annotation
- type: Please specify a character string indicating the residual type to be represented.
Create basic Mosaic Plot in R
In this example, we show you how to create a mosaic plot using the airquality data set, which is provided by the RStudio.
# Mosaic Plot Example
airquality

table1 <- table(airquality$Temp, airquality$Month)
mosaicplot(table1)
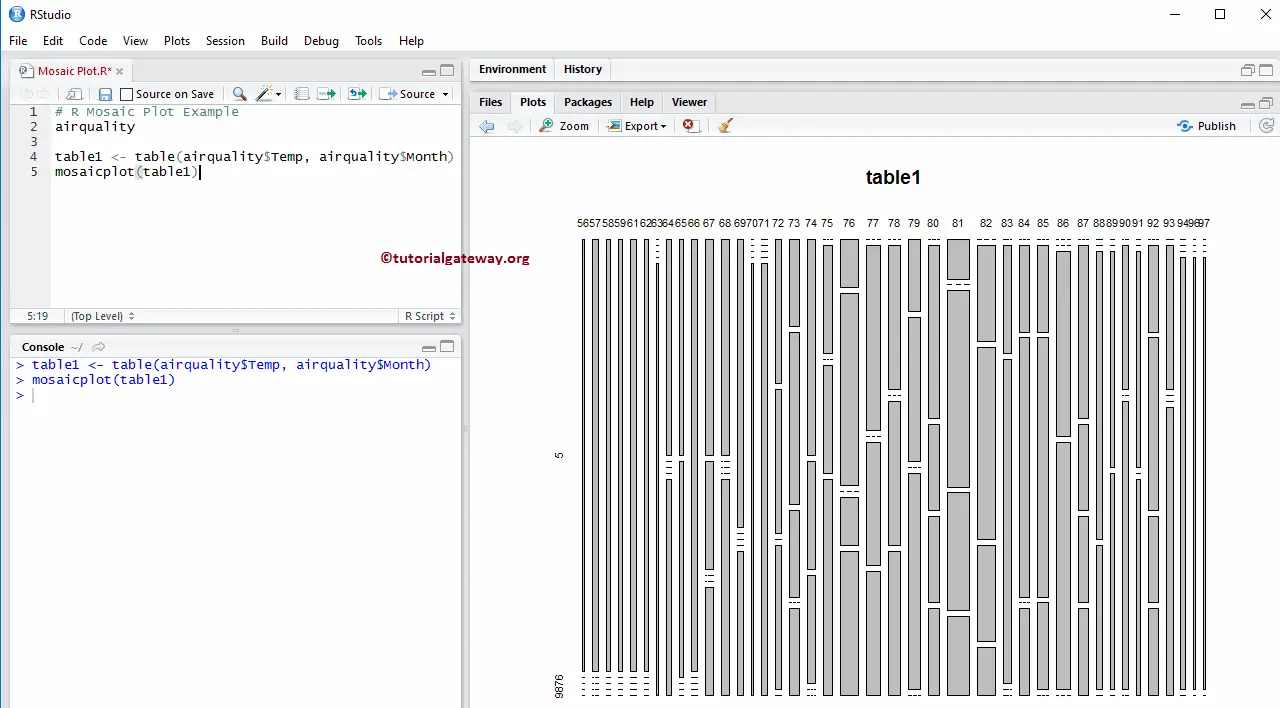
First, we created a table for air quality temp and month
table1 <- table(airquality$Temp, airquality$Month)
Next, we used the mosaicplot function to draw the mosaic plot. From the below code snippet, you can observe that we have used the table to draw the mosaic chart.
mosaicplot(table1)
Create a Mosaic plot in R Programming
In this example, we show how to create a mosaic plot using the external data. For this, we are importing data from the csv file using read.csv function. I suggest you to refer to R Read CSV article to import the CSV file in R Programming.
# Mosaic Plot Example
getwd()

employee <- read.csv("Products.csv", TRUE, sep = ",",
                     na.strings = TRUE)

count <- table(employee$EnglishCountryRegionName,
               employee$Color)
count
mosaicplot(count)
Within this Mosaic plot example, the following statement imports the data from the CSV file
employee <- read.csv("Products.csv", TRUE, sep = ",",
                     na.strings = TRUE)
From the below code snippet, see that we used the table() function to create a table for Product Color and the Country name.
count <- table(employee$EnglishCountryRegionName,
               employee$Color)
The above statement returns the output as a table. So, we are using that table to draw a mosaic plot.
mosaicplot(count)
Assigning names to Mosaic plot in R Programming
In this example, we assign names to the mosaic plot title, X-Axis, and Y-Axis using main, xlab, ylab, and sub.
- main: You can change or provide the character string for the Mosaic Plot Title.
- sub: You can provide the subtitle (if any) for your Mosaic Plot.
- xlab: Please specify the label for the X-Axis
- ylab: Please specify the label for the Y-Axis
- las: Used to change the Y-axis values direction.
# Mosaic Plot Example - Adding Names
getwd()

employee <- read.csv("Products.csv", TRUE, sep = ",",
                     na.strings = TRUE)

count <- table(employee$EnglishCountryRegionName,
               employee$Color)
count
mosaicplot(count, main = "Countries Mosaic Plot",
           sub = "Product Colors by Country",
           xlab = "Countries",
           ylab = "Colors",
           las = 1)
Change Colors of the Mosaic Plot in R
In this example, we change the Mosaics colors using color argument, and border color using border argument.
- color: Please specify the Logical or Vector of colors you want to use for your mosaic plot shading. This argument is used when the shade argument is set to FALSE or NULL (default value). Type colors() in your console to get the list of colors available in R programming.
- border: Please specify the color you want to add for the borders.
# Mosaic Plot Example - Adding Names
getwd()

employee <- read.csv("Products.csv", TRUE, sep = ",",
                     na.strings = TRUE)

count <- table(employee$EnglishCountryRegionName,
               employee$Color)
count
mosaicplot(count, main = "Countries Mosaic Plot",
           sub = "Product Colors by Country",
           xlab = "Countries",
           ylab = "Colors",
           las = 1,
           color = "skyblue2",
           border = "chocolate")
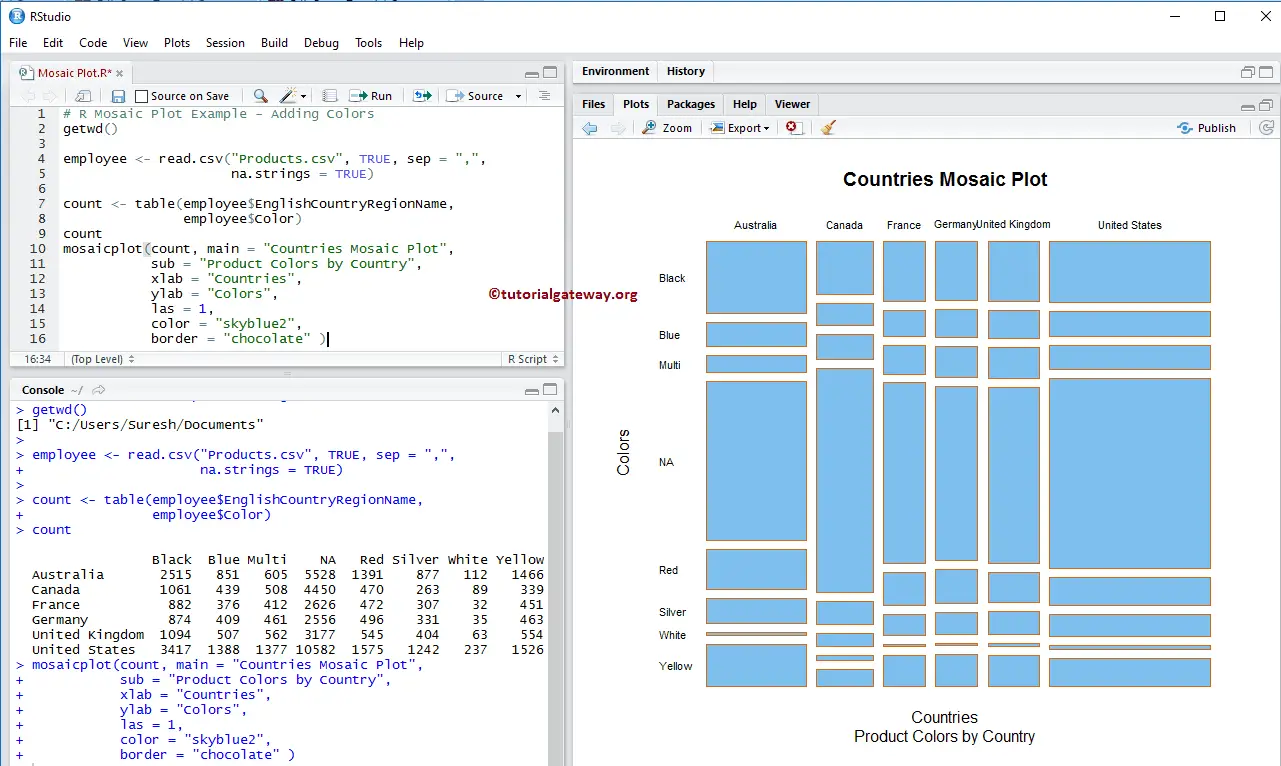
TIP: To assign different colors for mosaic, you have to use the Vector of colors. For example, color = c(“red”, “black”, “green”, …)
Horizontal Mosaic Plot in R Programming
In this plot example, we show how to change the direction of the mosaic using the dir argument.
- dir: Please specify a Vector of split directions for each level of the mosaic. Here, “v” is for Vertical, and “h” is for horizontal.
# Mosaic Plot Example - Changing Direction
getwd()

employee <- read.csv("Products.csv", TRUE, sep = ",",
                     na.strings = TRUE)

count <- table(employee$EnglishCountryRegionName,
               employee$Color)
count
mosaicplot(count, main = "Countries Mosaic Plot",
           sub = "Product Colors by Country",
           xlab = "Colors",
           ylab = "Countries",
           las = 1,
           dir = c("h", "v"),
           color = "skyblue2",
           border = "chocolate")
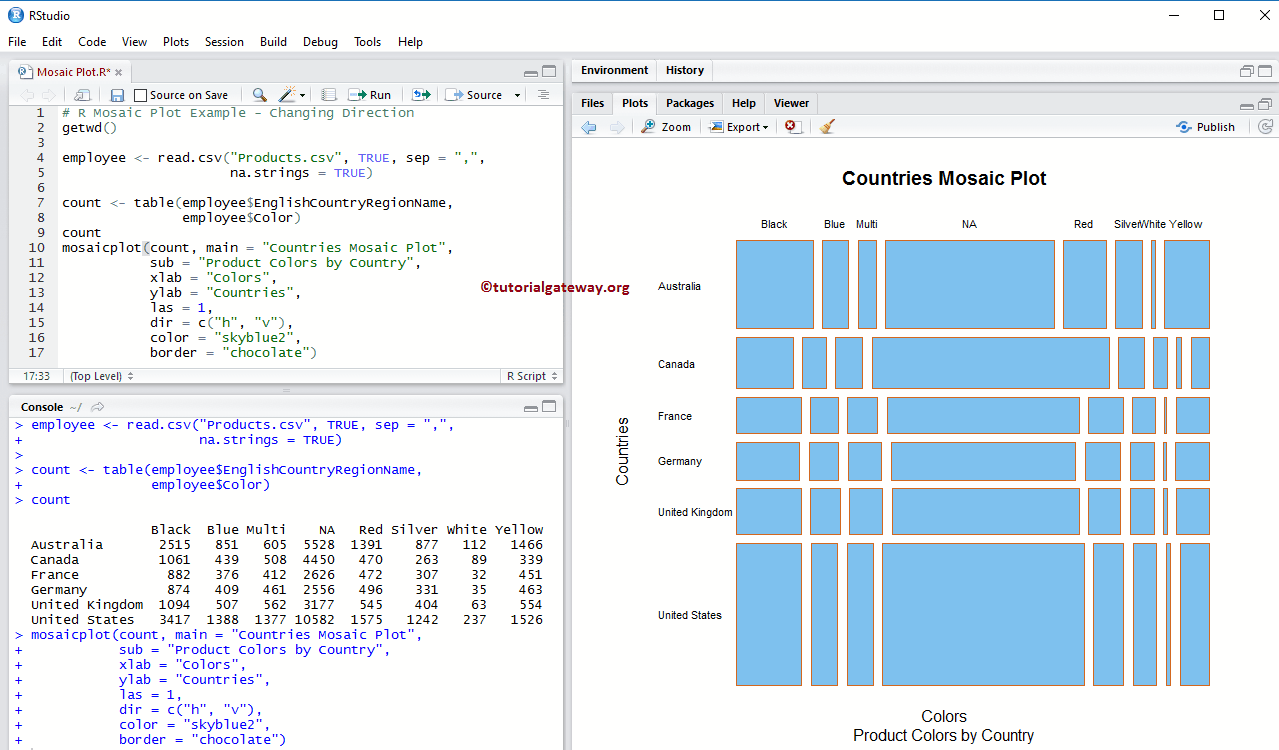
From the above screenshot, you can observe that we changed the Horizontal axis to Vertical and Vice-versa.
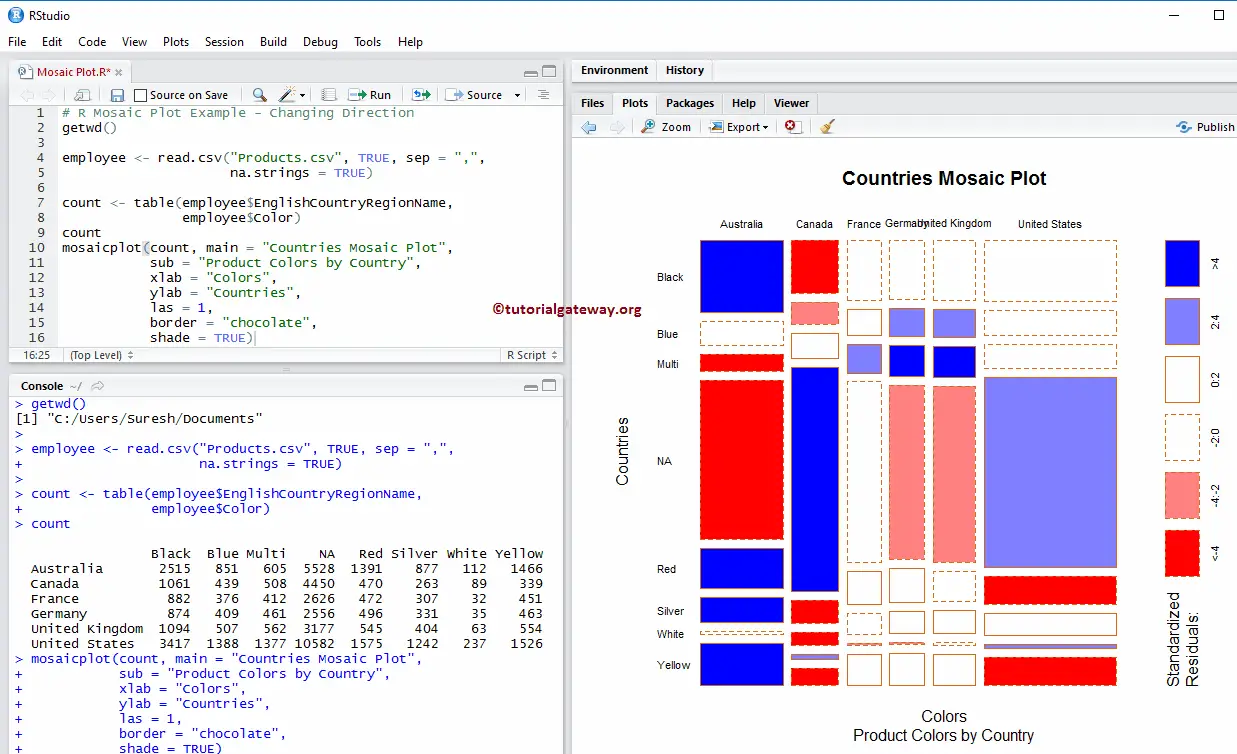
Changing Shades of a Mosaic Plot
In this Mosaic plot example, we show how to use shade argument
- shade: A logical value indicating whether to produce an extended mosaic plot. You can also use a numeric vector of at most 5 positive numbers.
# Mosaic Plot Example - Changing Direction
getwd()

employee <- read.csv("Products.csv", TRUE, sep = ",",
                     na.strings = TRUE)

count <- table(employee$EnglishCountryRegionName,
               employee$Color)
count
mosaicplot(count, main = "Countries Mosaic Plot",
           sub = "Product Colors by Country",
           xlab = "Colors",
           ylab = "Countries",
           las = 1,
           border = "chocolate",
           shade = TRUE)
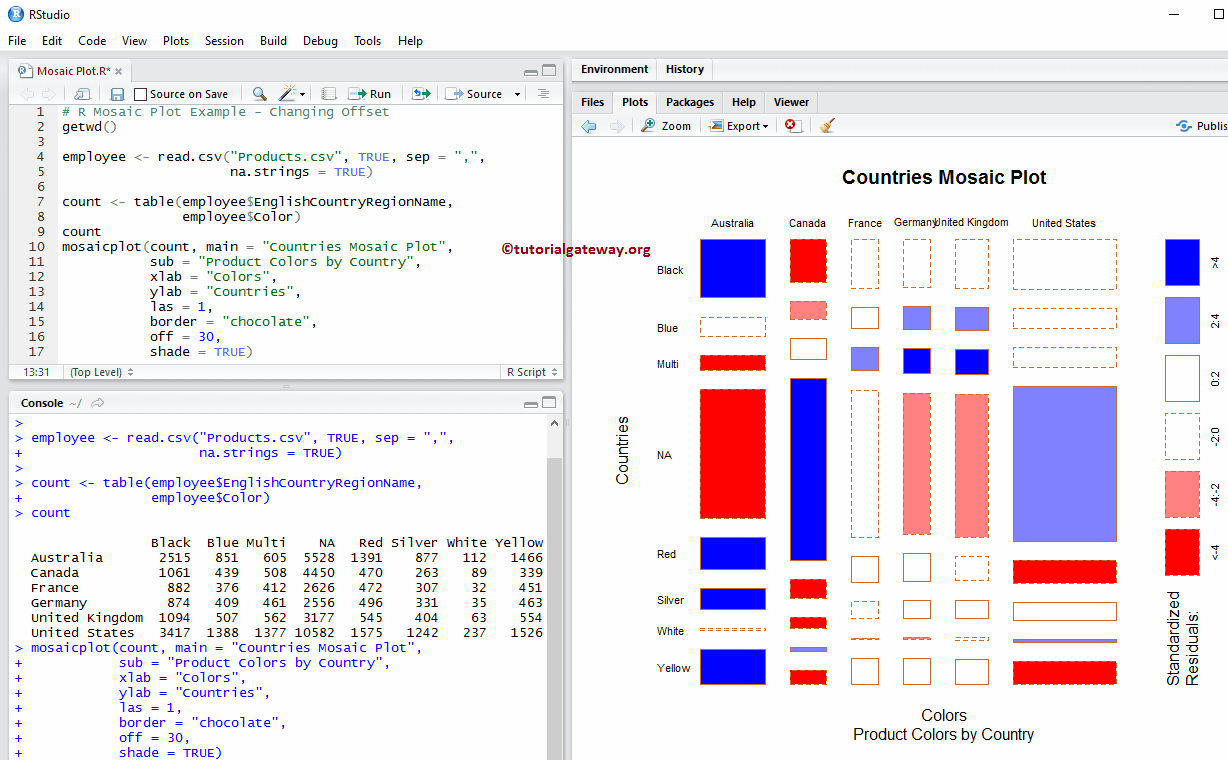
Increase Space between Mosaic plot
In this plot example, we increase the space between each mosaic using off argument.
- off: Please specify a Vector of offset values to determine the percentage spacing at each level of the mosaic plot. The default value is 20, and the approximate values are between 0 and 20.
# R Mosaic Plot Example - Changing Offset
getwd()

employee <- read.csv("Products.csv", TRUE, sep = ",",
                     na.strings = TRUE)

count <- table(employee$EnglishCountryRegionName,
               employee$Color)
count
mosaicplot(count, main = "Countries Mosaic Plot",
           sub = "Product Colors by Country",
           xlab = "Colors",
           ylab = "Countries",
           las = 1,
           border = "chocolate",
           off = 30,
           shade = TRUE)
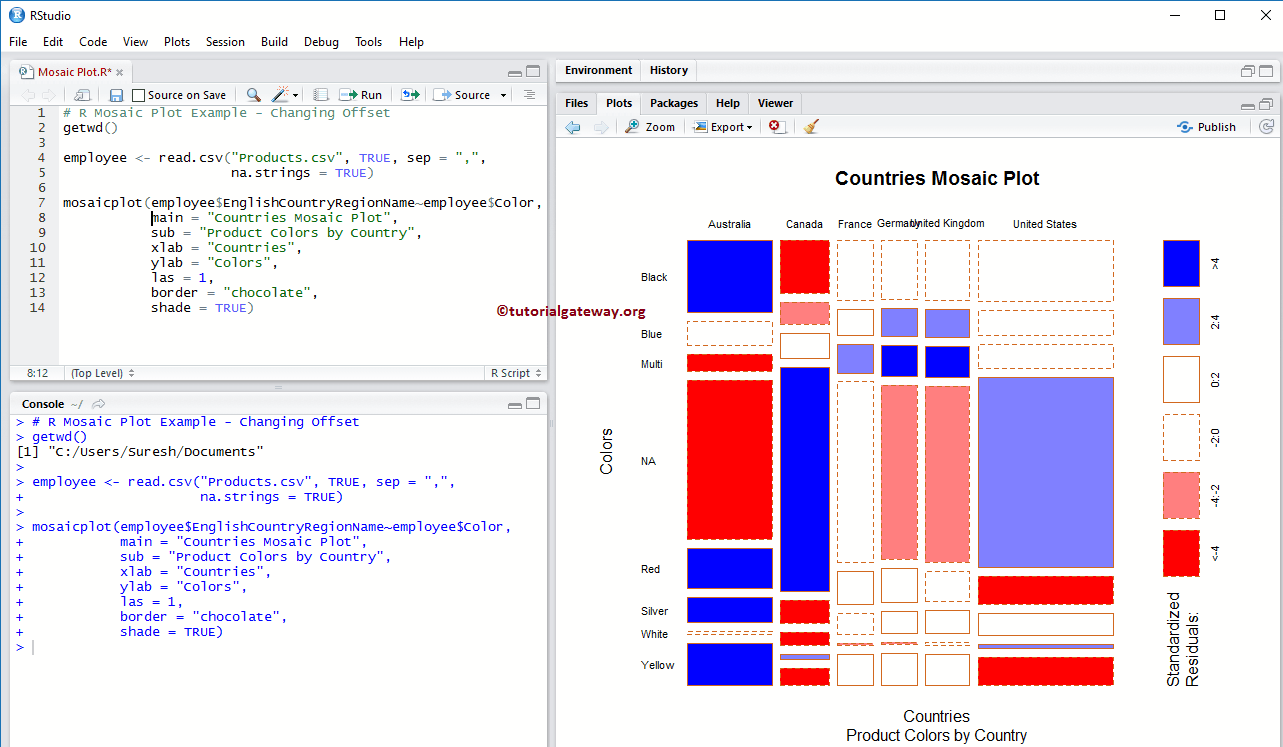
Use Formula to create a Mosaic plot
In this example, we create a mosaic plot using the formula argument.
- formula: It should be something like y~x
# R Mosaic Plot Example - Changing Offset
getwd()

employee <- read.csv("Products.csv", TRUE, sep = ",",
                     na.strings = TRUE)

mosaicplot(employee$EnglishCountryRegionName~employee$Color,
           main = "Countries Mosaic Plot",
           sub = "Product Colors by Country",
           xlab = "Countries",
           ylab = "Colors",
           las = 1,
           border = "chocolate",
           shade = TRUE)